The cloud service market is witnessing significant expansion, driven by enterprises’ growing reliance on digital infrastructure, scalable computing resources, and data-driven applications. Cloud adoption has accelerated due to the need for agility, cost optimization, and business continuity.
The proliferation of hybrid work models and data-intensive workloads has heightened demand for flexible service models across industries. Continuous investment in hyperscale data centers, AI integration, and edge computing is reshaping the competitive landscape.
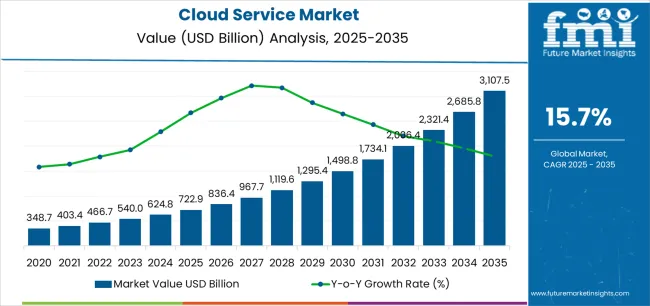
| Metric | Value |
|---|---|
| Cloud Service Market Estimated Value in (2025 E) | USD 722.9 billion |
| Cloud Service Market Forecast Value in (2035 F) | USD 3107.5 billion |
| Forecast CAGR (2025 to 2035) | 15.7% |
Cloud providers are enhancing cybersecurity, latency reduction, and compliance frameworks to meet evolving enterprise requirements. The market outlook remains positive, supported by the expansion of SaaS ecosystems, widespread migration of legacy systems, and the rise of subscription-based revenue models.
The market is segmented by Service Type, Deployment, Enterprise Size, and Industry and region. By Service Type, the market is divided into Software As A Service (SaaS), Platform As A Service (PaaS), and Infrastructure As A Service (IaaS). In terms of Deployment, the market is classified into Public Cloud, Private Cloud, and Hybrid Cloud. Based on Enterprise Size, the market is segmented into Large Enterprise and SMEs. By Industry, the market is divided into IT & Telecom, BFSI, Healthcare, Manufacturing, and Others. Regionally, the market is classified into North America, Latin America, Western Europe, Eastern Europe, Balkan & Baltic Countries, Russia & Belarus, Central Asia, East Asia, South Asia & Pacific, and the Middle East & Africa.
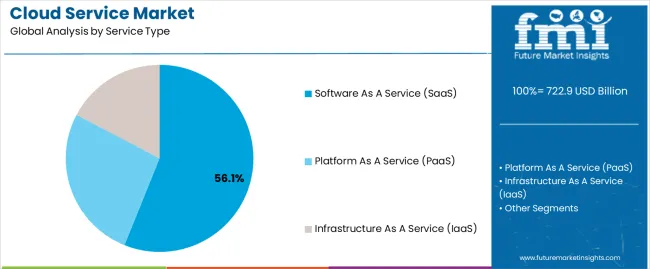
The software as a service (SaaS) segment leads the service type category, holding approximately 56.1% share. Its leadership is attributed to the widespread adoption of subscription-based software solutions across industries seeking scalability and reduced IT overhead.
SaaS enables easy deployment, regular updates, and remote accessibility, making it a preferred model for enterprise applications. Growth is further supported by the integration of analytics, collaboration tools, and AI functionalities within SaaS platforms.
Startups and SMEs are increasingly adopting SaaS to enhance operational efficiency and customer engagement without large capital investments. With continuous innovation and vertical-specific software offerings, the SaaS segment is expected to sustain its dominant market share.
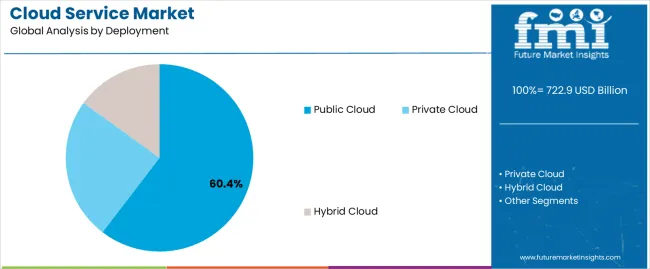
The public cloud segment dominates the deployment category with approximately 60.4% share, supported by its cost-effectiveness, scalability, and minimal maintenance requirements. Enterprises are leveraging public cloud infrastructure to host workloads, applications, and storage solutions without the constraints of physical infrastructure.
Major service providers offer advanced automation and AI-based management tools that enhance performance and security. The segment benefits from growing demand among startups, developers, and SMEs for flexible computing environments.
With hyperscalers expanding global data center networks, the public cloud segment is expected to continue leading the deployment landscape.
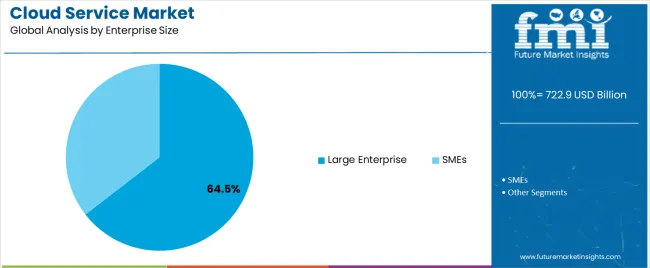
The large enterprise segment holds approximately 64.5% share in the enterprise size category, driven by extensive digital transformation initiatives and the need for robust data management frameworks. These organizations rely heavily on cloud services for process optimization, cost efficiency, and global collaboration.
Large enterprises are also leading adopters of hybrid and multi-cloud architectures to ensure operational resilience. The segment’s dominance is reinforced by substantial IT budgets and a strategic focus on automation and analytics.
With continuous investment in advanced computing resources and cybersecurity, large enterprises are expected to remain the primary contributors to cloud service market revenue.
Between 2020 and 2025, the cloud service market demonstrated robust growth, with a historical CAGR of 14.9%. This period witnessed significant adoption of cloud solutions across various industries, driven by the increasing demand for scalable, cost-effective, and flexible computing resources to support digital transformation initiatives.
Factors such as the proliferation of Software as a Service (SaaS) applications, hybrid and multi-cloud strategies, and advancements in technologies like artificial intelligence and edge computing contributed to the strong performance during this timeframe.
The forecasted CAGR for the cloud service market from 2025 to 2035 is projected to further accelerate to 15.7%. This forecast reflects the continued expansion and maturation of the cloud service industry, fueled by ongoing digitalization efforts, increasing adoption of cloud-native technologies, and the growing importance of data-driven decision-making.
Factors such as the continued shift towards remote work, the proliferation of Internet of Things (IoT) devices, and the rising demand for edge computing capabilities are expected to drive sustained growth in the cloud service market over the forecast period.
| Historical CAGR from 2020 to 2025 | 14.9% |
|---|---|
| Forecast CAGR from 2025 to 2035 | 15.7% |
The provided table illustrates the top five countries in terms of revenue, with Australia and New Zealand leading the list.
One major reason Australia and New Zealand lead the cloud service market is their strong embrace of innovation and technology adoption. Both countries have a culture that values innovation and are early adopters of new technologies.
The proactive approach has LED to the widespread adoption of cloud service among businesses and government organizations in Australia and New Zealand. A robust digital infrastructure, proactive government policies, and a skilled workforce further contribute to their leadership in the cloud service market.
| Countries | Forecast CAGRs from 2025 to 2035 |
|---|---|
| The United States | 12.6% |
| Germany | 15.2% |
| Japan | 16.9% |
| China | 16.2% |
| Australia and New Zealand | 19.2% |
The United States is a global leader in technological innovation, with a thriving ecosystem of tech companies and startups. Cloud service are extensively used here due to the advanced digital infrastructure, strong emphasis on innovation, and large market for digital products and service.
The diverse range of industries in the United States, from tech and finance to healthcare and manufacturing, drives demand for cloud service to support various business operations and digital transformation initiatives.
Germany is renowned for its manufacturing prowess and industrial excellence. Cloud service are widely utilized here to enhance efficiency, agility, and competitiveness across the manufacturing sector.
With a focus on Industry 4.0 and smart manufacturing initiatives, businesses leverage cloud technologies to optimize production processes, enable real-time data analytics, and foster innovation in product development and supply chain management.
Japan has a rich history of technological innovation and a highly developed digital infrastructure. Cloud service are extensively used in Japan to drive digital transformation across various industries, including automotive, electronics, retail, and finance.
With a strong emphasis on innovation and efficiency, Japanese businesses leverage cloud solutions to improve customer experiences, streamline operations, and gain a competitive edge in the global market.
The rapid economic growth and digitalization drive the widespread adoption of cloud service. Chinese businesses harness cloud technologies to support e-commerce platforms, online payment systems, and digital marketing initiatives.
With the support of the government for digital infrastructure development and initiatives such as Made in China 2025, cloud service are crucial in advancing technological capabilities and fostering innovation across various sectors.
Australia and New Zealand strongly focus on innovation and technology adoption, driving significant demand for cloud service. Businesses in these countries leverage cloud technologies to improve agility, enhance collaboration, and drive innovation in diverse sectors such as healthcare, education, agriculture, and tourism.
The remote geography and dispersed population further underscore the importance of cloud service in enabling connectivity, accessibility, and digital transformation initiatives.
The below section shows the leading segment. The Software as a Service (SaaS) service type is accounted to hold a share of 56.1% in 2025. Based on deployment, the public cloud segment is anticipated to account for a market share of 60.4% in 2025.
SaaS solutions allow businesses to scale their software usage up or down according to their needs without significant upfront investment in additional infrastructure or software licenses.
Public cloud service offer a pay-as-you-go pricing model, allowing organizations to pay only for the computing resources they use without the need for large upfront capital investments in hardware or software.
| Category | Market share in 2025 |
|---|---|
| Software as a Service (SaaS) | 56.1% |
| Public Cloud | 60.4% |
In 2025, Software as a Service (SaaS) dominates the market with a substantial share of 56.1%. This underscores the growing preference for SaaS solutions among businesses, driven by factors like scalability, accessibility, and cost-effectiveness.
SaaS offerings provide users with easy access to software applications over the internet without requiring extensive hardware infrastructure or upfront investment.
The public cloud segment is expected to hold a significant market share of 60.4% in 2025. Public cloud deployment offers flexibility, scalability, and cost-efficiency, making it a preferred choice for organizations seeking to leverage cloud computing resources from third-party providers.
The dominance reflects the widespread adoption of public cloud service across industries, driving the overall growth of the cloud service market.
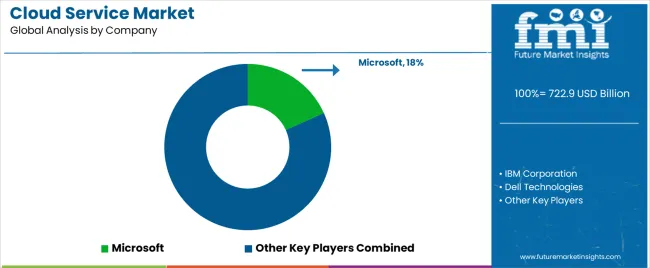
The competitive landscape of the cloud service market is characterized by intense competition among major players such as Amazon Web Service (AWS), Microsoft Azure, and Google Cloud Platform (GCP), along with many smaller vendors. These companies compete on various fronts, including pricing, performance, reliability, security, and the breadth of service offered.
Niche players and regional providers contribute to the competitive dynamics, catering to specific industry verticals or geographic regions. Partnerships, acquisitions, and innovations drive differentiation as providers seek to gain market share and meet the evolving needs of businesses migrating to the cloud for digital transformation initiatives.
Some of the key developments are:
| Attributes | Details |
|---|---|
| Estimated Market Size in 2025 | USD 722.9 billion |
| Projected Market Valuation in 2035 | USD 3107.5 billion |
| Value-based CAGR 2025 to 2035 | 15.7% |
| Forecast Period | 2025 to 2035 |
| Historical Data Available for | 2020 to 2025 |
| Market Analysis | Value in USD billion |
| Key Regions Covered | North America; Latin America; Western Europe; Eastern Europe; South Asia and Pacific; East Asia; Middle East and Africa |
| Key Market Segments Covered | Service Type, Deployment, Enterprise Size, Industry, Region |
| Key Countries Profiled | The United States, Canada, Brazil, Mexico, Germany, The United Kingdom, France, Spain, Italy, Russia, Poland, Czech Republic, Romania, India, Bangladesh, Australia, New Zealand, China, Japan, South Korea, GCC countries, South Africa, Israel |
| Key Companies Profiled | IBM Corporation; Dell Technologies; SAP; Google; Oracle Corporation; Cisco System Inc.; AWS; Fujitsu Global; Rackspace Technologies Inc.; Microsoft |
The global cloud service market is estimated to be valued at USD 722.9 billion in 2025.
The market size for the cloud service market is projected to reach USD 3,107.5 billion by 2035.
The cloud service market is expected to grow at a 15.7% CAGR between 2025 and 2035.
The key product types in cloud service market are software as a service (saas), platform as a service (paas) and infrastructure as a service (iaas).
In terms of deployment, public cloud segment to command 60.4% share in the cloud service market in 2025.


Our Research Products

The "Full Research Suite" delivers actionable market intel, deep dives on markets or technologies, so clients act faster, cut risk, and unlock growth.

The Leaderboard benchmarks and ranks top vendors, classifying them as Established Leaders, Leading Challengers, or Disruptors & Challengers.

Locates where complements amplify value and substitutes erode it, forecasting net impact by horizon

We deliver granular, decision-grade intel: market sizing, 5-year forecasts, pricing, adoption, usage, revenue, and operational KPIs—plus competitor tracking, regulation, and value chains—across 60 countries broadly.

Spot the shifts before they hit your P&L. We track inflection points, adoption curves, pricing moves, and ecosystem plays to show where demand is heading, why it is changing, and what to do next across high-growth markets and disruptive tech

Real-time reads of user behavior. We track shifting priorities, perceptions of today’s and next-gen services, and provider experience, then pace how fast tech moves from trial to adoption, blending buyer, consumer, and channel inputs with social signals (#WhySwitch, #UX).

Partner with our analyst team to build a custom report designed around your business priorities. From analysing market trends to assessing competitors or crafting bespoke datasets, we tailor insights to your needs.
Supplier Intelligence
Discovery & Profiling
Capacity & Footprint
Performance & Risk
Compliance & Governance
Commercial Readiness
Who Supplies Whom
Scorecards & Shortlists
Playbooks & Docs
Category Intelligence
Definition & Scope
Demand & Use Cases
Cost Drivers
Market Structure
Supply Chain Map
Trade & Policy
Operating Norms
Deliverables
Buyer Intelligence
Account Basics
Spend & Scope
Procurement Model
Vendor Requirements
Terms & Policies
Entry Strategy
Pain Points & Triggers
Outputs
Pricing Analysis
Benchmarks
Trends
Should-Cost
Indexation
Landed Cost
Commercial Terms
Deliverables
Brand Analysis
Positioning & Value Prop
Share & Presence
Customer Evidence
Go-to-Market
Digital & Reputation
Compliance & Trust
KPIs & Gaps
Outputs
Full Research Suite comprises of:
Market outlook & trends analysis
Interviews & case studies
Strategic recommendations
Vendor profiles & capabilities analysis
5-year forecasts
8 regions and 60+ country-level data splits
Market segment data splits
12 months of continuous data updates
DELIVERED AS:
PDF EXCEL ONLINE
Cloud Service Assurance Market Size and Share Forecast Outlook 2025 to 2035
Cloud ELN Service Market Report – Trends, Demand & Outlook 2025-2035
Cloud Microservices – AI-Driven Scalability for Businesses
Cloud Field Service Management (FSM) Market Size and Share Forecast Outlook 2025 to 2035
Cloud Backup Service Industry Analysis in Latin America Size and Share Forecast Outlook 2025 to 2035
Cloud Managed Services Market
Cloud Printing Services Market Size and Share Forecast Outlook 2025 to 2035
Cloud Telephony Services Market Size and Share Forecast Outlook 2025 to 2035
Cloud Migration Service Market Size and Share Forecast Outlook 2025 to 2035
Cloud Professional Services Market Size and Share Forecast Outlook 2025 to 2035
Cloud-based Backup Services Market by Enterprise, End-User, and Region - Growth, Trends, and Forecast Through 2025 to 2035
Cloud Infrastructure-As-A-Service Market
Public Cloud Application Services Market Analysis - Size, Share, and Forecast Outlook 2025 to 2035
Public Cloud Application Infrastructure Services Market Size and Share Forecast Outlook 2025 to 2035
Private Cloud Services Market by Services, Type, Industry Vertical, and Region – Growth, Trends, and Forecast through 2025 to 2035
5G Edge Cloud Network and Services Market Size and Share Forecast Outlook 2025 to 2035
Business Cloud VoIP & UC Services Market Size and Share Forecast Outlook 2025 to 2035
AI Platform Cloud Service Market Size and Share Forecast Outlook 2025 to 2035
Asia Pacific Cloud Infrastructure Testing Services Market
Cloud Data Encryption Solutions Market Size and Share Forecast Outlook 2025 to 2035

Thank you!
You will receive an email from our Business Development Manager. Please be sure to check your SPAM/JUNK folder too.
Chat With
MaRIA