Cloud Field Service Management (FSM) Market Snapshot (2023 to 2033)

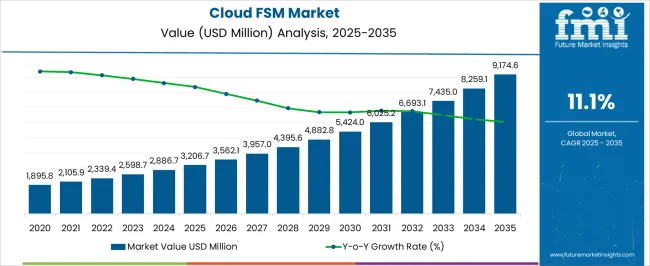
The global cloud field service management (FSM) market is anticipated to be valued at US$ 2,574.7 million in 2023. From 2023 to 2033, the overall market is projected to register a CAGR of 11.6% by FMI. FMI report further predicts the overall market to be valued at nearly US$ 7,738.4 million by the end of this forecast period. This impressive market growth is attributed to the rising demand for improved customer service experience and engagement.

Enterprises are implementing cloud field service management solutions to enhance their operational processes to meet customer needs without interruption. Cloud-based service management solutions are primarily used in the retail sector, owing to the continuous rise in consumer spending patterns.

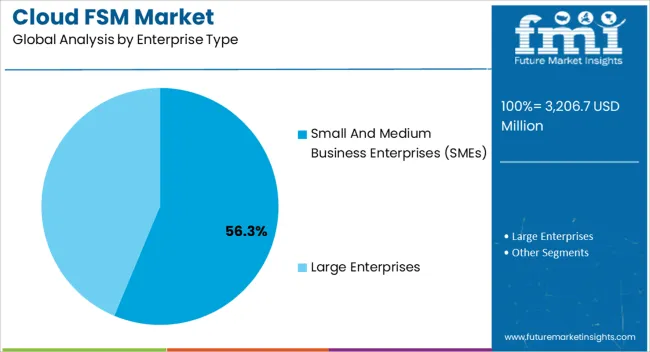
Moreover, small and medium enterprises are undergoing training programs on cloud field service management solutions to enrich their business needs.

North America is expected to dominate during the forecast period owing to the increasing demand for efficient computing frameworks by small and medium-sized business enterprises.

New functions like schedule optimization, workforce optimization, and territory planning improvements can give cloud FSM service providers useful information to expand their operations. Schedule optimization is a crucial area where many cloud field service management service providers may concentrate on growing their businesses in the coming days.

On the other hand, lack of awareness of the operational effectiveness and other benefits of technologically advanced systems is another factor projected to have a negative impact on the growth of the cloud field service management (FSM) market over the forecast period.

Attribute Details
Global Cloud Field Service Management (FSM) Market Valuation in 2022 US$ 2,340.6 million
Estimated Global Market Share in 2023 US$ 2,574.7 million
Forecasted Global Market Size by 2033 US$ 7,738.4 million
Projected Global Market Growth Rate from 2023 to 2033 11.6% CAGR
Historical Market Growth Rate from the Year 2018 to 2022 9.5%

Don't pay for what you don't need

Customize your report by selecting specific countries or regions and save 30%!

Global Cloud Field Service Management (FSM) Market Historical Analysis (2018 to 2022) Vs. Forecast Outlook (2023 to 2033)

In 2018, the net worth of total cloud field service management solutions adopted globally was a mere US$ 1,625.1 million. From 2018 to 2022, a CAGR of 9.5% was registered for the market raising its value to US$ 2,340.6 million by its end.

Some advanced cloud field service management applications now have intelligent resource management capabilities that assist businesses in effectively managing their personnel. They also help learn important information about the performance, productivity, and skill gaps of their technicians by utilizing real-time data and analytics.

Which are Some Prominent Drivers Spearheading Cloud Field Service Management (FSM) Market Growth?

The increasing use of IoT and cloud-based services boost the growth of the cloud field service management market. Lower costs and greater efficiency are driving the demand for the cloud field service management (FSM) market.

As cloud field service management provides access to customer information from any location, a reduction in operational overheads and fuel expenses, mobile workforce management, increased productivity, and improved customer satisfaction. Large companies use cloud field solutions to monitor and manage the activity and workforce on the field, which drives market growth.

A few of the applications of cloud field service management is consultations, customer support, sales, and maintenance among others. For instance, Oracle Field Service is a cloud-based solution that increase the efficiency of mobile workers by connecting them with customers and offices.

Sudip Saha
Sudip Saha

Principal Consultant

Talk to Analyst

Find your sweet spots for generating winning opportunities in this market.

What are the Challenges Faced by the Cloud Field Service Management (FSM) Industry?

Although the cloud field service management (FSM) market has numerous end-uses, there are numerous obstacles that pose a challenge to market growth.

Lack of awareness of the operational effectiveness and other benefits of technologically advanced systems is another factor projected to have a negative impact on the growth of the cloud field service management (FSM) market over the forecast period.

Maintaining the integration of existing Field Service management with cloud service management solutions is the key challenge most vendors face in the cloud field service management (FSM) market.

Category-based Insights

Use of FSM for Inventory Management Creates More Demand than Other Component Segments

Category By Component Type
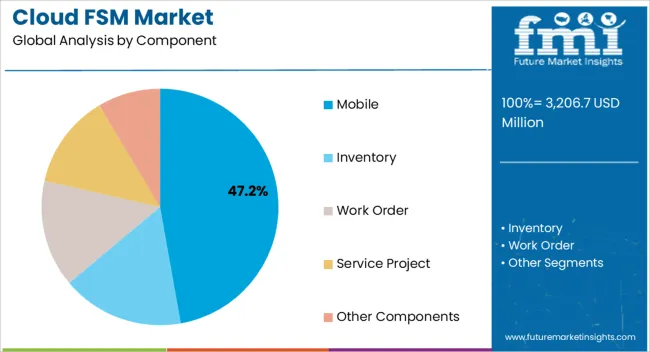
Top Segment Inventory Cloud Field Service Management
Market Share in Percentage 30.1%
Category By Service
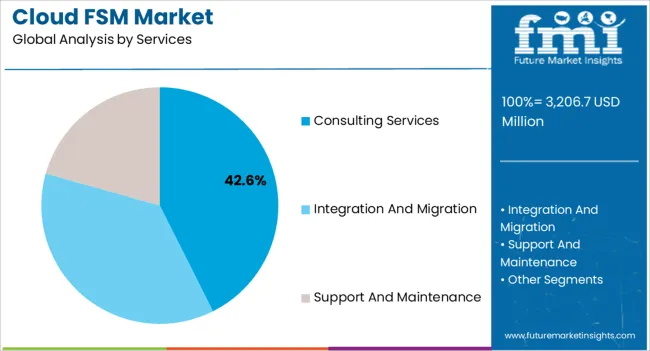
Top Segment Cloud Field Service Management Integration and Migration
Market Share in Percentage 49.8%

Field insights allow for efficient resource planning, training initiatives, and performance assessments, empowering organizations to maximize their personnel through data-driven decisions. By adopting FSM services, businesses can optimize employees' potential, improve the quality of their services, and facilitate scalable expansion. Also, with territory planning improvements, businesses can efficiently map and assign jobs based on client preferences, technician proximity, and geographic coverage.
Get the data you need at a Fraction of the cost

Personalize your report by choosing insights you need
and save 40%!

Comparative View of Adjacent Cloud Field Service Management (FSM) Market

Cloud Field Service Management (FSM) Market:

Attributes Cloud Field Service Management (FSM) Market
CAGR (2023 to 2033) 11.6%
Market Value (2023) US$ 2,574.7 million
Growth Factor Utilizing real-time data on field operations through a cloud FSM solution leads to cost savings and increased productivity.
Future Opportunities New territorial improvements might improve FSM techniques leading to more efficient operations and wider service coverage.
Market Trends Top players are embracing innovative capabilities for sustainable growth and delivering exceptional field service experiences to their customers

Service Integration and Management Market:

Attributes Service Integration and Management Market
CAGR (2023 to 2033) 9%
Market Value (2023) US$ 11,530 million
Growth Factor The recent rapid expansion of managed services, along with the growth and deployment of information and communication technology (ICT).
Future Opportunities Adoption of new technologies like big data analytics to enhance performance and timely delivery of services.
Market Trends Prominent players are encouraging further digitization of business processes in their target sectors to increase revenue generation.

Public Cloud Application Infrastructure Services Market:

Attributes Public Cloud Application Infrastructure Services Market
CAGR (2023 to 2033) 24.5%
Market Value (2023) US$ 10,253.8 million
Growth Factor The rising importance of public cloud infrastructure for businesses and its greater adoption in almost all service sectors.
Future Opportunities Greater adoption of public cloud infrastructure by government and public organizations in nations for improving transparency.
Market Trends Leading suppliers have acquired a competitive edge by utilizing real-time solutions to ensure quick and efficient problem response.

Why Is North America Emerging As An Opportunistic Cloud Field Service Management (FSM) Market?

Regional Market Comparison North America
Global Market Share in Percentage 27.6%
Regional Market Comparison Europe
Global Market Share in Percentage 20.1%

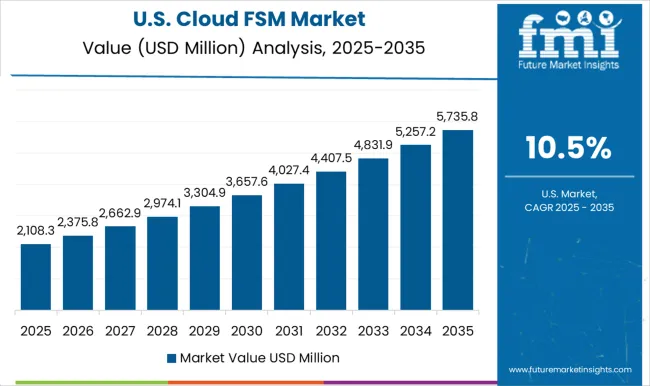
North America was the leading cloud field service management market, and the trend is expected to continue into the forecast period since North America has several cloud field service companies in the world. The region is forecast to have a 32.2% total cloud field service management market share. North America is expected to be the next dominant region witnessing high adoption rates for the cloud field service management market during the forecast period. With the rapid technological development and an increase in organizations in North America, demand for the cloud field service management market is anticipated to rise in the region.

Regional Market Comparison United States
Global Market Share in Percentage 19.9%
Regional Market Comparison Germany
Global Market Share in Percentage 7.1%
Regional Market Comparison Japan
Global Market Share in Percentage 2.9%
Regional Market Comparison Australia
Global Market Share in Percentage 2.1%

How Is Europe Contributing to The Growth of the Cloud Field Service Management (FSM) Market?

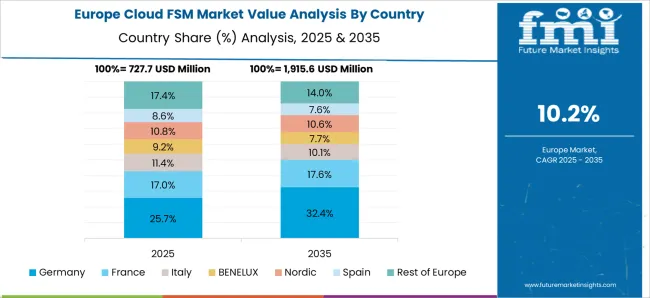
According to FMI, Europe is expected to provide immense growth opportunities for the cloud field service management market due to the expansion of the business sector in the region. The cloud field service management market is expected to witness sustained growth over the forecast period.

The growth of the cloud field service management market is driven by the increasing demand for efficient computing frameworks by small and medium size business enterprises in the region. Europe accounts for 20.7% of revenue in the global cloud field service management market.

Regional Markets United Kingdom
CAGR (2023 to 2033) 10.5%
Regional Markets China
CAGR (2023 to 2033) 13.4%
Regional Markets India
CAGR (2023 to 2033) 15.6%

Start-up-Scenario

BiznusSoft Field Service, NextService, Managemart.com, The Kantata Cloud for Professional Services, Binzusoft, and Smart Serv are some startup companies operating in the cloud field service management market.

In June 2022, Kantata, a SaaS platform-based company closed its first quarter, operating as a new company following the successful merger of Mavenlink and Kimble Applications. Through this merger, the firm aim to deliver a strong results driven by the growth of its client roster.
Market Competition

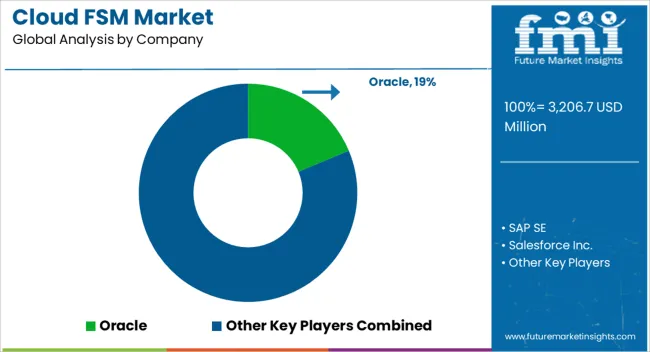
A few of the key participants present in the global cloud field service management market include Salesforce.Com, Inc., SAP SE, Oracle Corporation, IBM Corporation, Servicemax Inc., Microsoft Corporation, Acumatica Inc., and Astea International Inc., among others.

Attributed to the presence of several participants, the market is highly competitive. While global players such as Salesforce.Com, Inc., SAP SE, Oracle Corporation, and IBM Corporation account for considerable market size, several regional-level players are also operating across key growth regions.

  • In April 2022 - ServiceMax, announced the release of new features for Asset 360 for Salesforce. It offers features that take the product beyond traditional field service personas, empowering strategic stakeholders like chief revenue officers and chief operating officers, as well as operational and commercial stakeholders in the supply chain, sales, and marketing.
  • In June 2022 - Commvault formed a strategic partnership with Oracle to include Metallic DMaaS on Oracle Cloud. As part of Commvault’s multi-cloud strategy, Metallic’s industry-leading services may be offered on Oracle Cloud Infrastructure (OCI) and in all commercial OCI regions globally.
  • In March 2023 - The much-awaited Utah edition of ServiceNow's Field Service Management (FSM) application was released. This new edition adds several cutting-edge innovations that might completely alter how companies in the field service sector conduct business. Enhancements to territory planning are yet another important new feature that offers better capabilities for organizing and managing service regions.

Scope of the Market Report Scope

Report Attribute Details
Growth Rate CAGR of 11.6% from 2023 to 2033
Expected Market Value (2023) US$ 2,574.7 million
Anticipated Forecast Value (2033) US$ 7,738.4 million
Base Year for Estimation 2022
Historical Data 2018 to 2022
Forecast Period 2023 to 2033
Quantitative Units Revenue in US$ million or US$ billion and CAGR from 2023 to 2033
Report Coverage Revenue Forecast, Volume Forecast, Company Ranking, Competitive Landscape, Growth Factors, Trends, and Pricing Analysis
Segments Covered By Component, By Services, By Enterprise, By Region
Regions Covered North America; Latin America; Europe; East Asia; South Asia & Pacific; The Middle East and Africa (MEA)
Key Countries Profiled United States, Canada, Mexico, Brazil, Germany, Italy, United Kingdom, Spain, France, China, Japan, South Korea, Malaysia, Singapore, Australia, New Zealand, GCC, South Africa, Israel
Key Companies Profiled Salesforce.Com, Inc.; SAP SE; Oracle Corporation; IBM Corporation; Servicemax Inc.; Microsoft Corporation; Acumatica Inc.; Astea International Inc.
Customization & Pricing Available Upon Request

Key Segments Profiled in the Cloud Field Service Management (FSM) Industry Survey

Cloud Field Service Management (FSM) Industry Segments by Component:

  • Mobile
  • Inventory
  • Work Order
  • Service Project
  • Other Components

Cloud Field Service Management (FSM) Industry Segments by Services:

  • Consulting Services
  • Integration and Migration
  • Support and Maintenance

Cloud Field Service Management (FSM) Industry Segments by Enterprise Type:

  • Small and Medium Business Enterprises (SMEs)
  • Large Enterprises

Cloud Field Service Management (FSM) Industry Segments by Region:

  • North America
  • Latin America
  • Europe Cloud
  • East Asia
  • South Asia and Pacific
  • The Middle East and Africa (MEA)

Frequently Asked Questions

How Big will be the Cloud Field Service Management (FSM) Market by 2033?

The market is estimated to reach US$ 7,738.4 million by 2033.

What is the Growth Forecast for Cloud Field Service Management (FSM) Market?

The market is forecast to register a CAGR of 11.6% through 2033.

What Key Trends are Driving the Cloud Field Service Management (FSM) Market?

Bringing sustainability to the field service processes may drive market growth over the coming years.

What Opportunities Await for the Market Players?

New territorial improvements for wider service coverage may provide growth prospects for the market players.

Who are the Key Cloud Field Service Management (FSM) Market Players?

Salesforce.Com, Inc., SAP SE, and Oracle Corporation are the top key players.

Table of Content
1. Executive Summary

    1.1. Global Market Outlook

    1.2. Demand-side Trends

    1.3. Supply-side Trends

    1.4. Technology Roadmap Analysis

    1.5. Analysis and Recommendations

2. Market Overview

    2.1. Market Coverage / Taxonomy

    2.2. Market Definition / Scope / Limitations

3. Market Background

    3.1. Market Dynamics

        3.1.1. Drivers

        3.1.2. Restraints

        3.1.3. Opportunity

        3.1.4. Trends

    3.2. Scenario Forecast

        3.2.1. Demand in Optimistic Scenario

        3.2.2. Demand in Likely Scenario

        3.2.3. Demand in Conservative Scenario

    3.3. Opportunity Map Analysis

    3.4. Investment Feasibility Matrix

    3.5. PESTLE and Porter’s Analysis

    3.6. Regulatory Landscape

        3.6.1. By Key Regions

        3.6.2. By Key Countries

    3.7. Regional Parent Market Outlook

4. Global Market Analysis 2018 to 2022 and Forecast, 2023 to 2033

    4.1. Historical Market Size Value (US$ Million) Analysis, 2018 to 2022

    4.2. Current and Future Market Size Value (US$ Million) Projections, 2023 to 2033

        4.2.1. Y-o-Y Growth Trend Analysis

        4.2.2. Absolute $ Opportunity Analysis

5. Global Market Analysis 2018 to 2022 and Forecast 2023 to 2033, By Component

    5.1. Introduction / Key Findings

    5.2. Historical Market Size Value (US$ Million) Analysis By Component, 2018 to 2022

    5.3. Current and Future Market Size Value (US$ Million) Analysis and Forecast By Component, 2023 to 2033

        5.3.1. Mobile Cloud

        5.3.2. Inventory Cloud

        5.3.3. Work Order

        5.3.4. Service Project

        5.3.5. Others

    5.4. Y-o-Y Growth Trend Analysis By Component, 2018 to 2022

    5.5. Absolute $ Opportunity Analysis By Component, 2023 to 2033

6. Global Market Analysis 2018 to 2022 and Forecast 2023 to 2033, By Services

    6.1. Introduction / Key Findings

    6.2. Historical Market Size Value (US$ Million) Analysis By Services, 2018 to 2022

    6.3. Current and Future Market Size Value (US$ Million) Analysis and Forecast By Services, 2023 to 2033

        6.3.1. Consulting Services

        6.3.2. Integration and Migration

        6.3.3. Support and Maintenance

    6.4. Y-o-Y Growth Trend Analysis By Services, 2018 to 2022

    6.5. Absolute $ Opportunity Analysis By Services, 2023 to 2033

7. Global Market Analysis 2018 to 2022 and Forecast 2023 to 2033, By Enterprise Type

    7.1. Introduction / Key Findings

    7.2. Historical Market Size Value (US$ Million) Analysis by Enterprise Type, 2018 to 2022

    7.3. Current and Future Market Size Value (US$ Million) Analysis and Forecast by Enterprise Type, 2023 to 2033

        7.3.1. Small and Medium Business Enterprises

        7.3.2. Large Enterprises

    7.4. Y-o-Y Growth Trend Analysis by Enterprise Type, 2018 to 2022

    7.5. Absolute $ Opportunity Analysis by Enterprise Type, 2023 to 2033

8. Global Market Analysis 2018 to 2022 and Forecast 2023 to 2033, By Region

    8.1. Introduction

    8.2. Historical Market Size Value (US$ Million) Analysis By Region, 2018 to 2022

    8.3. Current Market Size Value (US$ Million) Analysis and Forecast By Region, 2023 to 2033

        8.3.1. North America

        8.3.2. Latin America

        8.3.3. Western Europe

        8.3.4. Eastern Europe

        8.3.5. South Asia and Pacific

        8.3.6. East Asia

        8.3.7. Middle East and Africa

    8.4. Market Attractiveness Analysis By Region

9. North America Market Analysis 2018 to 2022 and Forecast 2023 to 2033, By Country

    9.1. Historical Market Size Value (US$ Million) Trend Analysis By Market Taxonomy, 2018 to 2022

    9.2. Market Size Value (US$ Million) Forecast By Market Taxonomy, 2023 to 2033

        9.2.1. By Country

            9.2.1.1. The USA

            9.2.1.2. Canada

        9.2.2. By Component

        9.2.3. By Services

        9.2.4. By Enterprise Type

    9.3. Market Attractiveness Analysis

        9.3.1. By Country

        9.3.2. By Component

        9.3.3. By Services

        9.3.4. By Enterprise Type

    9.4. Key Takeaways

10. Latin America Market Analysis 2018 to 2022 and Forecast 2023 to 2033, By Country

    10.1. Historical Market Size Value (US$ Million) Trend Analysis By Market Taxonomy, 2018 to 2022

    10.2. Market Size Value (US$ Million) Forecast By Market Taxonomy, 2023 to 2033

        10.2.1. By Country

            10.2.1.1. Brazil

            10.2.1.2. Mexico

            10.2.1.3. Rest of Latin America

        10.2.2. By Component

        10.2.3. By Services

        10.2.4. By Enterprise Type

    10.3. Market Attractiveness Analysis

        10.3.1. By Country

        10.3.2. By Component

        10.3.3. By Services

        10.3.4. By Enterprise Type

    10.4. Key Takeaways

11. Western Europe Market Analysis 2018 to 2022 and Forecast 2023 to 2033, By Country

    11.1. Historical Market Size Value (US$ Million) Trend Analysis By Market Taxonomy, 2018 to 2022

    11.2. Market Size Value (US$ Million) Forecast By Market Taxonomy, 2023 to 2033

        11.2.1. By Country

            11.2.1.1. Germany

            11.2.1.2. United Kingdom

            11.2.1.3. France

            11.2.1.4. Spain

            11.2.1.5. Italy

            11.2.1.6. Rest of Western Europe

        11.2.2. By Component

        11.2.3. By Services

        11.2.4. By Enterprise Type

    11.3. Market Attractiveness Analysis

        11.3.1. By Country

        11.3.2. By Component

        11.3.3. By Services

        11.3.4. By Enterprise Type

    11.4. Key Takeaways

12. Eastern Europe Market Analysis 2018 to 2022 and Forecast 2023 to 2033, By Country

    12.1. Historical Market Size Value (US$ Million) Trend Analysis By Market Taxonomy, 2018 to 2022

    12.2. Market Size Value (US$ Million) Forecast By Market Taxonomy, 2023 to 2033

        12.2.1. By Country

            12.2.1.1. Poland

            12.2.1.2. Russia

            12.2.1.3. Czech Republic

            12.2.1.4. Romania

            12.2.1.5. Rest of Eastern Europe

        12.2.2. By Component

        12.2.3. By Services

        12.2.4. By Enterprise Type

    12.3. Market Attractiveness Analysis

        12.3.1. By Country

        12.3.2. By Component

        12.3.3. By Services

        12.3.4. By Enterprise Type

    12.4. Key Takeaways

13. South Asia and Pacific Market Analysis 2018 to 2022 and Forecast 2023 to 2033, By Country

    13.1. Historical Market Size Value (US$ Million) Trend Analysis By Market Taxonomy, 2018 to 2022

    13.2. Market Size Value (US$ Million) Forecast By Market Taxonomy, 2023 to 2033

        13.2.1. By Country

            13.2.1.1. India

            13.2.1.2. Bangladesh

            13.2.1.3. Australia

            13.2.1.4. New Zealand

            13.2.1.5. Rest of South Asia and Pacific

        13.2.2. By Component

        13.2.3. By Services

        13.2.4. By Enterprise Type

    13.3. Market Attractiveness Analysis

        13.3.1. By Country

        13.3.2. By Component

        13.3.3. By Services

        13.3.4. By Enterprise Type

    13.4. Key Takeaways

14. East Asia Market Analysis 2018 to 2022 and Forecast 2023 to 2033, By Country

    14.1. Historical Market Size Value (US$ Million) Trend Analysis By Market Taxonomy, 2018 to 2022

    14.2. Market Size Value (US$ Million) Forecast By Market Taxonomy, 2023 to 2033

        14.2.1. By Country

            14.2.1.1. China

            14.2.1.2. Japan

            14.2.1.3. South Korea

        14.2.2. By Component

        14.2.3. By Services

        14.2.4. By Enterprise Type

    14.3. Market Attractiveness Analysis

        14.3.1. By Country

        14.3.2. By Component

        14.3.3. By Services

        14.3.4. By Enterprise Type

    14.4. Key Takeaways

15. Middle East and Africa Market Analysis 2018 to 2022 and Forecast 2023 to 2033, By Country

    15.1. Historical Market Size Value (US$ Million) Trend Analysis By Market Taxonomy, 2018 to 2022

    15.2. Market Size Value (US$ Million) Forecast By Market Taxonomy, 2023 to 2033

        15.2.1. By Country

            15.2.1.1. GCC Countries

            15.2.1.2. South Africa

            15.2.1.3. Israel

            15.2.1.4. Rest of MEA

        15.2.2. By Component

        15.2.3. By Services

        15.2.4. By Enterprise Type

    15.3. Market Attractiveness Analysis

        15.3.1. By Country

        15.3.2. By Component

        15.3.3. By Services

        15.3.4. By Enterprise Type

    15.4. Key Takeaways

16. Key Countries Market Analysis

    16.1. USA

        16.1.1. Pricing Analysis

        16.1.2. Market Share Analysis, 2022

            16.1.2.1. By Component

            16.1.2.2. By Services

            16.1.2.3. By Enterprise Type

    16.2. Canada

        16.2.1. Pricing Analysis

        16.2.2. Market Share Analysis, 2022

            16.2.2.1. By Component

            16.2.2.2. By Services

            16.2.2.3. By Enterprise Type

    16.3. Brazil

        16.3.1. Pricing Analysis

        16.3.2. Market Share Analysis, 2022

            16.3.2.1. By Component

            16.3.2.2. By Services

            16.3.2.3. By Enterprise Type

    16.4. Mexico

        16.4.1. Pricing Analysis

        16.4.2. Market Share Analysis, 2022

            16.4.2.1. By Component

            16.4.2.2. By Services

            16.4.2.3. By Enterprise Type

    16.5. Germany

        16.5.1. Pricing Analysis

        16.5.2. Market Share Analysis, 2022

            16.5.2.1. By Component

            16.5.2.2. By Services

            16.5.2.3. By Enterprise Type

    16.6. United Kingdom

        16.6.1. Pricing Analysis

        16.6.2. Market Share Analysis, 2022

            16.6.2.1. By Component

            16.6.2.2. By Services

            16.6.2.3. By Enterprise Type

    16.7. France

        16.7.1. Pricing Analysis

        16.7.2. Market Share Analysis, 2022

            16.7.2.1. By Component

            16.7.2.2. By Services

            16.7.2.3. By Enterprise Type

    16.8. Spain

        16.8.1. Pricing Analysis

        16.8.2. Market Share Analysis, 2022

            16.8.2.1. By Component

            16.8.2.2. By Services

            16.8.2.3. By Enterprise Type

    16.9. Italy

        16.9.1. Pricing Analysis

        16.9.2. Market Share Analysis, 2022

            16.9.2.1. By Component

            16.9.2.2. By Services

            16.9.2.3. By Enterprise Type

    16.10. Poland

        16.10.1. Pricing Analysis

        16.10.2. Market Share Analysis, 2022

            16.10.2.1. By Component

            16.10.2.2. By Services

            16.10.2.3. By Enterprise Type

    16.11. Russia

        16.11.1. Pricing Analysis

        16.11.2. Market Share Analysis, 2022

            16.11.2.1. By Component

            16.11.2.2. By Services

            16.11.2.3. By Enterprise Type

    16.12. Czech Republic

        16.12.1. Pricing Analysis

        16.12.2. Market Share Analysis, 2022

            16.12.2.1. By Component

            16.12.2.2. By Services

            16.12.2.3. By Enterprise Type

    16.13. Romania

        16.13.1. Pricing Analysis

        16.13.2. Market Share Analysis, 2022

            16.13.2.1. By Component

            16.13.2.2. By Services

            16.13.2.3. By Enterprise Type

    16.14. India

        16.14.1. Pricing Analysis

        16.14.2. Market Share Analysis, 2022

            16.14.2.1. By Component

            16.14.2.2. By Services

            16.14.2.3. By Enterprise Type

    16.15. Bangladesh

        16.15.1. Pricing Analysis

        16.15.2. Market Share Analysis, 2022

            16.15.2.1. By Component

            16.15.2.2. By Services

            16.15.2.3. By Enterprise Type

    16.16. Australia

        16.16.1. Pricing Analysis

        16.16.2. Market Share Analysis, 2022

            16.16.2.1. By Component

            16.16.2.2. By Services

            16.16.2.3. By Enterprise Type

    16.17. New Zealand

        16.17.1. Pricing Analysis

        16.17.2. Market Share Analysis, 2022

            16.17.2.1. By Component

            16.17.2.2. By Services

            16.17.2.3. By Enterprise Type

    16.18. China

        16.18.1. Pricing Analysis

        16.18.2. Market Share Analysis, 2022

            16.18.2.1. By Component

            16.18.2.2. By Services

            16.18.2.3. By Enterprise Type

    16.19. Japan

        16.19.1. Pricing Analysis

        16.19.2. Market Share Analysis, 2022

            16.19.2.1. By Component

            16.19.2.2. By Services

            16.19.2.3. By Enterprise Type

    16.20. South Korea

        16.20.1. Pricing Analysis

        16.20.2. Market Share Analysis, 2022

            16.20.2.1. By Component

            16.20.2.2. By Services

            16.20.2.3. By Enterprise Type

    16.21. GCC Countries

        16.21.1. Pricing Analysis

        16.21.2. Market Share Analysis, 2022

            16.21.2.1. By Component

            16.21.2.2. By Services

            16.21.2.3. By Enterprise Type

    16.22. South Africa

        16.22.1. Pricing Analysis

        16.22.2. Market Share Analysis, 2022

            16.22.2.1. By Component

            16.22.2.2. By Services

            16.22.2.3. By Enterprise Type

    16.23. Israel

        16.23.1. Pricing Analysis

        16.23.2. Market Share Analysis, 2022

            16.23.2.1. By Component

            16.23.2.2. By Services

            16.23.2.3. By Enterprise Type

17. Market Structure Analysis

    17.1. Competition Dashboard

    17.2. Competition Benchmarking

    17.3. Market Share Analysis of Top Players

        17.3.1. By Regional

        17.3.2. By Component

        17.3.3. By Services

        17.3.4. By Enterprise Type

18. Competition Analysis

    18.1. Competition Deep Dive

        18.1.1. Oracle

            18.1.1.1. Overview

            18.1.1.2. Product Portfolio

            18.1.1.3. Profitability by Market Segments

            18.1.1.4. Sales Footprint

            18.1.1.5. Strategy Overview

                18.1.1.5.1. Marketing Strategy

        18.1.2. SAP SE

            18.1.2.1. Overview

            18.1.2.2. Product Portfolio

            18.1.2.3. Profitability by Market Segments

            18.1.2.4. Sales Footprint

            18.1.2.5. Strategy Overview

                18.1.2.5.1. Marketing Strategy

        18.1.3. Salesforce Inc.

            18.1.3.1. Overview

            18.1.3.2. Product Portfolio

            18.1.3.3. Profitability by Market Segments

            18.1.3.4. Sales Footprint

            18.1.3.5. Strategy Overview

                18.1.3.5.1. Marketing Strategy

        18.1.4. IBM

            18.1.4.1. Overview

            18.1.4.2. Product Portfolio

            18.1.4.3. Profitability by Market Segments

            18.1.4.4. Sales Footprint

            18.1.4.5. Strategy Overview

                18.1.4.5.1. Marketing Strategy

        18.1.5. Microsoft Corporation

            18.1.5.1. Overview

            18.1.5.2. Product Portfolio

            18.1.5.3. Profitability by Market Segments

            18.1.5.4. Sales Footprint

            18.1.5.5. Strategy Overview

                18.1.5.5.1. Marketing Strategy

        18.1.6. ServiceNow, Inc.

            18.1.6.1. Overview

            18.1.6.2. Product Portfolio

            18.1.6.3. Profitability by Market Segments

            18.1.6.4. Sales Footprint

            18.1.6.5. Strategy Overview

                18.1.6.5.1. Marketing Strategy

        18.1.7. ServicePower Technologies plc

            18.1.7.1. Overview

            18.1.7.2. Product Portfolio

            18.1.7.3. Profitability by Market Segments

            18.1.7.4. Sales Footprint

            18.1.7.5. Strategy Overview

                18.1.7.5.1. Marketing Strategy

        18.1.8. ClickSoftware Technologies Ltd.

            18.1.8.1. Overview

            18.1.8.2. Product Portfolio

            18.1.8.3. Profitability by Market Segments

            18.1.8.4. Sales Footprint

            18.1.8.5. Strategy Overview

                18.1.8.5.1. Marketing Strategy

        18.1.9. ServiceMax, Inc.

            18.1.9.1. Overview

            18.1.9.2. Product Portfolio

            18.1.9.3. Profitability by Market Segments

            18.1.9.4. Sales Footprint

            18.1.9.5. Strategy Overview

                18.1.9.5.1. Marketing Strategy

        18.1.10. Acumatica, Inc.

            18.1.10.1. Overview

            18.1.10.2. Product Portfolio

            18.1.10.3. Profitability by Market Segments

            18.1.10.4. Sales Footprint

            18.1.10.5. Strategy Overview

                18.1.10.5.1. Marketing Strategy

        18.1.11. Astea International Inc.

            18.1.11.1. Overview

            18.1.11.2. Product Portfolio

            18.1.11.3. Profitability by Market Segments

            18.1.11.4. Sales Footprint

            18.1.11.5. Strategy Overview

                18.1.11.5.1. Marketing Strategy

        18.1.12. FieldAware

            18.1.12.1. Overview

            18.1.12.2. Product Portfolio

            18.1.12.3. Profitability by Market Segments

            18.1.12.4. Sales Footprint

            18.1.12.5. Strategy Overview

                18.1.12.5.1. Marketing Strategy

        18.1.13. Atlassian

            18.1.13.1. Overview

            18.1.13.2. Product Portfolio

            18.1.13.3. Profitability by Market Segments

            18.1.13.4. Sales Footprint

            18.1.13.5. Strategy Overview

                18.1.13.5.1. Marketing Strategy

        18.1.14. Broadcom

            18.1.14.1. Overview

            18.1.14.2. Product Portfolio

            18.1.14.3. Profitability by Market Segments

            18.1.14.4. Sales Footprint

            18.1.14.5. Strategy Overview

                18.1.14.5.1. Marketing Strategy

        18.1.15. SolarWinds

            18.1.15.1. Overview

            18.1.15.2. Product Portfolio

            18.1.15.3. Profitability by Market Segments

            18.1.15.4. Sales Footprint

            18.1.15.5. Strategy Overview

                18.1.15.5.1. Marketing Strategy

        18.1.16. Cherwell

            18.1.16.1. Overview

            18.1.16.2. Product Portfolio

            18.1.16.3. Profitability by Market Segments

            18.1.16.4. Sales Footprint

            18.1.16.5. Strategy Overview

                18.1.16.5.1. Marketing Strategy

        18.1.17. Dispatch

            18.1.17.1. Overview

            18.1.17.2. Product Portfolio

            18.1.17.3. Profitability by Market Segments

            18.1.17.4. Sales Footprint

            18.1.17.5. Strategy Overview

                18.1.17.5.1. Marketing Strategy

        18.1.18. LiquidFrameworks

            18.1.18.1. Overview

            18.1.18.2. Product Portfolio

            18.1.18.3. Profitability by Market Segments

            18.1.18.4. Sales Footprint

            18.1.18.5. Strategy Overview

                18.1.18.5.1. Marketing Strategy

        18.1.19. Csdp

            18.1.19.1. Overview

            18.1.19.2. Product Portfolio

            18.1.19.3. Profitability by Market Segments

            18.1.19.4. Sales Footprint

            18.1.19.5. Strategy Overview

                18.1.19.5.1. Marketing Strategy

        18.1.20. Innovapptive

            18.1.20.1. Overview

            18.1.20.2. Product Portfolio

            18.1.20.3. Profitability by Market Segments

            18.1.20.4. Sales Footprint

            18.1.20.5. Strategy Overview

                18.1.20.5.1. Marketing Strategy

19. Assumptions & Acronyms Used

20. Research Methodology
Recommendations

Technology

Public Cloud Application Infrastructure Services Market

September 2017

REP-GB-4881

October 2023

170 pages

Technology

Service Integration and Management Market

October 2017

REP-GB-4490

342 pages

Explore Technology Insights

View Reports
Future Market Insights

Cloud Field Service Management (FSM) Market