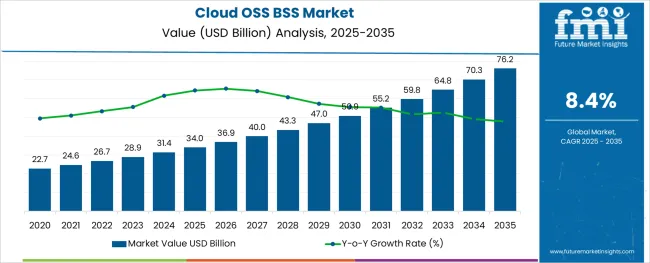
The Cloud OSS BSS Market is estimated to be valued at USD 34.0 billion in 2025 and is projected to reach USD 76.2 billion by 2035, registering a compound annual growth rate (CAGR) of 8.4% over the forecast period.

The stainless steel valve tag market is expanding steadily as industrial sectors prioritize asset management, safety compliance, and equipment traceability. Increasing investments in infrastructure and process automation have heightened demand for robust and clear identification solutions capable of withstanding harsh environments.
The shift toward digital transformation in industries such as oil and gas, manufacturing, and utilities is encouraging the adoption of advanced tagging systems that support maintenance and audit operations. Growing awareness around regulatory compliance for equipment labeling and enhanced safety protocols is also influencing market expansion.
The rise of e-commerce platforms has facilitated easier procurement of valve tags, increasing accessibility for small to medium enterprises and broadening geographic reach. Material innovations and customization options continue to enhance product longevity and visibility, creating opportunities for market penetration across diverse industrial applications.
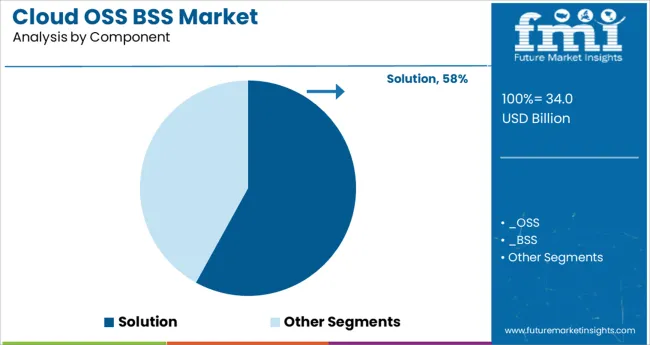
The market is segmented by Component, Cloud Type, Operator Type, and Organization Size and region. By Component, the market is divided into Solution and Services. In terms of Cloud Type, the market is classified into Public Cloud, Private Cloud, and Hybrid Cloud. Based on Operator Type, the market is segmented into Mobile Operator and Fixed Operator. By Organization Size, the market is divided into Large Enterprises and SMEs. Regionally, the market is classified into North America, Latin America, Western Europe, Eastern Europe, Balkan & Baltic Countries, Russia & Belarus, Central Asia, East Asia, South Asia & Pacific, and the Middle East & Africa.
The market is segmented by Component, Cloud Type, Operator Type, and Organization Size and region. By Component, the market is divided into Solution and Services. In terms of Cloud Type, the market is classified into Public Cloud, Private Cloud, and Hybrid Cloud. Based on Operator Type, the market is segmented into Mobile Operator and Fixed Operator. By Organization Size, the market is divided into Large Enterprises and SMEs. Regionally, the market is classified into North America, Latin America, Western Europe, Eastern Europe, Balkan & Baltic Countries, Russia & Belarus, Central Asia, East Asia, South Asia & Pacific, and the Middle East & Africa.
The less than 30 mm thickness segment is expected to hold 41.3% of the revenue share in 2025 within the thickness category. This segment’s leadership is supported by its suitability for a wide range of valve sizes and equipment types, providing sufficient durability while minimizing material costs.
The thinner tags offer flexibility in installation, especially in tight spaces and complex piping systems, making them preferable for industries where compactness is critical. Their compatibility with standard mounting hardware and ability to endure corrosion and wear have reinforced demand in sectors emphasizing both performance and cost efficiency.
This balance between robustness and adaptability has contributed to the segment’s dominant position.

Within the product type category, engraved valve tags are projected to command 57.8% of the market revenue share in 2025, marking them as the leading product form. The prominence of engraved tags is due to their superior legibility, permanence, and resistance to environmental degradation such as fading, scratching, and chemical exposure.
Engraving allows precise and customizable marking, meeting stringent industry standards for traceability and safety. The technique supports complex information including serial numbers, barcodes, and QR codes, enhancing integration with digital asset management systems.
Manufacturers’ emphasis on delivering long-lasting, tamper-proof tags that reduce maintenance costs has reinforced the adoption of engraved tags in heavy industries.
The online distribution channel is expected to generate 63.7% of market revenue in 2025, making it the most dominant sales route. The growth of e-commerce platforms has revolutionized procurement by offering convenience, broader product selections, and competitive pricing to end-users across industries.
Online channels enable buyers to access detailed product specifications, customization options, and customer reviews, simplifying purchase decisions. This has particularly benefited small and medium-sized enterprises lacking traditional supply chain networks.
Additionally, digital platforms have streamlined order fulfillment and reduced lead times, fostering faster adoption. Vendors are increasingly investing in online marketplaces and direct-to-customer websites to expand reach and improve customer engagement, reinforcing the online channel’s leadership in the stainless steel valve tag market.
As per the Global Cloud OSS BSS Market research by Future Market Insights - a market research and competitive intelligence provider31.4 historically31.4 from 2020 to 202431.4 the market value of the Cloud OSS BSS Market increased at around 11.2% CAGR. With an absolute dollar opportunity of USD 76.2 Billion31.4 the market is projected to reach a valuation of USD 60 Billion by 2035.
Since on-premise systems have high entry and exit barriers31.4 modern communication service providers prefer the cloud for its many benefits31.4 including quick time to market31.4 delivery agility31.4 and network administration. Adopting cloud-based operations support system solutions is also becoming notably easier for new operators and mobile virtual network operators.
There are also a few obstacles for new operators to overcome. For example31.4 BNET31.4 a new independent service provider in Bahrain31.4 stated in March 2024 that it will use Beyond's Infonova BSS solution as a software service built on AWS. This solution will fortify BNET's planned national fiber broadband network's business support systems31.4 OSS and BSS.
As more suppliers concentrate their investments on accelerating digital transformation, demand for Cloud OSS BSS is increasing. For instance, in May 2024, EY and IBM announced the establishment of a Center of Excellence to aid financial institutions in accelerating their digital transformation through the use of hybrid cloud technologies. To assist clients in using the cloud at scale, the Center of Excellence is an integrated virtual center that provides services in digital trust, security, and regulatory compliance.
Communication service providers have been offering a range of services including multimedia, internet, mobile, commerce, data, video, and phone as a result of the increased emphasis on development in the telecommunications industry. Customers receive a comprehensive view of all of their postpaid and prepaid services via convergent billing, also known as a convergent charge. It is impossible to overestimate the significance of OSS BSS in the development of a convergent billing system. For operators, convergent pricing is becoming more and more crucial. In addition, convergent billion systems have a number of benefits, including improved client service, simplicity of use, and centralized customer support.
The telecommunications business provides a wide range of support services, such as networking, client profile management, and various billing management systems, all of which are tied to operating costs. CSPs may supply the entire IT infrastructure at a lesser cost owing to cloud computing, allowing them to improve overall operations. Using multiple resource tracking technologies, CSPs frequently struggle to keep track of OPEX. The rapid development of new technologies posed a challenge to telecom service providers in terms of reducing operational expenses. Many businesses have begun to use cloud-based OSS BSS platforms to manage complicated procedures more swiftly while substantially cutting operating costs. Cloud technologies enable CSPs to cut overall operational expenses while also providing simplified solutions.
The necessity to protect data privacy becomes more difficult when there are more telecom subscribers. Concerns about data and payment security in the telecom business are growing in tandem with the volume of data generated and online transactions completed. Customer financial information is required in order to access value-added services. Customers are worried about the security and privacy of their personal information, including their financial information. Complete data integrity must be maintained in order to protect transactions and personal information, which are important and confidential.
This necessitates a productive and manageable cloud infrastructure in order to maximize productivity and ensure a secure environment for CSPs and their clients. To safeguard the data of each customer, CSPs, and network managers adopt appropriate measures. Solutions for cloud-based OSS and BSS help CSPs improve their understanding of the consumer and acquire a single view of the customer across channels. However, when unethical elements overflow, privacy might occasionally be jeopardized. Due to these concerns, consumers are reluctant to provide personal information, which limits the growth of the cloud OSS BSS industry.
During the projection period, Cloud OSS BSS Market in North America is projected to dominate. According to a GSMA poll, almost 22.7 Million individuals in North America had internet access in 2020. The market for digital business support systems is expected to expand in the region, nevertheless, as a result of the growing need for increased operational effectiveness and the intense competition among CSPs. Businesses in these locations see value-added services as a fresh way to boost top-line earnings.
The Business Strategy Support industry's IoT-based platforms, services, and consulting services have enabled the industry to oversee, administer, and report on training, education consulting, and internet services provided to customers. Several technological, economic, and behavioral changes are underway that are primarily encouraging the development and adoption of IoT and cloud technology.
According to USENIX, an organization that provides technical support to operating systems, more than half of homes worldwide have an Internet connection, while over 70% of North American homes are networked. IoT devices have provided the example of numerous new suppliers and pricing structures. These improvements in organizational methods have made something else entirely take place.

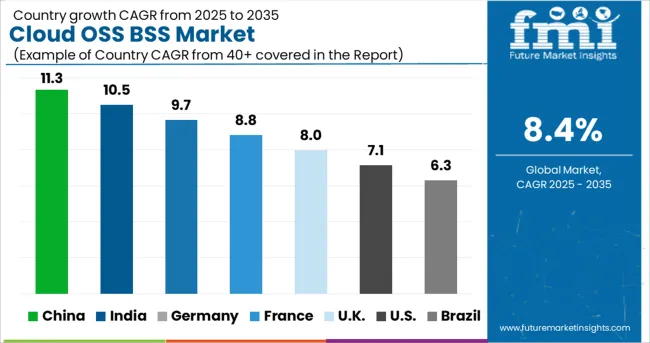
The USA is expected to account for the highest market of USD 76.2 Billion by the end of 2035. Also, the market in the country is projected to account for an absolute dollar growth of USD 34 Billion. The US Census Bureau and the Consumer Technology Association predicted in January 2025 that US smartphone sales will rise from USD 31.4 Billion in 2024 to USD 74.7 Billion in 2025. This is expected to increase significantly as IoT quickly penetrates a range of sectors and businesses.
This is anticipated to speed up the adoption and integration of managed services and promote market expansion. According to a poll published by Cloudward in 2025, Google Drive was the most popular cloud storage service, with a staggering 94.4% usage worldwide. The growing adoption of smart technology and rising security spending are two key factors affecting demand for the cloud OSS BSS market in the USA.
Market revenue through cloud OSS BSS Solutions is forecasted to grow at a CAGR of over 8.3% from 2025 to 2035. While maintaining customer service, the solution supports telecom network back-office operations. To maintain their communications networks, operators often use information processing systems. These products and services assist businesses in planning how to interact with consumers, resources, services, and processes. It aids operators in the development, construction, and upkeep of communication networks. Modern OSS and BSS may help organizations foresee market trends, improve customer satisfaction, increase operational performance, and obtain operational and market insights from big data.

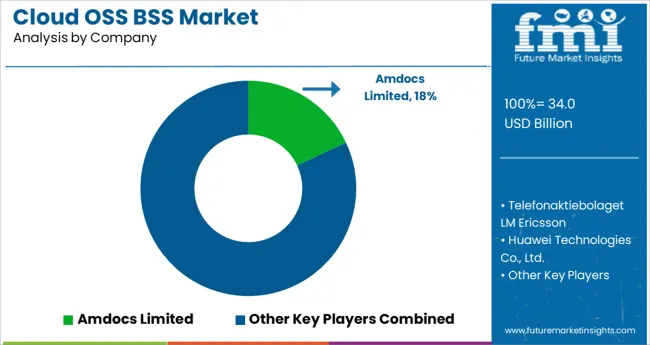
Players in the market are constantly developing improved analytical solutions as well as extending their product offerings. The companies in the Cloud OSS BSS market are focused on alliances, technology collaborations, and product launch strategies.
Some of the recent developments of key Cloud OSS BSS providers are as follows:
Similarly, recent developments related to companies in Cloud OSS BSS Market have been tracked by the team at Future Market Insights, which are available in the full report.
The global cloud oss bss market is estimated to be valued at USD 34.0 billion in 2025.
It is projected to reach USD 76.2 billion by 2035.
The market is expected to grow at a 8.4% CAGR between 2025 and 2035.
The key product types are solution, _oss, _bss, services, _professional services and _managed services.
public cloud segment is expected to dominate with a 46.0% industry share in 2025.


Full Research Suite comprises of:
Market outlook & trends analysis
Interviews & case studies
Strategic recommendations
Vendor profiles & capabilities analysis
5-year forecasts
8 regions and 60+ country-level data splits
Market segment data splits
12 months of continuous data updates
DELIVERED AS:
PDF EXCEL ONLINE
Cloud Service Market Size and Share Forecast Outlook 2025 to 2035
Cloud Analytics Market Size and Share Forecast Outlook 2025 to 2035
Cloud ERP Industry Analysis in Latin America Forecast Outlook 2025 to 2035
Cloud Backup Service Industry Analysis in Latin America Size and Share Forecast Outlook 2025 to 2035
Cloud Compliance Market Size and Share Forecast Outlook 2025 to 2035
Cloud-Based ITSM Market Size and Share Forecast Outlook 2025 to 2035
Cloud IT Infrastructure Hardware Market Size and Share Forecast Outlook 2025 to 2035
Cloud POS Market Size and Share Forecast Outlook 2025 to 2035
Cloud Systems Management Software Market Size and Share Forecast Outlook 2025 to 2035
Cloud Telephony Services Market Size and Share Forecast Outlook 2025 to 2035
Cloud Field Service Management (FSM) Market Size and Share Forecast Outlook 2025 to 2035
Cloud Seeding System Market Size and Share Forecast Outlook 2025 to 2035
Cloud Professional Services Market Size and Share Forecast Outlook 2025 to 2035
Cloud Based Collaboration Software Market Size and Share Forecast Outlook 2025 to 2035
Cloud Printing Services Market Size and Share Forecast Outlook 2025 to 2035
Cloud Migration Service Market Size and Share Forecast Outlook 2025 to 2035
Cloudifier Market Size and Share Forecast Outlook 2025 to 2035
Cloud Database and DBaaS Market Size and Share Forecast Outlook 2025 to 2035
Cloud ERP Market Size and Share Forecast Outlook 2025 to 2035
Cloud Computing Market Size and Share Forecast Outlook 2025 to 2035

Thank you!
You will receive an email from our Business Development Manager. Please be sure to check your SPAM/JUNK folder too.
Chat With
MaRIA