Reports

- Global Locations -

Headquarters

Future Market Insights, Inc.

Christiana Corporate, 200
Continental Drive, Suite 401,
Newark, Delaware - 19713,
United States

T: +1-845-579-5705

Americas

Future Market Insights, Inc.

616 Corporate Way, Suite 2-9018,
Valley Cottage, NY 10989, United States

T: +1-347-918-3531

MEA

Future Market Insights

1602-6 Jumeirah Bay X2 Tower, Plot No: JLT-PH2-X2A,
Jumeirah Lakes Towers, Dubai,
United Arab Emirates

Europe

Future Market Insights

3rd Floor, 207 Regent Street,
W1B 3HH London
United Kingdom

T: + 44 (0) 20 8123 9659
D: +44 (0) 20 3287 4268

Asia Pacific

Future Market Insights

IndiaLand Global Tech Park, Unit UG-1, Behind Grand HighStreet, Phase 1, Hinjawadi, MH, Pune – 411057, India

Cloud Firewalls Market Outlook (2022 to 2032)

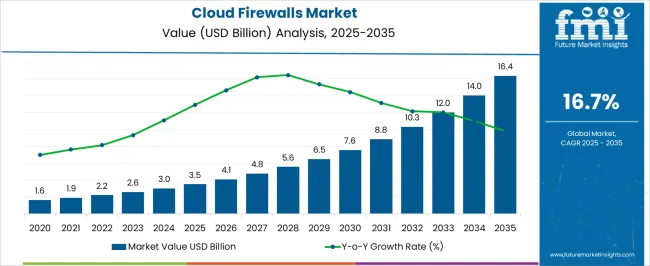
The cloud firewalls market is projected to grow at a CAGR of 16.7% during the forecast period. By 2032, the market is expected to reach a valuation of US$ 10.4 billion, and as of 2022, the market holds a valuation of US$ 2.2 billion.

Some of the key factors which might surge the market to new heights going ahead are:

  • An ability to protect cloud infrastructure, provide DNS security, and advanced threat protection.
  • Are effective in simplifying the IT infrastructure.

Having the ability to distinguish between different programs. This ultimately allows sending one application while blocking access to other applications.

Attributes Key Statistics
Cloud Firewalls Market Estimated Size (2022) US$ 2.2 Billion
Projected Market Valuation (2032) US$ 10.4 Billion
Value-based CAGR (2022 to 2032) 16.7%
Top 5 Vendor Market Share Around 33%

Don't pay for what you don't need

Customize your report by selecting specific countries or regions and save 30%!

Increased demand for the Security of Critical Data makes USA the Largest Market in North America Region

The USA is currently the largest market in the North American region, and during the forecast period, it is expected that the USA would have a share of nearly 71% in North America.

There has also been an increase in the capacity of confidential data in the country. This would mean the seamless storage of this ever-increasing data. The specialty of employing cloud firewalls is that this scale up rapidly to handle more traffic. Apart from that, the ability to seamlessly integrate with the cloud infrastructure is something that has made the process of storing this data highly efficient.

Cloud Firewalls Market

United Kingdom market is expected to reach a valuation of US$ 396.3 million by 2032

There have been increasing cases of cyber-attacks that have been reported from the United Kingdom Because of the increased demand for robust IT infrastructure, organizations have started making use of cloud firewalls.

Apart from that, there is also an increasing demand for maintaining data integrity throughout the region. This might as well increase the cloud firewalls market in the United Kingdom.

Sudip Saha
Sudip Saha

Principal Consultant

Talk to Analyst

Find your sweet spots for generating winning opportunities in this market.

Robust Telecom Market is expected to make India a hot Cloud Firewalls Market

The sales of cloud firewalls are expected to grow at a CAGR of nearly 24.4% in India during the period 2022 to 2032. India has always been a huge telecom market. The telecom sector is meant to make use of a huge amount of data, and with the penetration of the internet in the region, the demand for data storage is greater than ever before.

India has also been engaged in cyber wars at times with its neighbors. This makes data security extremely useful, as a result of which India is currently one of the largest markets for cloud firewalls.

Asia Pacific expected to become the Largest Cloud Firewalls Market during the Forecast Period

Asia Pacific is all set to be the most significant market for cloud firewalls during the forecast period. Increasing technological advancements, coupled with the initiatives taken by the government and other ruling authorities to maintain data security, make the Asia Pacific the largest market.

Apart from that, a huge population in the region would mean potential choke points. However, there are hardly any chances for the development of choke points by making use of cloud firewalls. The reason is that the traffic need not be funneled through a hardware appliance.

Get the data you need at a Fraction of the cost

Personalize your report by choosing insights you need
and save 40%!

Key Players in the Cloud Firewalls Market looking beyond Cybersecurity Trends

The key players are taking steps to layer more systems into their IT networks. Right now, the aim is to develop an internet secure, fast, private, and reliable internet. This is expected to be achieved by deflecting large DDoS attacks through the distributed global network.

The key players are also developing gateway support for the Microsoft platform, which also includes troubleshooting and scalability enhancements. For example, in September 2022, Sophos launched ZTNA v1.1. This version comes with Hyper-V support and SaaS application access with synchronized security.

The cloud firewalls market currently accounts for around 9.4% of the total network security market. The rising need for preventing cyber-attacks or mitigating unwanted access to private networks is pushing the sales of cloud firewall solutions.

In the recent era, cloud firewalls, also called next-generation firewalls, have gained a lot of traction as they provide advanced threat prevention, intrusion prevention systems, DNS security, and protect cloud infrastructure. They have now become essential components of a cloud-delivered security service.

Firewall-as-a-service assists organizations and businesses in eliminating firewall appliances and simplifying their IT infrastructure. In contrast to using hardware, cloud firewalls bring extensive firewall capabilities to the cloud and centralize security inspection to a single, easily accessible panel.

Cloud firewalls are cloud-deployed network devices that are designed to prevent or mitigate unauthorized access to private networks. They are a new technology that is designed for modern business needs and can be found in online application environments. The working of a cloud firewall is similar to that of a traditional firewall, the only difference is the cloud firewall is being hosted in a cloud environment.

Unlike hardware firewalls, cloud firewalls can easily distinguish between different programs on a computer system. This feature allows them to send data to one application or program while blocking access to other applications or programs. Cloud firewall solution offers cloud firewall services without the need for physical or virtual appliances to be deployed, maintained, and upgraded at each site.

The growing popularity of these solutions for improving cybersecurity across industries will therefore continue to boost the market growth.

Similarly, IoT-cloud convergence or integration of the IoT and cloud computing is likely to provide a strong thrust to the growth of the cloud firewalls market over the next decade.

One response to the needs that have arisen as a result of the global epidemic is the Internet of Things (IoT). The IoT seems to be a great fit in a world of remote settings and social estrangement because it minimizes human involvement while fulfilling a variety of activities. However, it is because of cloud computing that businesses can install the IoT on a big scale without any problems.

The combination of IoT and cloud computing, which is most visibly demonstrated by the abundance of cloud services that underpin IoT and are generally referred to as the IoT cloud, opens up new possibilities for how businesses are conducted.

Although it is true that the cloud has solutions that can close some of the IoT's security vulnerabilities, combining the two does not immediately eliminate the risks that both technologies confront. By forcing all incoming and outgoing traffic to travel via the cloud's API gateway, the integration of the IoT and the cloud considerably decreases the attack surface.

To protect the flow of data through this gateway, high-end cloud firewall appliances and services are required. Thus, this will boost the adoption of cloud firewalls and eventually expand the global market size during the forecast period.

2017 to 2021 Cloud Firewalls Demand Outlook Compared To 2022 to 2032 Forecast

The cloud firewalls demand is estimated to grow at a CAGR of 16.7% between 2022 and 2032 in comparison with the historical period CAGR of around 15.0%. One of the main reasons for this market growth is that cloud-delivered firewalls have attracted the attention of different industries by providing effective security for the cloud-first and work-from-anywhere services

Traditional firewalls require extra hardware capabilities, such as memory and disc space, which can raise costs. Also, technical expertise is required for the configuration and setup of traditional firewalls and cannot effectively manage internet traffic.

To overcome this challenge, the adoption of cloud firewalls is increasing as it is based on a URL filtering system that aids in the protection of the data set against false and malicious practices. It is a technological system that protects businesses from cyber-attacks and provides 24-hour security for cloud components.

Regionally, South Asia and the Pacific are estimated to be the fastest-growing market for next-generation firewalls and are expected to grow by 7.0X during the forecast period. The demand for cloud firewalls is being driven by the acceleration of economic growth, rising information, and communication technology spending, the surge in cyber threats, and the adoption of advanced security solutions in South Asia and Pacific countries.

What Are The Key Trends Driving The Global Cloud Firewalls Market?

Rising Demand for Advanced Security Solutions to Mitigate the Emerging Cyber Threats

The information and communication technology industry has a lot of room to grow as the global economy improves. Cyber security is more important than ever in today's world. As the volume of organizational data grows, so does the number of cyber-criminal activities. This could compromise an organization's goodwill and distort the records. With ever-increasing threats to businesses, having a solid security solution is critical.

Advanced threat prevention necessitates a multilayered, integrated approach to security due to the growing number of threats, including malware and ransomware. Tools for advanced malware protection, extra endpoint security threat prevention, intrusion threat detection, and intrusion prevention system may be included in this.

A firewall is used in a cloud environment to prevent unauthorized network access. A cloud firewall is a protective barrier that can keep unauthorized users out of your network. Additionally, for smooth application processing, market vendors are offering enhanced versions of cloud firewalls.

Developed countries around the world are embracing next-generation firewalls as a must-have service to protect their cloud environment and supplement overall business functions.
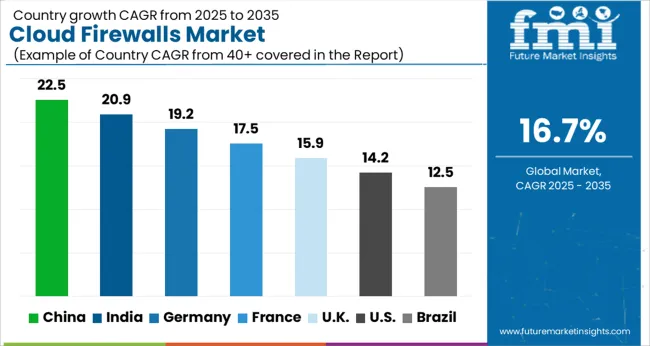
Country-Wise Insights

What Makes the United Kingdom a Lucrative Cloud Firewalls Market?

Increasing Adoption of Cloud Firewalls by Organizations Driving Growth

As per FMI, the United Kingdom cloud firewalls market is predicted to create an absolute $ opportunity of US$ 396.3 Million by the end of 2032. With the rise in cyber-attacks, there has been a sharp increase in adoption rates of advanced security solutions by organizations in the United Kingdom to strengthen their IT infrastructure.

The majority of the enterprises in the country are aggressively implementing security solutions to ensure the safety and integrity of critical information pertaining to citizens. Additionally, organizations are frequently updating security tools like network security, and other security procedures to enhance data integrity via the cloud.
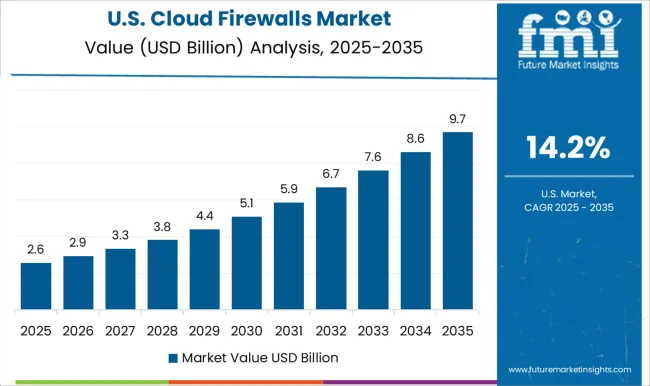
Why is Demand for Cloud Firewalls Rising in the USA?

Implementation of Government Regulations to Curb Cyber Attacks Boosting Sales

The demand for cloud firewalls in the USA is expected to account for nearly 71.1% of the North American market by 2032. Due to enterprises' strong preference for the security of the significant amount of sensitive and critical data they utilize, as well as their ongoing adoption of high-performing network security solutions, the USA currently dominates the global market.

Recently, some of the firms in the USA suffered from ransomware attacks, exposing the data of millions of customers. As a result, the government imposed stringent consumer privacy regulations. Due to this, large businesses in this region have adopted next-generation firewall solutions and become more aware of them, which has contributed to the market's expansion.

Similarly, the strong presence of leading cloud firewall providers such as Plato Alto Network, Fortinet, and Cisco along with the easy availability of next-generation cloud firewalls is playing a key role in boosting the market growth in the USA

These leading players are constantly launching new firewalls to help end users improve their cloud security and secure their sensitive data. For instance, in 2022, Plato Alto Network launched a managed next-generation firewall service for AWS.

How big is the Opportunity for the Adoption of Cloud Firewalls in India?

Rapid Shift Towards Cloud Services by Organizations Generating Demand for Cloud Firewalls

The sales revenue in India is estimated to grow at an impressive rate of around 24.4% CAGR between 2022 and 2032, which is the highest CAGR as compared to the other countries in South Asia & Pacific. The growing shift towards cloud services, the surge in cyber-attacks, and the increasing adoption of advanced cybersecurity solutions are some of the factors driving growth in India’s market.

India has always been a lucrative market for telecom service providers and has seen rapid adoption of cutting-edge technologies. With constantly changing network operators, the Indian telecom market has expanded significantly. Various companies are adopting cloud firewalls to get complete network security.

Network dependency is increasing in India, which has caused a boom in the usage of network security solutions. The demand for secure cloud data protection among small, medium, and big businesses and government organizations is anticipated to expand the market for cloud firewalls in India.

Category-Wise Insights

Why is the Demand for Cloud Firewall Services Rising?

Adoption of Cloud Firewall Services in Small and Mid-Sized Organizations to Surge

The cloud firewall services segment is expected to showcase higher CAGR in the coming years, creating an absolute $ opportunity of US$ 3,705.2 Million by the end of 2032. Small and mid-sized organizations are increasingly adopting cloud firewall services as these significantly lower costs by simplifying security administration and removing complications.

The pay-as-you-go (PAYG) model's increased flexibility has made small and mid-sized organizations most likely use cloud firewall services. Cloud firewall services help to provide a solid foundation for automated, round-the-clock management security in the cloud that guards against threats and cyberattacks.

How do Small and Mid-Sized Enterprises Contribute Towards the Growth of the Cloud Firewalls Market?

Limited Budget and Growing Cyber Threat Concerns Prompting Small and Mid-Sized Enterprises to Employ Cloud Firewalls

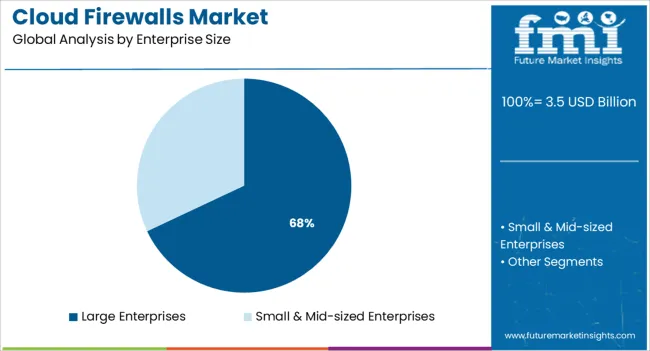
The sales revenue in small and mid-sized enterprises is estimated to grow at an impressive rate of around 17.7% CAGR between 2022 and 2032, owing to the rapid adoption of cloud firewalls across these enterprises.

SMEs are using cloud solutions to satisfy their expanding company requirements because they have a restricted budget to manage different business functions and activities.

As cyber threats are more frequent, particularly in SMEs, next-generation firewalls enhance the security levels of the company’s data by securing it from the reach of hackers. Because they lack authentication, many cloud-based applications are occasionally vulnerable to risk. As a result, small and medium-sized businesses are compelled to adopt network security tools like cloud firewalls to protect their cloud-based identities.

What Role Does the BFSI Sector Play in Supporting Growth of Cloud Firewalls?

Most of the Cloud Firewalls Demand to Emerge from BFSI Sector

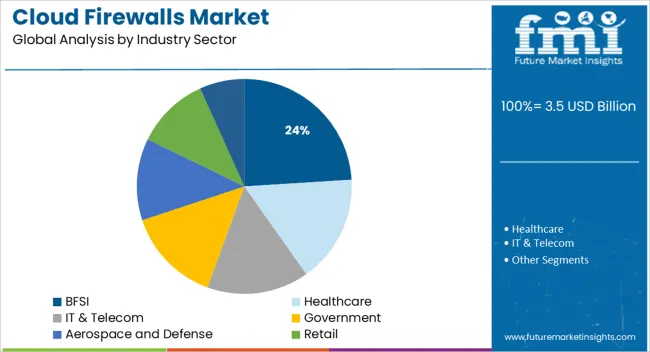
As per FMI, the BFSI segment is expected to create an absolute $ opportunity of US$ 1,169.0 Million by the end of 2032. The rising adoption of next-generation firewalls across sectors like banks and financial institutions is driving the growth of this segment.

The enterprises that execute a significant volume of sensitive transactions and important data in daily operations are intended for cloud firewall security. Throughout the day, banking and financial organizations work with clients’ transaction data. Their requirements to sustain uptime as well as to protect crucial business activities and data are supported by cloud firewall protections.

Global usage of digital currency is accelerating due to the development of blockchain technologies. Due to the fact that these transactions are entirely web-based, it is crucial to safeguard these gateways right now. Thus, this trend has increased the adoption of next-generation firewalls in the BFSI sector.
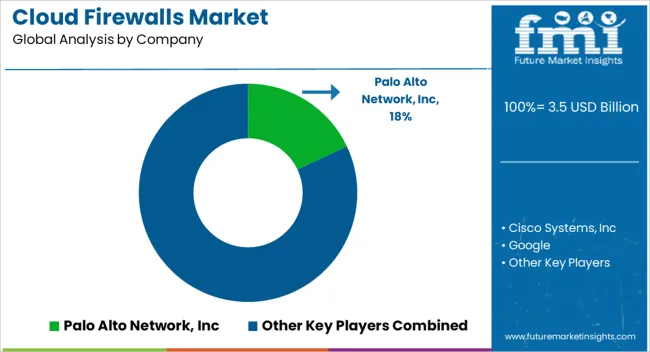
Competitive Landscape

Cloud firewall providers are developing tactics like product innovation to increase their service offerings and technology portfolios to better satisfy customer needs. In order to match end-user expectations and increase their client base, many companies are also working with technology experts to develop their own cutting-edge solutions.

For instance

  • In February 2022, Juniper launched cloud firewalls into secure access service edge (SASE). In order to enable enterprises to secure workforces wherever they are, this innovative solution offers Firewall-as-a-Service (FWaaS) as a single-stack software architecture, controlled by the security director cloud.
  • In March 2022, Palo Alto Networks launched a managed next-generation firewall service for AWS designed to simplify securing AWS deployments.
  • In December 2021, Cloudflare developed its cloud-native firewall to assist businesses in securing their whole corporate networks by enhancing its zero-trust firewall capabilities.

Cloud Firewalls for Enhanced Cybersecurity: Google, Cisco, and Sophos Bringing in Innovation to Maintain their Reign

Cloud firewalls, also known as ‘next-generation firewalls’ have garnered considerable interest and investment from leading tech companies. Google has taken the lead in cloud firewall innovation and continues to make it easier for businesses to have the security of a firewall for their network devices.

Google’s cloud firewalls rely on multiple data sources and take reference from a vast database of previously identifiable threats. Considering the growing competition in maintaining cloud firewalls, Google is also offering users added advantage of in-house activity to analyze past patterns and draw inferences from them.

As security norms continue to change, Google’s strategy is to have flexibility and agility so its cloud firewalls can be deployed on the networking devices of the future. The global search engine giant is also ramping up its defense mechanism to avert attacks of a massive scale. For instance, in August 2022, Google reported it had stopped a cyberattack which had grown from 100,000 reps to a peak of 46 million reps.

Further, Google also announced changes to its Play Store to counter the growing threat of misinformation and enhance the security of its users.

Cisco is also upping its cloud firewalls game by providing users with a variety of features at affordable prices. It is the leading manufacturer of physical firewalls and as the tech world moves to the cloud, it is investing in next-generation firewalls.

Cisco is also keeping a close watch on the reduction in prices of firewalls and making adjustments to its own offerings. For instance, in April 2022, the company announced it will be launching a range of mid-priced firewalls to capitalize on the shift toward hybrid environments.

Similarly, in June 2022, Cisco announced that it is designing the Cisco Security Cloud that will secure and connect organizations of all shapes and sizes.

The company is also focusing on patching its high-severity vulnerability that has affected its ASA and firepower solutions. Through timely patches and vulnerability detection, the company is boosting the confidence of its end-users about overall security.

Sophos, a leading cybersecurity firm, offers a wide range of cloud firewall solutions. It is actively working towards creating solutions that support the growing cloud infrastructure. For instance, in July 2022, Sophos announced cloud-native security for creating comprehensive cybersecurity coverage. Cloud-native security comes with protection and detection for host and container workload security.

Similarly, in April 2022, the company introduced a new version of Sophos Firewall with Xstream software-defined wide area network capabilities and best-in-class VPN enhancements that effectively boost network performance and flexibility.

Scope Of Report

Attributes Details
Market value in 2022 US$ 2.2 Billion
Projected Market Valuation (2032) US$ 10.4 Billion
Market CAGR 2022 to 2032 16.7%
Share of top 5 players Around 33%
Forecast Period 2022 to 2032
Historical Data Available for 2017 to 2021
Market Analysis US$ Billion for Value
Key Regions Covered North America, Latin America, Europe, East Asia, South Asia & Pacific, and the Middle East & Africa
Key Countries Covered USA, Canada, United Kingdom, Germany, France, Italy, Spain, Benelux, Russia, China, Japan, South Korea, India, Malaysia, Indonesia, Singapore, Australia & New Zealand, GCC Countries, Turkey, South Africa
Key Segments Covered The solution, Enterprise Size, Industry, and Region
Key Companies Profiled
  • Google
  • Cisco Systems, Inc
  • Palo Alto Networks Inc
  • Juniper Networks
  • Sophos Ltd.
  • Check Point Software Technologies
  • Barracuda Networks
  • WatchGuard Technologies
  • Cloudflare
  • Imperva
  • Zscaler Inc
  • Fortinet Inc
Report Coverage Market Forecast, Company Share Analysis, Competition Intelligence, Drivers, Restraints, Opportunities and ThreatsAnalysis, Market Dynamics and Challenges, and Strategic Growth Initiatives

Cloud Firewalls Outlook By Category

By Solution:

  • Appliances
  • Services

By Enterprise Size:

  • Small & Mid-sized Enterprises
  • Large Enterprises

By Industry:

  • BFSI
  • Healthcare
  • IT & Telecom
  • Government
  • Aerospace and Defense
  • Retail
  • Others

By Region:

  • North America
  • Latin America
  • Europe
  • East Asia
  • South Asia & Pacific
  • Middle East and Africa (MEA)

Frequently Asked Questions

What is the current size of the global cloud firewalls market?

The global cloud firewalls market size reached US$ 1.9 Billion in 2021 and is likely to touch a valuation of US$ 2.2 Billion in 2022.

What is the projected valuation of cloud firewalls market in 2032?

The cloud firewalls industry is estimated to grow at a CAGR of 16.7% between 2022 and 2032, reaching a valuation of US$ 10.4 Billion by 2032.

What are the key trends shaping the growth of cloud firewalls industry?

Rising demand for advanced security solutions to mitigate emerging cyber threats and IoT-cloud convergence are the key trends shaping the growth of the global market.

Which is the leading solution segment in cloud firewalls market?

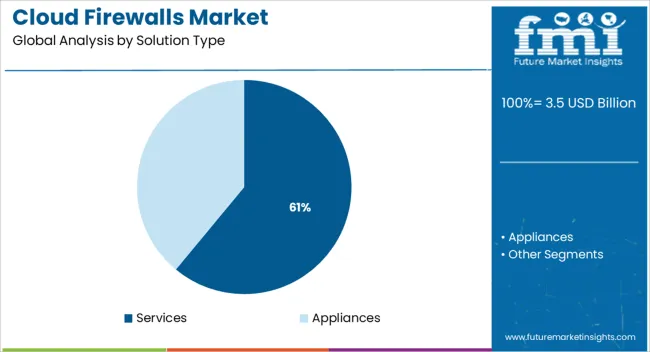
Cloud firewall appliances dominated the market with the highest market share of 59.8% in 2021.

What was the last 5-year cloud firewalls market CAGR?

The market in the last 5 years (2017 to 2021) grew by a CAGR of 15.0%.

Which countries are key providers of cloud firewalls?

Countries involved in providing cloud-firewall solutions include the USA, the United Kingdom, Germany, China, and India.

Which are the top countries driving demand?

The top 5 countries driving demand for cloud firewalls include Canada, France, Italy, Indonesia, India, and Japan.

Who are the top companies offering in the global market?

Some of the leading companies in this landscape are Juniper Networks, Sophos, Ltd., Cloudflare, Fortinet Inc, and Cisco Systems, Inc. As per Future Market Insights, nearly 33% of the market share is currently held by the top players.

Which is the fastest growing market for cloud firewalls?

South Asia & Pacific is forecast to emerge as the fastest-growing market for cloud firewalls, exhibiting a CAGR of nearly 21.5% between 2022 and 2032.

Table of Content

1. Executive Summary | Cloud Firewalls Market

    1.1. Global Market Outlook

    1.2. Demand Side Trends

    1.3. Supply Side Trends

    1.4. Analysis and Recommendations

2. Market Overview

    2.1. Market Coverage / Taxonomy

    2.2. Market Definition / Scope / Limitations

3. Key Market Trends

    3.1. Key Trends Impacting the Market

    3.2. Product Innovation / Development Trends

4. Pricing Analysis

    4.1. Pricing Models

    4.2. Global Average Pricing Analysis Benchmark

5. Global Market Demand (in Value in US$ Million) Analysis 2017 to 2021 and Forecast, 2022 to 2032

    5.1. Historical Market Value (US$ Million) Analysis, 2017 to 2021

    5.2. Current and Future Market Value (US$ Million) Projections, 2022 to 2032

        5.2.1. Y-o-Y Growth Trend Analysis

        5.2.2. Absolute $ Opportunity Analysis

6. Market Background

    6.1. Macro-Economic Factors

    6.2. Forecast Factors - Relevance & Impact

    6.3. Value Chain

    6.4. Market Dynamics

        6.4.1. Drivers

        6.4.2. Restraints

        6.4.3. Opportunities

7. Global Market Analysis 2017 to 2021 and Forecast 2022 to 2032, By Solution

    7.1. Introduction / Key Findings

    7.2. Historical Market Size (US$ Million) Analysis By Solution, 2017 to 2021

    7.3. Current and Future Market Size (US$ Million) Analysis and Forecast By Solution, 2022 to 2032

        7.3.1. Appliances

        7.3.2. Services

    7.4. Market Attractiveness Analysis By Solution

8. Global Market Analysis 2017 to 2021 and Forecast 2022 to 2032, By Enterprise Size

    8.1. Introduction / Key Findings

    8.2. Historical Market Size (US$ Million) Analysis By Enterprise Size, 2017 to 2021

    8.3. Current and Future Market Size (US$ Million) Analysis and Forecast By Enterprise Size, 2022 to 2032

        8.3.1. Small and Mid-Sized Enterprises (SMEs)

        8.3.2. Large Enterprises

    8.4. Market Attractiveness Analysis By Enterprise Size

9. Global Market Analysis 2017 to 2021 and Forecast 2022 to 2032, By Industry

    9.1. Introduction / Key Findings

    9.2. Historical Market Size (US$ Million) Analysis By Industry, 2017 to 2021

    9.3. Current and Future Market Size (US$ Million) Analysis and Forecast By Industry, 2022 to 2032

        9.3.1. BFSI

        9.3.2. Healthcare

        9.3.3. IT & Telecom

        9.3.4. Government

        9.3.5. Aerospace & Defense

        9.3.6. Retail

        9.3.7. Others

    9.4. Market Attractiveness Analysis By Industry

10. Global Market Analysis 2017 to 2021 and Forecast 2022 to 2032, by Region

    10.1. Introduction / Key Findings

    10.2. Historical Market Size (US$ Million) Analysis By Region, 2017 to 2021

    10.3. Current and Future Market Size (US$ Million) Analysis and Forecast By Region, 2022 to 2032

        10.3.1. North America

        10.3.2. Latin America

        10.3.3. Europe

        10.3.4. East Asia

        10.3.5. South Asia & Pacific

        10.3.6. Middle East & Africa

    10.4. Market Attractiveness Analysis By Region

11. North America Market Analysis 2017 to 2021 and Forecast 2022 to 2032

    11.1. Introduction

    11.2. Historical Market Size (US$ Million) Trend Analysis By Market Taxonomy, 2017 to 2021

    11.3. Current and Future Market Size (US$ Million) Forecast By Market Taxonomy, 2022 to 2032

        11.3.1. By Solution

        11.3.2. By Enterprise Size

        11.3.3. By Industry

        11.3.4. By Country

            11.3.4.1. United States of America

            11.3.4.2. Canada

    11.4. Market Attractiveness Analysis

        11.4.1. By Solution

        11.4.2. By Enterprise Size

        11.4.3. By Industry

        11.4.4. By Country

    11.5. Market Trends

    11.6. Key Market Participants - Intensity Mapping

12. Latin America Market Analysis 2017 to 2021 and Forecast 2022 to 2032

    12.1. Introduction

    12.2. Historical Market Size (US$ Million) Trend Analysis By Market Taxonomy, 2017 to 2021

    12.3. Current and Future Market Size (US$ Million) Forecast By Market Taxonomy, 2022 to 2032

        12.3.1. By Solution

        12.3.2. By Enterprise Size

        12.3.3. By Industry

        12.3.4. By Country

            12.3.4.1. Brazil

            12.3.4.2. Mexico

            12.3.4.3. Rest of Latin America

    12.4. Market Attractiveness Analysis

        12.4.1. By Solution

        12.4.2. By Enterprise Size

        12.4.3. By Industry

        12.4.4. By Country

    12.5. Market Trends

    12.6. Key Market Participants - Intensity Mapping

13. Europe Market Analysis 2017 to 2021 and Forecast 2022 to 2032

    13.1. Introduction

    13.2. Historical Market Size (US$ Million) Trend Analysis By Market Taxonomy, 2017 to 2021

    13.3. Current and Future Market Size (US$ Million) Forecast By Market Taxonomy, 2022 to 2032

        13.3.1. By Solution

        13.3.2. By Enterprise Size

        13.3.3. By Industry

        13.3.4. By Country

            13.3.4.1. United Kingdom

            13.3.4.2. Germany

            13.3.4.3. France

            13.3.4.4. Italy

            13.3.4.5. Spain

            13.3.4.6. BENELUX

            13.3.4.7. Russia

            13.3.4.8. Rest of Europe

    13.4. Market Attractiveness Analysis

        13.4.1. By Solution

        13.4.2. By Enterprise Size

        13.4.3. By Industry

        13.4.4. By Country

    13.5. Market Trends

    13.6. Key Market Participants - Intensity Mapping

14. South Asia & Pacific Market Analysis 2017 to 2021 and Forecast 2022 to 2032

    14.1. Introduction

    14.2. Historical Market Size (US$ Million) Trend Analysis By Market Taxonomy, 2017 to 2021

    14.3. Current and Future Market Size (US$ Million) Forecast By Market Taxonomy, 2022 to 2032

        14.3.1. By Solution

        14.3.2. By Enterprise Size

        14.3.3. By Industry

        14.3.4. By Country

            14.3.4.1. India

            14.3.4.2. Indonesia

            14.3.4.3. Malaysia

            14.3.4.4. Singapore

            14.3.4.5. Australia & New Zealand

            14.3.4.6. Rest of South Asia and Pacific

    14.4. Market Attractiveness Analysis

        14.4.1. By Solution

        14.4.2. By Enterprise Size

        14.4.3. By Industry

        14.4.4. By Country

    14.5. Market Trends

    14.6. Key Market Participants - Intensity Mapping

15. East Asia Market Analysis 2017 to 2021 and Forecast 2022 to 2032

    15.1. Introduction

    15.2. Historical Market Size (US$ Million) Trend Analysis By Market Taxonomy, 2017 to 2021

    15.3. Current and Future Market Size (US$ Million) Forecast By Market Taxonomy, 2022 to 2032

        15.3.1. By Solution

        15.3.2. By Enterprise Size

        15.3.3. By Industry

        15.3.4. By Country

            15.3.4.1. China

            15.3.4.2. Japan

            15.3.4.3. South Korea

    15.4. Market Attractiveness Analysis

        15.4.1. By Solution

        15.4.2. By Enterprise Size

        15.4.3. By Industry

        15.4.4. By Country

    15.5. Market Trends

    15.6. Key Market Participants - Intensity Mapping

16. Middle East and Africa Market Analysis 2017 to 2021 and Forecast 2022 to 2032

    16.1. Introduction

    16.2. Historical Market Size (US$ Million) Trend Analysis By Market Taxonomy, 2017 to 2021

    16.3. Current and Future Market Size (US$ Million) Forecast By Market Taxonomy, 2022 to 2032

        16.3.1. By Solution

        16.3.2. By Enterprise Size

        16.3.3. By Industry

        16.3.4. By Country

            16.3.4.1. GCC Countries

            16.3.4.2. Turkey

            16.3.4.3. South Africa

            16.3.4.4. Rest of Middle East and Africa

    16.4. Market Attractiveness Analysis

        16.4.1. By Solution

        16.4.2. By Enterprise Size

        16.4.3. By Industry

        16.4.4. By Country

    16.5. Market Trends

    16.6. Key Market Participants - Intensity Mapping

17. Key Countries Analysis- Market

    17.1. United States of America Market Analysis

        17.1.1. By Solution

        17.1.2. By Enterprise Size

        17.1.3. By Industry

    17.2. Canada Market Analysis

        17.2.1. By Solution

        17.2.2. By Enterprise Size

        17.2.3. By Industry

    17.3. Mexico Market Analysis

        17.3.1. By Solution

        17.3.2. By Enterprise Size

        17.3.3. By Industry

    17.4. Brazil Market Analysis

        17.4.1. By Solution

        17.4.2. By Enterprise Size

        17.4.3. By Industry

    17.5. United Kingdom Market Analysis

        17.5.1. By Solution

        17.5.2. By Enterprise Size

        17.5.3. By Industry

    17.6. Germany Market Analysis

        17.6.1. By Solution

        17.6.2. By Enterprise Size

        17.6.3. By Industry

    17.7. France Market Analysis

        17.7.1. By Solution

        17.7.2. By Enterprise Size

        17.7.3. By Industry

    17.8. Italy Market Analysis

        17.8.1. By Solution

        17.8.2. By Enterprise Size

        17.8.3. By Industry

    17.9. Spain Market Analysis

        17.9.1. By Solution

        17.9.2. By Enterprise Size

        17.9.3. By Industry

    17.10. BENELUX Market Analysis

        17.10.1. By Solution

        17.10.2. By Enterprise Size

        17.10.3. By Industry

    17.11. Russia Market Analysis

        17.11.1. By Solution

        17.11.2. By Enterprise Size

        17.11.3. By Industry

    17.12. Rest of Europe Market Analysis

        17.12.1. By Solution

        17.12.2. By Enterprise Size

        17.12.3. By Industry

    17.13. China Market Analysis

        17.13.1. By Solution

        17.13.2. By Enterprise Size

        17.13.3. By Industry

    17.14. Japan Market Analysis

        17.14.1. By Solution

        17.14.2. By Enterprise Size

        17.14.3. By Industry

    17.15. South Korea Market Analysis

        17.15.1. By Solution

        17.15.2. By Enterprise Size

        17.15.3. By Industry

    17.16. India Market Analysis

        17.16.1. By Solution

        17.16.2. By Enterprise Size

        17.16.3. By Industry

    17.17. Malaysia Market Analysis

        17.17.1. By Solution

        17.17.2. By Enterprise Size

        17.17.3. By Industry

    17.18. Indonesia Market Analysis

        17.18.1. By Solution

        17.18.2. By Enterprise Size

        17.18.3. By Industry

    17.19. Singapore Market Analysis

        17.19.1. By Solution

        17.19.2. By Enterprise Size

        17.19.3. By Industry

    17.20. Australia and New Zealand Market Analysis

        17.20.1. By Solution

        17.20.2. By Enterprise Size

        17.20.3. By Industry

    17.21. Rest of South Asia and Pacific Market Analysis

        17.21.1. By Solution

        17.21.2. By Enterprise Size

        17.21.3. By Industry

    17.22. GCC Countries Market Analysis

        17.22.1. By Solution

        17.22.2. By Enterprise Size

        17.22.3. By Industry

    17.23. Turkey Market Analysis

        17.23.1. By Solution

        17.23.2. By Enterprise Size

        17.23.3. By Industry

    17.24. South Africa Market Analysis

        17.24.1. By Solution

        17.24.2. By Enterprise Size

        17.24.3. By Industry

    17.25. Rest of the Middle East and Africa Market Analysis

        17.25.1. By Solution

        17.25.2. By Enterprise Size

        17.25.3. By Industry

18. Market Structure Analysis

    18.1. Market Analysis by Tier of Companies

    18.2. Market Share Analysis of Top Players

    18.3. Market Presence Analysis

19. Competition Analysis

    19.1. Competition Dashboard

    19.2. Key Strategies, By Competitors

    19.3. Competition Deep Dive

        19.3.1. Google

            19.3.1.1. Business Overview

            19.3.1.2. Product Portfolio

            19.3.1.3. Profitability by Market Segments (Business Segments/Region)

            19.3.1.4. Sales Footprint

            19.3.1.5. Strategy Overview

        19.3.2. Cisco Systems, Inc

            19.3.2.1. Business Overview

            19.3.2.2. Product Portfolio

            19.3.2.3. Profitability by Market Segments (Business Segments/Region)

            19.3.2.4. Sales Footprint

            19.3.2.5. Strategy Overview

        19.3.3. Palo Alto Network, Inc

            19.3.3.1. Business Overview

            19.3.3.2. Product Portfolio

            19.3.3.3. Profitability by Market Segments (Business Segments/Region)

            19.3.3.4. Sales Footprint

            19.3.3.5. Strategy Overview

        19.3.4. Juniper Networks

            19.3.4.1. Business Overview

            19.3.4.2. Product Portfolio

            19.3.4.3. Profitability by Market Segments (Business Segments/Region)

            19.3.4.4. Sales Footprint

            19.3.4.5. Strategy Overview

        19.3.5. Sophos, Ltd

            19.3.5.1. Business Overview

            19.3.5.2. Product Portfolio

            19.3.5.3. Profitability by Market Segments (Business Segments/Region)

            19.3.5.4. Sales Footprint

            19.3.5.5. Strategy Overview

        19.3.6. Check Point Software Technologies

            19.3.6.1. Business Overview

            19.3.6.2. Product Portfolio

            19.3.6.3. Profitability by Market Segments (Business Segments/Region)

            19.3.6.4. Sales Footprint

            19.3.6.5. Strategy Overview

        19.3.7. Barracuda Networks

            19.3.7.1. Business Overview

            19.3.7.2. Product Portfolio

            19.3.7.3. Profitability by Market Segments (Business Segments/Region)

            19.3.7.4. Sales Footprint

            19.3.7.5. Strategy Overview

        19.3.8. WatchGaurd Technologies

            19.3.8.1. Business Overview

            19.3.8.2. Product Portfolio

            19.3.8.3. Profitability by Market Segments (Business Segments/Region)

            19.3.8.4. Sales Footprint

            19.3.8.5. Strategy Overview

        19.3.9. Cloudflare

            19.3.9.1. Business Overview

            19.3.9.2. Product Portfolio

            19.3.9.3. Profitability by Market Segments (Business Segments/Region)

            19.3.9.4. Sales Footprint

            19.3.9.5. Strategy Overview

        19.3.10. Imperva

            19.3.10.1. Business Overview

            19.3.10.2. Product Portfolio

            19.3.10.3. Profitability by Market Segments (Business Segments/Region)

            19.3.10.4. Sales Footprint

            19.3.10.5. Strategy Overview

        19.3.11. Zscaler Inc

            19.3.11.1. Business Overview

            19.3.11.2. Product Portfolio

            19.3.11.3. Profitability by Market Segments (Business Segments/Region)

            19.3.11.4. Sales Footprint

            19.3.11.5. Strategy Overview

        19.3.12. Fortinet Inc

            19.3.12.1. Business Overview

            19.3.12.2. Product Portfolio

            19.3.12.3. Profitability by Market Segments (Business Segments/Region)

            19.3.12.4. Sales Footprint

            19.3.12.5. Strategy Overview

20. Assumptions and Acronyms Used

21. Research Methodology

List of Tables

Table 01: Global Market Value (US$ Million) Analysis (2017 to 2021) By Solution

Table 02: Global Market Value (US$ Million) Forecast (2022 to 2032) By Solution

Table 03: Global Market Volume (‘000 Units) Forecast (2022 to 2032) By Solution

Table 04: Global Market Value (US$ Million) Analysis (2017 to 2021) By Enterprise Size

Table 05: Global Market Value (US$ Million) Forecast (2022 to 2032) By Enterprise Size

Table 06: Global Market Value (US$ Million) Analysis (2017 to 2021) By Industry

Table 07: Global Market Value (US$ Million) Forecast (2022 to 2032) By Industry

Table 08: Global Market Value (US$ Million) Analysis (2017 to 2021) by Region

Table 09: Global Market Value (US$ Million) Forecast (2022 to 2032) by Region

Table 10: North America Market Value (US$ Million) Analysis (2017 to 2021) By Solution

Table 11: North America Market Value (US$ Million) Forecast (2022 to 2032) By Solution

Table 12: North America Market Value (US$ Million) Analysis (2017 to 2021) By Enterprise Size

Table 13: North America Market Value (US$ Million) Forecast (2022 to 2032) By Enterprise Size

Table 14: North America Market Value (US$ Million) Analysis (2017 to 2021) By Industry (1/2)

Table 15: North America Market Value (US$ Million) Forecast (2022 to 2032) By Industry (1/2)

Table 16: North America Market Value (US$ Million) Analysis (2017 to 2021) by Country

Table 17: North America Market Value (US$ Million) Forecast (2022 to 2032) by Country

Table 18: Latin America Market Value (US$ Million) Analysis (2017 to 2021) By Solution

Table 19: Latin America Market Value (US$ Million) Forecast (2022 to 2032) By Solution

Table 20: Latin America Market Value (US$ Million) Analysis (2017 to 2021) By Enterprise Size

Table 21: Latin America Market Value (US$ Million) Forecast (2022 to 2032) By Enterprise Size

Table 22: Latin America Market Value (US$ Million) Analysis (2017 to 2021) By Industry (1/2)

Table 23: Latin America Market Value (US$ Million) Forecast (2022 to 2032) By Industry (1/2)

Table 24: Latin America Market Value (US$ Million) Analysis (2017 to 2021) by Country

Table 25: Latin America Market Value (US$ Million) Forecast (2022 to 2032) by Country

Table 26: Europe Market Value (US$ Million) Analysis (2017 to 2021) By Solution

Table 27: Europe Market Value (US$ Million) Forecast (2022 to 2032) By Solution

Table 28: Europe Market Value (US$ Million) Analysis (2017 to 2021) By Enterprise Size

Table 29: Europe Market Value (US$ Million) Forecast (2022 to 2032) By Enterprise Size

Table 30: Europe Market Value (US$ Million) Analysis (2017 to 2021) By Industry

Table 31: Europe Market Value (US$ Million) Forecast (2022 to 2032) By Industry

Table 32: Europe Market Value (US$ Million) Analysis (2017 to 2021) by Country

Table 33: Europe Market Value (US$ Million) Forecast (2022 to 2032) by Country

Table 34: South Asia & Pacific Market Value (US$ Million) Analysis (2017 to 2021) By Solution

Table 35: South Asia & Pacific Market Value (US$ Million) Forecast (2022 to 2032) By Solution

Table 36: South Asia & Pacific Market Value (US$ Million) Analysis (2017 to 2021) By Enterprise Size

Table 37: South Asia & Pacific Market Value (US$ Million) Forecast (2022 to 2032) By Enterprise Size

Table 38: South Asia & Pacific Market Value (US$ Million) Analysis (2017 to 2021) By Industry

Table 39: South Asia & Pacific Market Value (US$ Million) Forecast (2022 to 2032) By Industry

Table 40: South Asia & Pacific Market Value (US$ Million) Analysis (2017 to 2021) by Country

Table 41: South Asia & Pacific Market Value (US$ Million) Forecast (2022 to 2032) by Country

Table 42: East Asia Market Value (US$ Million) Analysis (2017 to 2021) By Solution

Table 43: East Asia Market Value (US$ Million) Forecast (2022 to 2032) By Solution

Table 44: East Asia Market Value (US$ Million) Analysis (2017 to 2021) By Enterprise Size

Table 45: East Asia Market Value (US$ Million) Forecast (2022 to 2032) By Enterprise Size

Table 46: East Asia Market Value (US$ Million) Analysis (2017 to 2021) By Industry

Table 47: East Asia Market Value (US$ Million) Forecast (2022 to 2032) By Industry

Table 48: East Asia Market Value (US$ Million) Analysis (2017 to 2021) by Country

Table 49: East Asia Market Value (US$ Million) Forecast (2022 to 2032) by Country

Table 50: Middle East and Africa Market Value (US$ Million) Analysis (2017 to 2021) By Solution

Table 51: Middle East and Africa Market Value (US$ Million) Forecast (2022 to 2032) By Solution

Table 52: Middle East and Africa Market Value (US$ Million) Analysis (2017 to 2021) By Enterprise Size

Table 53: Middle East and Africa Market Value (US$ Million) Forecast (2022 to 2032) By Enterprise Size

Table 54: Middle East and Africa Market Value (US$ Million) Analysis (2017 to 2021) By Industry

Table 55: Middle East and Africa Market Value (US$ Million) Forecast (2022 to 2032) By Industry

Table 56: Middle East and Africa Market Value (US$ Million) Analysis (2017 to 2021) by Country

Table 57: Middle East and Africa Market Value (US$ Million) Forecast (2022 to 2032) by Country

List of Charts

Figure 01: Global Market Size (US$ Million) and Y-o-Y Growth Rate from 2022 to 2032

Figure 02: Global Market Size and Y-o-Y Growth Rate from 2022 to 2032

Figure 03: Global Market Value (US$ Million), 2017 to 2021

Figure 04: Global Market Value (US$ Million), 2022 to 2032

Figure 05: Global Market Value Share Analysis (2022 to 2032) By Solution

Figure 06: Global Market Value Y-o-Y Growth Trend Analysis (2017 to 2032) By Solution

Figure 07: Global Market Attractiveness By Solution

Figure 08: Global Market Value Share Analysis (2022 to 2032) By Enterprise Size

Figure 09: Global Market Value Y-o-Y Growth Trend Analysis (2017 to 2032) By Enterprise Size

Figure 10: Global Market Attractiveness By Enterprise Size

Figure 11: Global Market Value Share Analysis (2022 to 2032) By Industry

Figure 12: Global Market Value Y-o-Y Growth Trend Analysis (2017 to 2032) By Industry

Figure 13: Global Market Attractiveness By Industry

Figure 14: Global Market Value Share Analysis (2022 to 2032) by Region

Figure 15: Global Market Value Y-o-Y Growth Trend Analysis (2017 to 2032) by Region

Figure 16: Global Market Attractiveness by Region

Figure 17: North America Market Absolute $ Opportunity (US$ Million), 2017 to 2032

Figure 18: Latin America Market Absolute $ Opportunity (US$ Million), 2017 to 2032

Figure 19: Europe Market Absolute $ Opportunity (US$ Million), 2017 to 2032

Figure 20: East Asia Market Absolute $ Opportunity (US$ Million), 2017 to 2032

Figure 21: South Asia & Pacific Market Absolute $ Opportunity (US$ Million), 2017 to 2032

Figure 22: Middle East & Africa Market Absolute $ Opportunity (US$ Million), 2017 to 2032

Figure 23: North America Market Value (US$ Million), 2017 to 2021

Figure 24: North America Market Value (US$ Million), 2022 to 2032

Figure 25: North America Market Value Share Analysis (2022 to 2032) By Solution

Figure 26: North America Market Value Y-o-Y Growth Trend Analysis (2017 to 2032) By Solution

Figure 27: North America Market Attractiveness By Solution

Figure 28: North America Market Value Share Analysis (2022 to 2032) By Enterprise Size

Figure 29: North America Market Value Y-o-Y Growth Trend Analysis (2017 to 2032) By Enterprise Size

Figure 30: North America Market Attractiveness By Enterprise Size

Figure 31: North America Market Value Share Analysis (2022 to 2032) By Industry

Figure 32: North America Market Value Y-o-Y Growth Trend Analysis (2017 to 2032) By Industry

Figure 33: North America Market Attractiveness By Industry

Figure 34: North America Market Value Share Analysis (2022 to 2032) by Country

Figure 35: North America Market Value Y-o-Y Growth Trend Analysis (2017 to 2032) by Country

Figure 36: North America Market Attractiveness by Country

Figure 37: USA Market Absolute $ Opportunity (US$ Million), 2017 to 2032

Figure 38: Canada Market Absolute $ Opportunity (US$ Million), 2017 to 2032

Figure 39: Latin America Market Value (US$ Million), 2017 to 2021

Figure 40: Latin America Market Value (US$ Million), 2022 to 2032

Figure 41: Latin America Market Value Share Analysis (2022 to 2032) By Solution

Figure 42: Latin America Market Value Y-o-Y Growth Trend Analysis (2017 to 2032) By Solution

Figure 43: Latin America Market Attractiveness By Solution

Figure 44: Latin America Market Value Share Analysis (2022 to 2032) By Enterprise Size

Figure 45: Latin America Market Value Y-o-Y Growth Trend Analysis (2017 to 2032) By Enterprise Size

Figure 46: Latin America Market Attractiveness By Enterprise Size

Figure 47: Latin America Market Value Share Analysis (2022 to 2032) By Industry

Figure 48: Latin America Market Value Y-o-Y Growth Trend Analysis (2017 to 2032) By Industry

Figure 49: Latin America Market Attractiveness By Industry

Figure 50: Latin America Market Value Share Analysis (2022 to 2032) by Country

Figure 51: Latin America Market Value Y-o-Y Growth Trend Analysis (2017 to 2032) by Country

Figure 52: Latin America Market Attractiveness by Country

Figure 53: Brazil Market Absolute $ Opportunity (US$ Million), 2017 to 2032

Figure 54: Mexico Market Absolute $ Opportunity (US$ Million), 2017 to 2032

Figure 55: Rest of Latin America Market Absolute $ Opportunity (US$ Million), 2017 to 2032

Figure 56: Europe Market Value (US$ Million), 2017 to 2021

Figure 57: Europe Market Value (US$ Million), 2022 to 2032

Figure 58: Europe Market Value Share Analysis (2022 to 2032) By Solution

Figure 59: Europe Market Value Y-o-Y Growth Trend Analysis (2017 to 2032) By Solution

Figure 60: Europe Market Attractiveness By Solution

Figure 61: Europe Market Value Share Analysis (2022 to 2032) By Enterprise Size

Figure 62: Europe Market Value Y-o-Y Growth Trend Analysis (2017 to 2032) By Enterprise Size

Figure 63: Europe Market Attractiveness By Enterprise Size

Figure 64: Europe Market Value Share Analysis (2022 to 2032) By Industry

Figure 65: Europe Market Value Y-o-Y Growth Trend Analysis (2017 to 2032) By Industry

Figure 66: Europe Market Attractiveness By Industry

Figure 67: Europe Market Value Share Analysis (2022 to 2032) by Country

Figure 68: Europe Market Value Y-o-Y Growth Trend Analysis (2017 to 2032) by Country

Figure 69: Europe Market Attractiveness by Country

Figure 70: Germany Market Absolute $ Opportunity (US$ Million), 2017 to 2032

Figure 71: Italy Market Absolute $ Opportunity (US$ Million), 2017 to 2032

Figure 72: France Market Absolute $ Opportunity (US$ Million), 2017 to 2032

Figure 73: United Kingdom Market Absolute $ Opportunity (US$ Million), 2017 to 2032

Figure 74: Spain Market Absolute $ Opportunity (US$ Million), 2017 to 2032

Figure 75: BENELUX Market Absolute $ Opportunity (US$ Million), 2017 to 2032

Figure 76: Russia Market Absolute $ Opportunity (US$ Million), 2017 to 2032

Figure 77: Rest of Europe Market Absolute $ Opportunity (US$ Million), 2017 to 2032

Figure 78: South Asia & Pacific Market Value (US$ Million), 2017 to 2021

Figure 79: South Asia & Pacific Market Value (US$ Million), 2022 to 2032

Figure 80: South Asia & Pacific Market Value Share Analysis (2022 to 2032) By Solution

Figure 81: South Asia & Pacific Market Value Y-o-Y Growth Trend Analysis (2017 to 2032) By Solution

Figure 82: South Asia & Pacific Market Attractiveness By Solution

Figure 83: South Asia & Pacific Market Value Share Analysis (2022 to 2032) By Enterprise Size

Figure 84: South Asia & Pacific Market Value Y-o-Y Growth Trend Analysis (2017 to 2032) By Enterprise Size

Figure 85: South Asia & Pacific Market Attractiveness By Enterprise Size

Figure 86: South Asia & Pacific Market Value Share Analysis (2022 to 2032) By Industry

Figure 87: South Asia & Pacific Market Value Y-o-Y Growth Trend Analysis (2017 to 2032) By Industry

Figure 88: South Asia & Pacific Market Attractiveness By Industry

Figure 89: South Asia & Pacific Market Value Share Analysis (2022 to 2032) by Country

Figure 90: South Asia & Pacific Market Value Y-o-Y Growth Trend Analysis (2017 to 2032) by Country

Figure 91: South Asia & Pacific Market Attractiveness by Country

Figure 92: India Market Absolute $ Opportunity (US$ Million), 2017 to 2032

Figure 93: Indonesia Market Absolute $ Opportunity (US$ Million), 2017 to 2032

Figure 94: Malaysia Market Absolute $ Opportunity (US$ Million), 2017 to 2032

Figure 95: Singapore Market Absolute $ Opportunity (US$ Million), 2017 to 2032

Figure 96: Australia& New Zealand Market Absolute $ Opportunity (US$ Million), 2017 to 2032

Figure 97: Rest of South Asia & Pacific Market Absolute $ Opportunity (US$ Million), 2017 to 2032

Figure 98: East Asia Market Value (US$ Million), 2017 to 2021

Figure 99: East Asia Market Value (US$ Million), 2022 to 2032

Figure 100: East Asia Market Value Share Analysis (2022 to 2032) By Solution

Figure 101: East Asia Market Value Y-o-Y Growth Trend Analysis (2017 to 2032) By Solution

Figure 102: East Asia Market Attractiveness By Solution

Figure 103: East Asia Market Value Share Analysis (2022 to 2032) By Enterprise Size

Figure 104: East Asia Market Value Y-o-Y Growth Trend Analysis (2017 to 2032) By Enterprise Size

Figure 105: East Asia Market Attractiveness By Enterprise Size

Figure 106: East Asia Market Value Share Analysis (2022 to 2032) By Industry

Figure 107: East Asia Market Value Y-o-Y Growth Trend Analysis (2017 to 2032) By Industry

Figure 108: East Asia Market Attractiveness By Industry

Figure 109: East Asia Market Value Share Analysis (2022 to 2032) by Country

Figure 110: East Asia Market Value Y-o-Y Growth Trend Analysis (2017 to 2032) by Country

Figure 111: East Asia Market Attractiveness by Country

Figure 112: China Market Absolute $ Opportunity (US$ Million), 2017 to 2032

Figure 113: Japan Market Absolute $ Opportunity (US$ Million), 2017 to 2032

Figure 114: South Korea Market Absolute $ Opportunity (US$ Million), 2017 to 2032

Figure 115: Middle East and Africa Market Value (US$ Million), 2017 to 2021

Figure 116: Middle East and Africa Market Value (US$ Million), 2022 to 2032

Figure 117: Middle East and Africa Market Value Share Analysis (2022 to 2032) By Solution

Figure 118: Middle East and Africa Market Value Y-o-Y Growth Trend Analysis (2017 to 2032) By Solution

Figure 119: Middle East and Africa Market Attractiveness By Solution

Figure 120: Middle East and Africa Market Value Share Analysis (2022 to 2032) By Enterprise Size

Figure 121: Middle East and Africa Market Value Y-o-Y Growth Trend Analysis (2017 to 2032) By Enterprise Size

Figure 122: Middle East and Africa Market Attractiveness By Enterprise Size

Figure 123: Middle East and Africa Market Value Share Analysis (2022 to 2032) By Industry

Figure 124: Middle East and Africa Market Value Y-o-Y Growth Trend Analysis (2017 to 2032) By Industry

Figure 125: Middle East and Africa Market Attractiveness By Industry

Figure 126: Middle East and Africa Market Value Share Analysis (2022 to 2032) by Country

Figure 127: Middle East and Africa Market Value Y-o-Y Growth Trend Analysis (2017 to 2032) by Country

Figure 128: Middle East and Africa Market Attractiveness by Country

Figure 129: GCC Countries Market Absolute $ Opportunity (US$ Million), 2017 to 2032

Figure 130: Turkey Market Absolute $ Opportunity (US$ Million), 2017 to 2032

Figure 131: South Africa Market Absolute $ Opportunity (US$ Million), 2017 to 2032

Figure 132: Rest of Middle East and Africa Market Absolute $ Opportunity (US$ Million), 2017 to 2032

Recommendations

Technology

Cloud Access Security Brokers Market

Published : May 2023

Technology

MEA Cloud Integration Market

Published : November 2022

Technology

Multi Cloud Storage Market

Published : October 2022

Technology

Telecom Cloud Market

Published : August 2022

Explore Technology Insights

View Reports