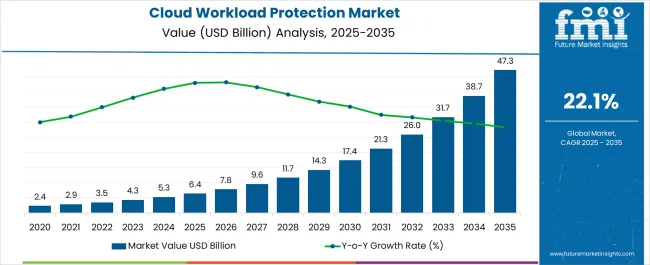
The Cloud Workload Protection Market is estimated to be valued at USD 6.4 billion in 2025 and is projected to reach USD 47.3 billion by 2035, registering a compound annual growth rate (CAGR) of 22.1% over the forecast period.
| Metric | Value |
|---|---|
| Cloud Workload Protection Market Estimated Value in (2025 E) | USD 6.4 billion |
| Cloud Workload Protection Market Forecast Value in (2035 F) | USD 47.3 billion |
| Forecast CAGR (2025 to 2035) | 22.1% |
The cloud workload protection market is experiencing accelerated growth as organizations prioritize threat mitigation across dynamic, multi-cloud, and hybrid environments. The increasing frequency of cloud-native attacks and the need for granular visibility into workload behavior have heightened demand for automated, scalable protection solutions.
Enterprises are modernizing infrastructure with containerization, microservices, and serverless computing, all of which require security approaches designed specifically for cloud workloads. Cloud security compliance mandates, coupled with the need for real-time telemetry and runtime protection, are driving adoption across sectors.
Strategic investments in AI-based threat detection, zero-trust workload segmentation, and DevSecOps integration are enabling security vendors to differentiate in a competitive market. As cloud adoption continues to mature globally, workload-specific protection is expected to become a critical component of enterprise cybersecurity strategies.
The market is segmented by Solution Type, Enterprise Size, and Industry and region. By Solution Type, the market is divided into Platform and Services. In terms of Enterprise Size, the market is classified into Large Enterprises and Small and Mid-Sized Enterprises (SMEs). Based on Industry, the market is segmented into BFSI, Government, IT & Telecom, Retail, Manufacturing, Media & Entertainment, Healthcare, and Others. Regionally, the market is classified into North America, Latin America, Western Europe, Eastern Europe, Balkan & Baltic Countries, Russia & Belarus, Central Asia, East Asia, South Asia & Pacific, and the Middle East & Africa.
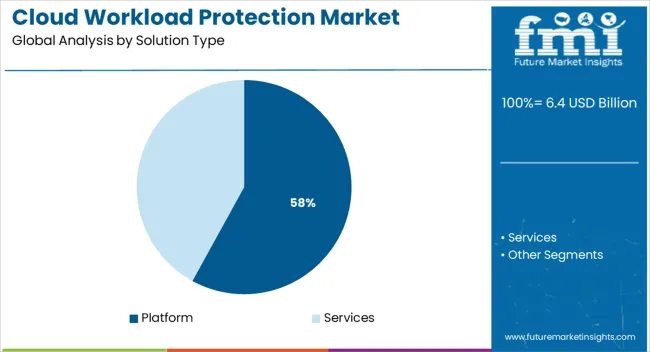
The platform segment is projected to account for 58.0% of the total market revenue in 2025, making it the leading solution type. This dominance is being driven by the need for unified protection across varied workloads—spanning virtual machines, containers, and serverless functions.
Platforms provide centralized visibility, automated policy enforcement, and integrated threat intelligence, which are essential for securing dynamic cloud environments. Their ability to offer multi-layered defenses including compliance monitoring, behavioral analysis, and runtime protection makes them more comprehensive than standalone tools.
As enterprises consolidate cybersecurity tools to reduce complexity and cost, integrated cloud workload protection platforms are being favored for their scalability, API readiness, and support for continuous deployment pipelines.
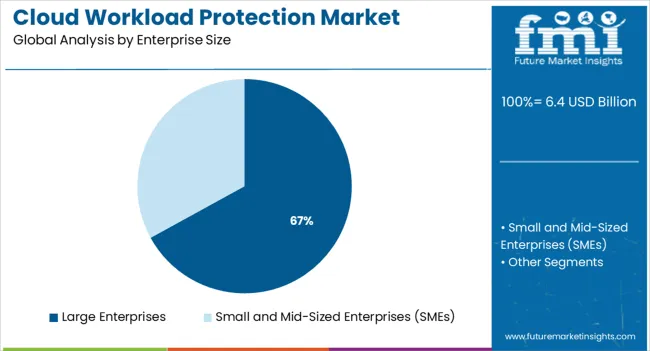
Large enterprises are expected to contribute 67.0% of the cloud workload protection market’s revenue in 2025, making them the most significant customer segment. This leadership is attributed to the scale and complexity of IT environments in large organizations, which typically span across multiple public and private cloud infrastructures.
These enterprises face heightened regulatory scrutiny and are more exposed to advanced persistent threats, necessitating robust and adaptable security solutions. The budget flexibility of large enterprises allows for investment in enterprise-grade platforms offering automation, compliance support, and workload-centric analytics.
Additionally, the adoption of hybrid cloud strategies and distributed DevOps teams has made workload visibility and orchestration critical, reinforcing demand for centralized protection frameworks.
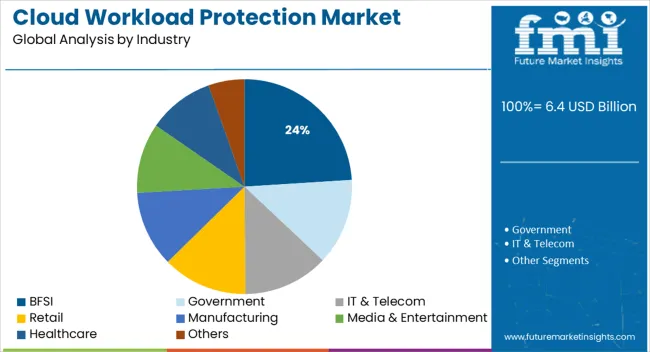
The BFSI sector is projected to account for 24.0% of the total revenue in 2025, positioning it as the leading industry segment within the cloud workload protection market. This dominance stems from the highly sensitive nature of financial data and the strict regulatory environment governing data privacy and transaction integrity.
Institutions in banking, insurance, and financial services are increasingly migrating workloads to the cloud while ensuring continuous monitoring, encryption, and access control. Real-time detection of anomalies and policy violations is critical in preventing fraud and ensuring service uptime.
The sector’s investment in containerized environments for fintech innovation has further elevated the need for runtime security and micro-segmentation. As cyber risk becomes a board-level priority in BFSI, cloud workload protection platforms are being integrated into broader security and governance frameworks.
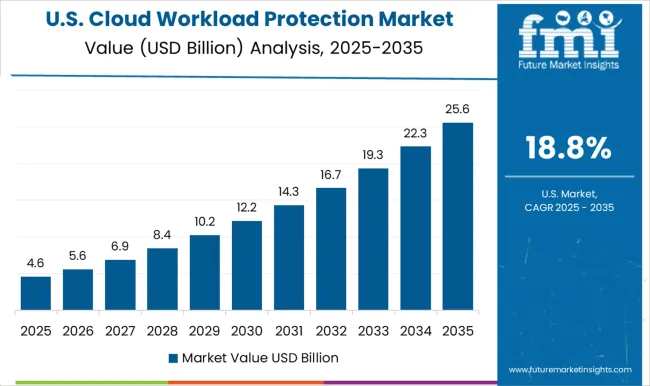
North America is expected to dominate the cloud workload protection market. The area is home to leading cloud providers like as Microsoft Corporation and Amazon Web Services, which are constantly improving their cloud solutions and growing their client base. According to IBM, corporate adoption of managed cloud infrastructure services in the United States is expected to reach 68% in 2024, up from 34% in 2020.
Organizations in the area are transitioning away from the public cloud and into a new age of hybrid IT, which blends public cloud, private cloud, and conventional IT. These firms are employing a hybrid cloud approach to help them improve their company and provide services to clients, hence boosting market demand.
The BFSI industry segment is expected to increase at a CAGR of 19.1% over the projection period. With the fast rise of cloud footprint in the last 18 months, banks are progressively implementing cloud security. Approximately 58% of a bank's workloads are being transferred to the cloud. As a result, the BFSI industry is emphasising workload protection to support essential cloud workloads and avoid malware, lateral attacks, and other dangers.
Issues about ransomware attacks and cloud security threats, as well as dangers connected with remote work and cybersecurity concerns related to social engineering, are driving up market demand for cloud workload protection. Furthermore, the financial sector's spike in need for digital transformation is propelling the industry from a cloud-averse to a cloud-first paradigm, creating demand for cloud security solutions.
Cloud workload protection market currently represents around 7.1% sales of the total cloud security market. Adoption of cloud workload protection solutions have gained traction over the years owing to the significant shift in business priorities.
This has led to increased adoption of multi cloud strategies, which empower organizations to distribute the cloud workloads and containers across multiple cloud environments. Adoption of multi-cloud infrastructure solutions is surging the cloud workload protection market demand.
As it maintains hybrid cloud environments secure while maintaining cost efficiency, the demand is expected to nearly double over the coming decade. Implementation of multi-cloud strategies in organizations offers cloud VMs, low latency, workload configuration, optimization in ROI and security focused cloud workloads.
Some of the key factor facilitating the adoption of multiple cloud strategies across cloud environments include robust risk management services, network performance improvements network and risk mitigation offered by multi-cloud solution providers.
The cloud workload protection market is estimated to grow at 22.1% CAGR between 2025 and 2035 in comparison with 20.4% CAGR during 2020-2024, opines Future Market Insights (FMI).
Another factor improving the adoption of cloud workload protection solutions is the growing need for cloud security solutions for cloud workloads moving across multiple cloud environments.
The adoption of workload protection platforms assists in incorporating security into devOps practices for the organization and eliminates unnecessary complexities. Cloud workload protection platforms provides clear visibility into the cloud environments and offer faster, accurate threat detection.
The complexities of cloud environments have increased with the expansion of cloud applications in almost every organization worldwide. Since different risks are carried by different applications, managing cloud security for multiple clients by service providers becomes complex. Hence, cloud protection plays a vital role in securing and simplifying of workloads moving across multiple cloud environments.
Also, the use of various endpoints and devices while utilizing cloud networks is becoming difficult to manage without centralized management. And thus, centralization in management of endpoints and devices results in improved traffic analysis of networks, web filtering and ease in execution of recovery plans.
Hence, the rising demand for robust security solutions to satisfy the frequency and speed requirements of cloud deployments is surging workload protection demand.
South Asia & Pacific region is estimated to be the fastest growing region in the cloud encryption market and is expected to grow by 11.1X during the forecast period (2025 to 2035). Increasing adoption of cloud technologies supported by economic growth in the developing countries. This is fueling the demand for cloud workload protection solutions in South Asia & Pacific.
As companies in South Asia & Pacific region continue to expand their digital footprint, the obstacles arising from an infrastructure perspective have been addressed with the adoption of cloud computing. This has led to the increased demand for identification of different cloud workloads in organizations with emphasis on consumer data protection.
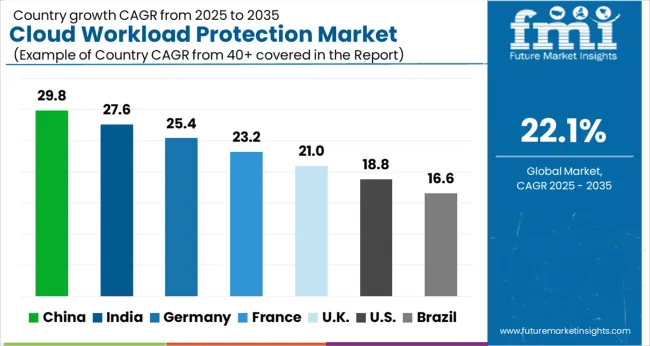
Integration of Cloud Computing in Organizations to Boost the USA Cloud Workload Protection Market
The cloud workload protection market in the USA is expected to account for nearly 81.2% of North America market share in 2025. With the advent of cloud computing, the USA is witnessing exponential growth in the cloud market owing to its benefits such as scalability, and cost effectiveness.
Demand in the market is also predicted to burgeon with the presence of multiple cloud market organizations, advanced IT infrastructure, and availability of technological resources.
Furthermore, the availability of technical expertise, rapid advancement and quick deployment of emerging technologies will boost the market.
Growing Adoption of Public Cloud and Infrastructure Services to Push Cloud Workload Protection Solutions Demand
East Asia is predicted to remain one of the most attractive markets during the forecast period. According to Future Market Insights, China is estimated to grow by 7.8X during the forecast period.
Digital transformation, rising adoption of public cloud and infrastructure services in China is fueling the growth of the cloud workload protection market. Growing expansion of the services market is fueling the growth and presence of key players, including Alibaba, Tencent, Huawei Technologies and more.
Furthermore, with cybersecurity and data privacy requirements, including national standards and government initiatives for digital transformation is adding to the market demand.
Rising Cyber Attacks Incidence to Facilitate Cloud Workload Protection Solutions Adoption
According to the study, India is estimated to grow by 13.2X during the forecast period. India has been experiencing growth in the adoption of digital technologies since the global pandemic. Growing adoption of cloud services has also impacted the cybersecurity landscape resulting a spike in the number of cyberattacks across the country.
The need to manage cloud workloads across multiple clouds environments with the gaps between business needs and IT capabilities. Risks of ransomware attacks with cyber threats have also contributed for fueling the demand for cloud protection solutions.
Organizations across the country have recognized the significance and requirements of modern data protection solutions. Investments in cloud protection platforms in the country have increased for management of multi cloud infrastructure, prevention of data loss and enhancement of the economics of product and solutions.
Need for Cloud Protection Platforms to Burgeon as Importance of Cloud Security Surges
The cloud workload protection platform segment is expected to showcase highest CAGR through 2035, as per FMI. This segment is forecasted to create absolute opportunity of USD 17,383.9 Million by the end of 2035. Incorporating cloud workload protection platforms ensures on demand scaling of resources for achieving flexible workload security.
The importance of cloud security for business continuity with seamless online collaboration has been highlighted by the COVID-19 pandemic. The exponential growth of cloud workload protection platforms can be observed with dynamic nature of cloud workloads and increased system distribution across various external cloud environments.
Growing Number of Cyberattacks in SMEs to Boost the Demand for Cloud Workload Protection Market
The small & mid-sized enterprise (SME) segment is expected to grow with the highest CAGR of 23.9% during the forecast period. Risks of cyberattacks and cybersecurity threats are prevailing in small & mid-sized organizations.
Several SMEs are now adopting cloud computing approach for bridging the gaps of cloud security. SMEs with public and multiple cloud vendors are adopting cloud workload protection platforms for bringing automation in security protection of cloud native stacks, while supporting integration workflows.
Also, the rapid growth and transformation in the digital business of small and mid-sized enterprises with the importance of scaling cloud computing is driving the market demand.
BFSI Sector to Account for Nearly 1/5th of Cloud Workload Protection Market Sales
In terms of industry, the BFSI segment is estimated to grow at a CAGR of 19.1% during the forecast period. Banks are increasingly adopting cloud security with the rapid growth of cloud footprint in the last 18 months.
About 58% of workloads from a bank is being migrated on cloud. Therefore, BFSI industry is prioritizing workload protection for supporting of critical cloud workloads for prevention of malware, lateral threats and more.
Also, concerns associated with ransomware attacks and cloud security threats, risks with remote work and cybersecurity concerns linked with social engineering is increasing the demand for cloud workload protection in the market.
Furthermore, surge in demand for digital transformation in the financial sector is driving the industry from cloud averse to cloud first paradigm driving the demand for cloud security solutions.
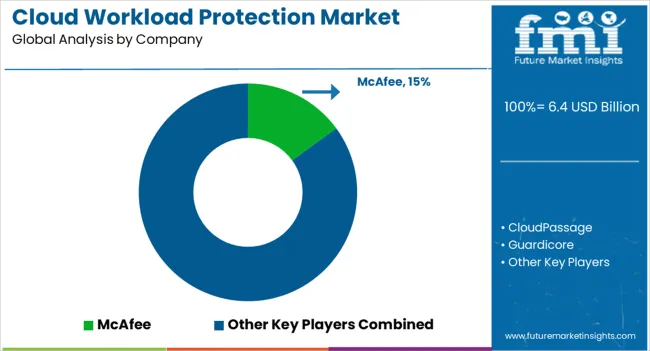
Cloud workload management market players are concentrating on enterprise collaborations, partnerships and product innovations for strengthening market position, expansion in geographic footprint and increase in in sales.
| Attribute | Details |
|---|---|
| Forecast Period | 2025 to 2035 |
| Historical Data Available for | 2020 to 2024 |
| Market Analysis | USD Million for Value |
| Key Regions Covered | North America; Latin America; Europe; East Asia; South Asia & Pacific; and the Middle East & Africa |
| Key Countries Covered | USA, Canada, Germany, UK, France, Italy, Spain, Russia, China, Japan, South Korea, India, Malaysia, Indonesia, Singapore, Australia & New Zealand, GCC Countries, Turkey, North Africa and South Africa |
| Key Segments Covered | Solution, Enterprise Size, Industry and Region. |
| Key Companies Profiled | McAfee; HyTrust; Guardicore; Sophos Group Plc; Symantec Corporation; Trend Micro, Inc; CloudPassage; Dome9 Security, Inc; Aqua Security Software Ltd; Illumio; Orca Security; Logrhythm |
| Report Coverage | Market Forecast, Company Share Analysis, Competition Intelligence, DROT Analysis, Market Dynamics and Challenges, and Strategic Growth Initiatives |
| Customization & Pricing | Available upon Request |
The global cloud workload protection market is estimated to be valued at USD 6.4 billion in 2025.
The market size for the cloud workload protection market is projected to reach USD 47.3 billion by 2035.
The cloud workload protection market is expected to grow at a 22.1% CAGR between 2025 and 2035.
The key product types in cloud workload protection market are platform, _cloud based, _on-premises, services, _professional services, _consulting services, _support & maintenance, _training and education and _managed services.
In terms of enterprise size, large enterprises segment to command 67.0% share in the cloud workload protection market in 2025.


Our Research Products

The "Full Research Suite" delivers actionable market intel, deep dives on markets or technologies, so clients act faster, cut risk, and unlock growth.

The Leaderboard benchmarks and ranks top vendors, classifying them as Established Leaders, Leading Challengers, or Disruptors & Challengers.

Locates where complements amplify value and substitutes erode it, forecasting net impact by horizon

We deliver granular, decision-grade intel: market sizing, 5-year forecasts, pricing, adoption, usage, revenue, and operational KPIs—plus competitor tracking, regulation, and value chains—across 60 countries broadly.

Spot the shifts before they hit your P&L. We track inflection points, adoption curves, pricing moves, and ecosystem plays to show where demand is heading, why it is changing, and what to do next across high-growth markets and disruptive tech

Real-time reads of user behavior. We track shifting priorities, perceptions of today’s and next-gen services, and provider experience, then pace how fast tech moves from trial to adoption, blending buyer, consumer, and channel inputs with social signals (#WhySwitch, #UX).

Partner with our analyst team to build a custom report designed around your business priorities. From analysing market trends to assessing competitors or crafting bespoke datasets, we tailor insights to your needs.
Supplier Intelligence
Discovery & Profiling
Capacity & Footprint
Performance & Risk
Compliance & Governance
Commercial Readiness
Who Supplies Whom
Scorecards & Shortlists
Playbooks & Docs
Category Intelligence
Definition & Scope
Demand & Use Cases
Cost Drivers
Market Structure
Supply Chain Map
Trade & Policy
Operating Norms
Deliverables
Buyer Intelligence
Account Basics
Spend & Scope
Procurement Model
Vendor Requirements
Terms & Policies
Entry Strategy
Pain Points & Triggers
Outputs
Pricing Analysis
Benchmarks
Trends
Should-Cost
Indexation
Landed Cost
Commercial Terms
Deliverables
Brand Analysis
Positioning & Value Prop
Share & Presence
Customer Evidence
Go-to-Market
Digital & Reputation
Compliance & Trust
KPIs & Gaps
Outputs
Full Research Suite comprises of:
Market outlook & trends analysis
Interviews & case studies
Strategic recommendations
Vendor profiles & capabilities analysis
5-year forecasts
8 regions and 60+ country-level data splits
Market segment data splits
12 months of continuous data updates
DELIVERED AS:
PDF EXCEL ONLINE
Cloud Data Encryption Solutions Market Size and Share Forecast Outlook 2025 to 2035
Cloud Service Market Size and Share Forecast Outlook 2025 to 2035
Cloud Analytics Market Size and Share Forecast Outlook 2025 to 2035
Cloud ERP Industry Analysis in Latin America Forecast Outlook 2025 to 2035
Cloud Backup Service Industry Analysis in Latin America Size and Share Forecast Outlook 2025 to 2035
Cloud Compliance Market Size and Share Forecast Outlook 2025 to 2035
Cloud-Based ITSM Market Size and Share Forecast Outlook 2025 to 2035
Cloud IT Infrastructure Hardware Market Size and Share Forecast Outlook 2025 to 2035
Cloud POS Market Size and Share Forecast Outlook 2025 to 2035
Cloud Systems Management Software Market Size and Share Forecast Outlook 2025 to 2035
Cloud Telephony Services Market Size and Share Forecast Outlook 2025 to 2035
Cloud Field Service Management (FSM) Market Size and Share Forecast Outlook 2025 to 2035
Cloud Seeding System Market Size and Share Forecast Outlook 2025 to 2035
Cloud Professional Services Market Size and Share Forecast Outlook 2025 to 2035
Cloud Based Collaboration Software Market Size and Share Forecast Outlook 2025 to 2035
Cloud Printing Services Market Size and Share Forecast Outlook 2025 to 2035
Cloud Migration Service Market Size and Share Forecast Outlook 2025 to 2035
Cloudifier Market Size and Share Forecast Outlook 2025 to 2035
Cloud Database and DBaaS Market Size and Share Forecast Outlook 2025 to 2035
Cloud ERP Market Size and Share Forecast Outlook 2025 to 2035

Thank you!
You will receive an email from our Business Development Manager. Please be sure to check your SPAM/JUNK folder too.
Chat With
MaRIA