Cloud Computing Market
A Detailed Analysis of Cloud Computing Market by Public Model and Private Cloud
Emerging Paradigms- Unraveling the Dynamic Landscape of the Cloud Computing Market in the Age of Edge Computing, Hybrid Solutions, and AI Integration. Find More with FMI
Cloud Computing Market Outlook (2023 to 2033)
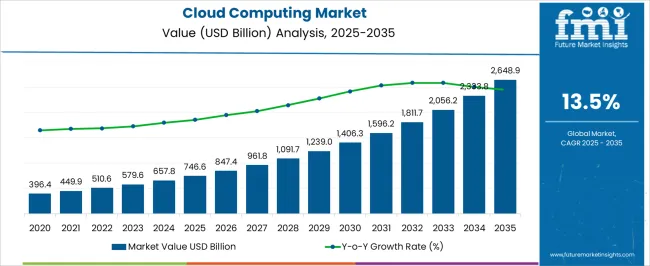
In 2023, the worldwide cloud computing market achieved a valuation of US$ 579.58 billion, and it is anticipated to expand at a steady pace of 13.5% between 2023 and 2033, ultimately reaching an impressive value of US$ 2,062.26 billion by 2033.
With the growing realization of the immense benefits of using public cloud computing platforms, the market has emerged as an important part of the global economic system. In the present world, there are several cloud computing service providers catering to a huge demand for various remote facilities.
What are the Different Market Dynamics Propelling the Global Cloud Computing Market?
Given the immense advantages of integrating cloud computing services, the global markets are nowadays providing cloud-based servers for small businesses for increasing their customer base.
- Cloud computing architecture enables streamlined business operations and quick adaptation to the market.
- Transitioning to a cloud-based infrastructure fuels global demand for cloud computing, improving efficiency and agility.
- Integration of cloud computing systems streamlines technology use and drives behavioral changes among workers.
- Increased accountability from various changes boosts deployment of cloud-based servers for small businesses.
- Introduction of modern digital technologies like big data analytics and AI creates high demand for cloud computing in service-based industries worldwide.
- Growing demand for scalability, flexibility, and cost-efficiency in IT infrastructure.
- Rising need for data storage, processing, and analysis capabilities.
- Emergence of edge computing and hybrid cloud solutions.
- Growing reliance on Software-as-a-Service (SaaS) and Infrastructure-as-a-Service (IaaS) models.
- Enhanced cybersecurity measures and data protection in cloud environments.
What are the Key Obstacles Impeding the Progress of Market Participants?
The following are likely to prove as challenges that participants are confronted with:
- Security of data stored on open-source security storage platforms is a key concern for cloud computing providers.
- External vulnerabilities pose risks to the stored data, potentially hindering market growth.
- Regulations related to data privacy in cross-border security storage networks are a significant limitation for the global market for cloud computing.
- Compliance with data privacy regulations beyond national borders presents challenges to wide market acceptance.
- Dominance of leading cloud market companies based on brand value impacts customer acquisition for new companies.
- Establishing a customer base in the face of industry giants like Google and Microsoft can be highly challenging for new cloud computing providers.
- Competition from big players like Google Computing and Microsoft Edge Computing adds to the difficulties faced by new companies in their initial operations.
Attributes | Details |
---|---|
Cloud Computing Market Value (2023) |
US$ 579.58 billion |
Cloud Computing Market Value (2033) |
US$ 2,062.26 billion |
Cloud Computing Market Growth Rate (2023 to 2033) |
13.5 %. |
Don't pay for what you don't need
Customize your report by selecting specific countries or regions and save 30%!
What is Fueling the Cloud Computing Market?
Improving digital literacy around the world and the rapid adoption of digital applications for enhancing the user experience has compelled many service-based companies to blend in several features in their production systems. This need for combining many different digital features is promoting the use of cloud computing platforms as a perfect model creating great opportunities for cloud computing providers.
The market is also getting high traction in the form of long-term subscriptions to personal cloud computing services these days. The establishment of many cloud computing industries in the global market has brought down computing costs considerably in the past years. The decreasing prices of cloud computing services are expected to surge the market for cloud computing from 2023 to 2033.
The use of the Google cloud platform or any other cloud computing platform has decreased the cost of production by reducing the requirement of hiring on-site employees. This stands as a prominent point for the high popularity of cloud computing services in the global market.
Comparative View of the Adjacent Cloud Computing Market
Cloud Computing Market:
Attributes | Cloud Computing Market |
---|---|
CAGR (2023 to 2033) |
13.5% |
Market Value (2033) |
US$ 2,062.26 |
Growth Factor |
The trend of selling products on e-commerce websites is driving the cloud-based markets. |
Opportunity |
The emergence of several internet-based start-ups requires many cloud computing technologies. |
Key Trends |
Shifting of workforce from physical offices to homes is driving the requirement. |
E-commerce Market:
Attributes | E-commerce Market |
---|---|
CAGR (2023 to 2033) |
19% |
Market Value (2033) |
US$ 65.5 billion |
Growth Factor |
Reduction in prices of consumables due to the elimination of traders and middlemen. |
Opportunity |
Relaxation of terrific and other taxes on global consumer market players is anticipated to create a huge market. |
Key Trends |
Growth in digital literacy is the prime region for the growing popularity of e-commerce websites. |
Healthcare IT Outsourcing Market:
Attributes | Healthcare IT Outsourcing Market |
---|---|
CAGR (2023 to 2033) |
7.1% |
Market Value (2033) |
US$ 106 billion |
Growth Factor |
Increased adoption of electronic health record (EHR) systems and the need for efficient data management and healthcare information exchange. |
Opportunity |
Expansion of telehealth services and remote patient monitoring, leading to increased demand for IT outsourcing solutions to support virtual care delivery and data management. |
Key Trends |
Growing focus on cyber security and data privacy in healthcare IT outsourcing, driven by the need to protect sensitive patient information and comply with regulatory requirements. |
Segmentation Analysis
What is Contributing to the Leading Position of Software as a Service (SaaS) Sub-segment on the Basis of Service Type?
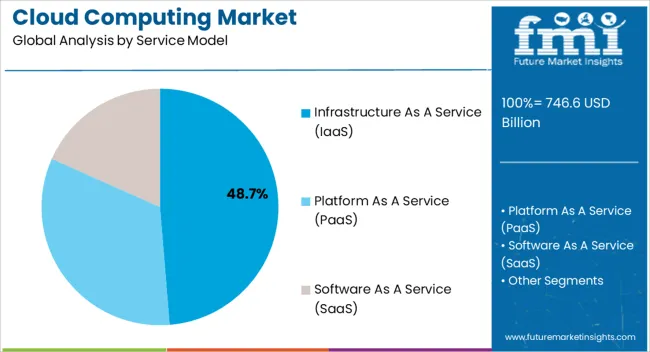
As per FMI study, the Software as a Service (SaaS) sub-segment led the market, holding a value share of 52.7% globally in 2022.
The rising enterprise demand is expected to accelerate the growth of the Software as a Service (SaaS) sector, driven by its simple deployment and low maintenance requirements. Its subscription-based model provides cost efficiencies by eliminating upfront infrastructure investments. SaaS sub segment also simplifies deployment and updates, relieving organizations of maintenance tasks.
By leveraging SaaS, organizations can focus on their core competencies and strategic goals. Outsourcing software functionality to SaaS providers allows businesses to allocate their resources and efforts toward their primary areas of expertise. This results in improved productivity and efficiency.
Which Deployment Model Segment of the Cloud Computing Market Holds a Substantial Share?
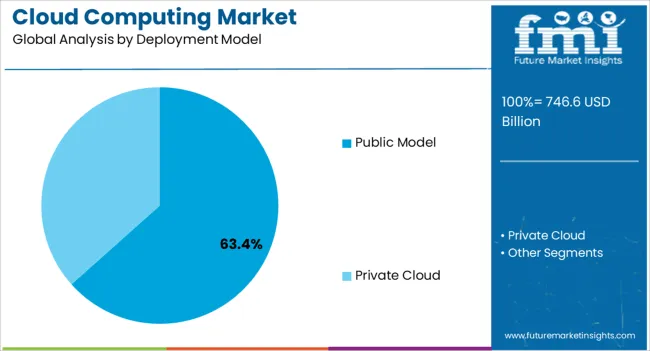
The applicability of cloud computing networks has covered a lot of areas in any economy. Most end users prefer the public cloud segment owing to its great affordability and easy availability of users. In the coming years, this segment is expected to continue its dominance over the cloud computing market share, where it accounted for 67.8% in 2022.
The private cloud deployment segment has also been analyzed to be gaining momentum with the introduction of some popular personal cloud computing products in the market. Individual customers mostly go for the best cloud backup for PC, which is anticipated to create some attractive opportunities for the market players.
What is the Performance of the Cloud Computing Industry in Different Geographical Regions?
Region | CAGR (2023 to 2033) |
---|---|
The United Kingdom (UK) |
12.5% |
China |
13.7% |
India |
13.1% |
What Elements Bolster North America's Unrivaled Supremacy in the Cloud Computing Industry?
By the broad geographical division of the global market for cloud computing, North America holds the significant share by contributing about 34.6% of the revenue as per the 2022 records.
Due to the presence of most of the leading companies such as Google computing, Amazon cloud services, Microsoft edge computing, and others, the market in the United States of America was accounted for 21.2% value share in 2022.
North America boasts a thriving business ecosystem, with several enterprises embracing cloud computing solutions. The region's mature market, entrepreneurial culture, and technological adoption contribute to its supremacy.
The regulatory environment in North America, characterized by clear data protection and privacy laws, fosters trust and confidence among businesses and consumers, facilitating the widespread adoption of cloud computing services.
What are the Prominent Drivers Fueling the Growth of the Cloud Computing Industry in the Asia Pacific Region?
During the forecast time period, the growth of Asia Pacific cloud computing market share is predicted to be high than in any other geographic region. The evolution of a robust IT sector and the emergence of new cloud market shareholders have provided the necessary impetus for a significantly growing market in the region.
In accordance with the FMI research, the market for cloud computing in China is estimated to account for a significant portion of market share, advancing at a CAGR of 13.7% and India at a rate of 13.1% from 2023 to 2033.
Asia Pacific region is witnessing a significant digital transformation across various industries. Organizations are adopting cloud computing to modernize their operations, enhance agility, and drive innovation.
What is the Prevailing Landscape and Market Position of Cloud Computing in Europe?
The growth of cloud computing providers in Europe and Latin America has also surged considerably in the past decade. With the growing demand for cloud computing services, the market is estimated to experience positive growth in these regions as well.
Europe cloud computing industry was forecasted to retain a value share of 22.4% on a global level. Europe has emerged as a significant player in the global cloud computing arena, witnessing substantial growth and adoption across various industries and sectors. Moreover, key market players, both regional and global, have established a strong presence in Europe, offering a wide range of cloud services and solutions to cater to diverse customer needs. This competitive market environment fosters innovation, drives technological advancements, and fuels the continuous evolution of cloud computing in the region.
The demand for scalable and cost-effective IT infrastructure solutions is fostering the cloud computing market size in the United Kingdom, providing impetus to its growth rate of 12.5% from 2023 to 2033.
Get the data you need at a Fraction of the cost
Personalize your report by choosing insights you need
and save 40%!
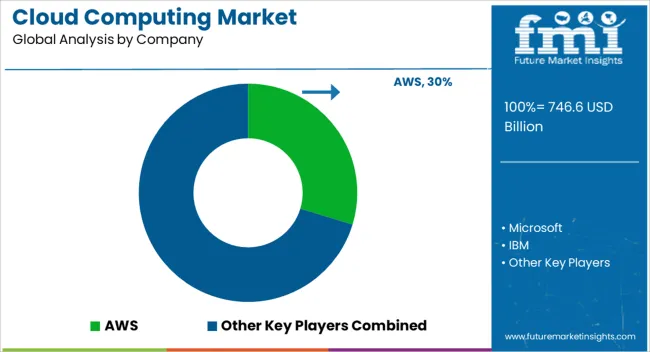
What is the Competitive Scenario for the Cloud Computing Industry?
features in their cloud computing services as per the changing working models and demands from users.
The giant cloud companies are also spending on establishing data storage centers at different world locations to diversify their security storage networks and speed up data transfer. This constant evaluation process adopted by cloud computing agencies has improved the performance of public cloud computing platforms over the years. It is further anticipated to increase the number of cloud computing subscribers in the coming days.
What are the Main Approaches Embraced by Players in the Cloud Computing Market?
- Embracing Multi-cloud Approach: Many players adopt a multi-cloud strategy, leveraging multiple cloud service providers to achieve enhanced performance, flexibility, and redundancy.
- Offering Vertical-specific Solutions: Players focus on developing industry-specific cloud solutions tailored to the unique needs and requirements of different sectors, such as healthcare, finance, or retail.
- Prioritizing Security and Compliance: Players invest in robust security measures, data encryption, and compliance certifications to address concerns related to data protection and regulatory requirements.
- Enhancing Data Analytics Capabilities: Players integrate advanced analytics and machine learning technologies into their cloud offerings, enabling customers to gain valuable insights and make data-driven decisions.
What are the Recent Developments in the Field of Cloud Computing Industry?
- The leading telecommunication company in the United States of America named, AT&T, signed an agreement with Microsoft Inc. in July 2021 from getting into a partnership. This partnership is anticipated to avail the Microsoft cloud computing platform for running the core parts of the 5G wireless network provided by AT&T.
- In September 2021, Telefonica España and Oracle collaborated on the development of new communication services for consumers as well as telecom businesses over the Oracle Exadata Cloud.
Key Players Operating in the Cloud Computing Market
- AWS
- Microsoft
- IBM
- Salesforce
- Oracle
- SAP
- Alibaba Cloud
- Adobe
- Workday
Key Segments
By Service Model:
- Infrastructure as a Service (IaaS)
- Primary Storage
- Disaster Recovery and Backup
- Archiving
- Compute
- Platform as a Service (PaaS)
- Application Development and Platforms
- Application Testing and Quality
- Analytics and Reporting
- Integration and Orchestration
- Data Management
- Software as a Service (SaaS)
- Customer Relationship Management (CRM)
- Enterprise Resource Management (ERM)
- Human Capital Management (HCM)
- Content Management
- Collaboration and Productive Suits
- Supply Chain Management (SCM)
- Business Intelligence and Analytics
- PPM and Operations
- Manufacturing Applications
By Deployment Model:
- Public Model
- Private Cloud
By Organization Size:
- Small and Medium Sized Enterprises
- Large Enterprises
By Vertical:
- BFSI
- Telecommunications
- IT and ITeS
- Government and Public Sector
- Retail and Consumer Goods
- Manufacturing
- Energy and Utilities
- Media and Entertainment
- Healthcare and Life Sciences
- Education
- Travel and Hospitality
- Transportation and Logistics
- Others
By Region:
- North America
- Latin America
- Europe
- Asia Pacific
- The Middle East and Africa (MEA)
Frequently Asked Questions
What is the Cloud Computing Market Value in 2023?
The market is valued at US$ 579.5 billion in 2023.
What is the Estimated Growth Outlook of the Market?
The market is estimated to expand at a CAGR of 13.5%.
Who are the Top Market Players?
AWS, Microsoft, and IBM are the top market players.
What Opportunities Await the Market Players?
Technological advancements to boost the market prospects.
Which is the Key Segment By Service Model?
The software-as-a-serice segment is likely to remain preferred through 2033.
Table of Content
1. Executive Summary 1.1. Global Market Outlook 1.2. Demand-side Trends 1.3. Supply-side Trends 1.4. Technology Roadmap Analysis 1.5. Analysis and Recommendations 2. Market Overview 2.1. Market Coverage / Taxonomy 2.2. Market Definition / Scope / Limitations 3. Market Background 3.1. Market Dynamics 3.1.1. Drivers 3.1.2. Restraints 3.1.3. Opportunity 3.1.4. Trends 3.2. Scenario Forecast 3.2.1. Demand in Optimistic Scenario 3.2.2. Demand in Likely Scenario 3.2.3. Demand in Conservative Scenario 3.3. Opportunity Map Analysis 3.4. Investment Feasibility Matrix 3.5. PESTLE and Porter’s Analysis 3.6. Regulatory Landscape 3.6.1. By Key Regions 3.6.2. By Key Countries 3.7. Regional Parent Market Outlook 4. Global Market Analysis 2018 to 2022 and Forecast, 2023 to 2033 4.1. Historical Market Size Value (US$ Million) Analysis, 2018 to 2022 4.2. Current and Future Market Size Value (US$ Million) Projections, 2023 to 2033 4.2.1. Y-o-Y Growth Trend Analysis 4.2.2. Absolute $ Opportunity Analysis 5. Global Market Analysis 2018 to 2022 and Forecast 2023 to 2033, By Service Model 5.1. Introduction / Key Findings 5.2. Historical Market Size Value (US$ Million) Analysis By Service Model, 2018 to 2022 5.3. Current and Future Market Size Value (US$ Million) Analysis and Forecast By Service Model, 2023 to 2033 5.3.1. Infrastructure as a Service (IaaS) 5.3.1.1. Primary Storage 5.3.1.2. Disaster Recovery and Backup 5.3.1.3. Archiving 5.3.1.4. Compute 5.3.2. Software as a Service (SaaS) 5.3.2.1. Customer Relationship Management (CRM) 5.3.2.2. Enterprise Resource Management (ERM) 5.3.2.3. Human Capital Management (HCM) 5.3.2.4. Content Management 5.3.2.5. Collaboration and Productive Suits 5.3.2.6. Supply Chain Management (SCM) 5.3.2.7. Business Intelligence and Analytics 5.3.2.8. PPM and Operations 5.3.2.9. Manufacturing Applications 5.3.3. Platform as a Service (PaaS) 5.3.3.1. Application Development and Platforms 5.3.3.2. Application Testing and Quality 5.3.3.3. Analytics and Reporting 5.3.3.4. Integration and Orchestration 5.3.3.5. Data Management 5.4. Y-o-Y Growth Trend Analysis By Service Model, 2018 to 2022 5.5. Absolute $ Opportunity Analysis By Service Model, 2023 to 2033 6. Global Market Analysis 2018 to 2022 and Forecast 2023 to 2033, By Deployment Model 6.1. Introduction / Key Findings 6.2. Historical Market Size Value (US$ Million) Analysis By Deployment Model, 2018 to 2022 6.3. Current and Future Market Size Value (US$ Million) Analysis and Forecast By Deployment Model, 2023 to 2033 6.3.1. Public Model 6.3.2. Private Cloud 6.4. Y-o-Y Growth Trend Analysis By Deployment Model, 2018 to 2022 6.5. Absolute $ Opportunity Analysis By Deployment Model, 2023 to 2033 7. Global Market Analysis 2018 to 2022 and Forecast 2023 to 2033, By Organization Size 7.1. Introduction / Key Findings 7.2. Historical Market Size Value (US$ Million) Analysis By Organization Size, 2018 to 2022 7.3. Current and Future Market Size Value (US$ Million) Analysis and Forecast By Organization Size, 2023 to 2033 7.3.1. Small and Medium-Sized Enterprises 7.3.2. Large Enterprises 7.4. Y-o-Y Growth Trend Analysis By Organization Size, 2018 to 2022 7.5. Absolute $ Opportunity Analysis By Organization Size, 2023 to 2033 8. Global Market Analysis 2018 to 2022 and Forecast 2023 to 2033, By Vertical 8.1. Introduction / Key Findings 8.2. Historical Market Size Value (US$ Million) Analysis By Vertical, 2018 to 2022 8.3. Current and Future Market Size Value (US$ Million) Analysis and Forecast By Vertical, 2023 to 2033 8.3.1. BFSI 8.3.2. Telecommunications 8.3.3. IT and ITeS 8.3.4. Government and Public Sector 8.3.5. Retail and Consumer Goods 8.3.6. Manufacturing 8.3.7. Energy and Utilities 8.3.8. Media and Entertainment 8.3.9. Healthcare and Life Sciences 8.3.10. Education 8.3.11. Travel and Hospitality 8.3.12. Others 8.4. Y-o-Y Growth Trend Analysis By Vertical, 2018 to 2022 8.5. Absolute $ Opportunity Analysis By Vertical, 2023 to 2033 9. Global Market Analysis 2018 to 2022 and Forecast 2023 to 2033, By Region 9.1. Introduction 9.2. Historical Market Size Value (US$ Million) Analysis By Region, 2018 to 2022 9.3. Current Market Size Value (US$ Million) Analysis and Forecast By Region, 2023 to 2033 9.3.1. North America 9.3.2. Latin America 9.3.3. Europe 9.3.4. South Asia 9.3.5. East Asia 9.3.6. Oceania 9.3.7. MEA 9.4. Market Attractiveness Analysis By Region 10. North America Market Analysis 2018 to 2022 and Forecast 2023 to 2033, By Country 10.1. Historical Market Size Value (US$ Million) Trend Analysis By Market Taxonomy, 2018 to 2022 10.2. Market Size Value (US$ Million) Forecast By Market Taxonomy, 2023 to 2033 10.2.1. By Country 10.2.1.1. U.S. 10.2.1.2. Canada 10.2.2. By Service Model 10.2.3. By Deployment Model 10.2.4. By Organization Size 10.2.5. By Vertical 10.3. Market Attractiveness Analysis 10.3.1. By Country 10.3.2. By Service Model 10.3.3. By Deployment Model 10.3.4. By Organization Size 10.3.5. By Vertical 10.4. Key Takeaways 11. Latin America Market Analysis 2018 to 2022 and Forecast 2023 to 2033, By Country 11.1. Historical Market Size Value (US$ Million) Trend Analysis By Market Taxonomy, 2018 to 2022 11.2. Market Size Value (US$ Million) Forecast By Market Taxonomy, 2023 to 2033 11.2.1. By Country 11.2.1.1. Brazil 11.2.1.2. Mexico 11.2.1.3. Rest of Latin America 11.2.2. By Service Model 11.2.3. By Deployment Model 11.2.4. By Organization Size 11.2.5. By Vertical 11.3. Market Attractiveness Analysis 11.3.1. By Country 11.3.2. By Service Model 11.3.3. By Deployment Model 11.3.4. By Organization Size 11.3.5. By Vertical 11.4. Key Takeaways 12. Europe Market Analysis 2018 to 2022 and Forecast 2023 to 2033, By Country 12.1. Historical Market Size Value (US$ Million) Trend Analysis By Market Taxonomy, 2018 to 2022 12.2. Market Size Value (US$ Million) Forecast By Market Taxonomy, 2023 to 2033 12.2.1. By Country 12.2.1.1. Germany 12.2.1.2. U.K. 12.2.1.3. France 12.2.1.4. Spain 12.2.1.5. Italy 12.2.1.6. Rest of Europe 12.2.2. By Service Model 12.2.3. By Deployment Model 12.2.4. By Organization Size 12.2.5. By Vertical 12.3. Market Attractiveness Analysis 12.3.1. By Country 12.3.2. By Service Model 12.3.3. By Deployment Model 12.3.4. By Organization Size 12.3.5. By Vertical 12.4. Key Takeaways 13. South Asia Market Analysis 2018 to 2022 and Forecast 2023 to 2033, By Country 13.1. Historical Market Size Value (US$ Million) Trend Analysis By Market Taxonomy, 2018 to 2022 13.2. Market Size Value (US$ Million) Forecast By Market Taxonomy, 2023 to 2033 13.2.1. By Country 13.2.1.1. India 13.2.1.2. Malaysia 13.2.1.3. Singapore 13.2.1.4. Thailand 13.2.1.5. Rest of South Asia 13.2.2. By Service Model 13.2.3. By Deployment Model 13.2.4. By Organization Size 13.2.5. By Vertical 13.3. Market Attractiveness Analysis 13.3.1. By Country 13.3.2. By Service Model 13.3.3. By Deployment Model 13.3.4. By Organization Size 13.3.5. By Vertical 13.4. Key Takeaways 14. East Asia Market Analysis 2018 to 2022 and Forecast 2023 to 2033, By Country 14.1. Historical Market Size Value (US$ Million) Trend Analysis By Market Taxonomy, 2018 to 2022 14.2. Market Size Value (US$ Million) Forecast By Market Taxonomy, 2023 to 2033 14.2.1. By Country 14.2.1.1. China 14.2.1.2. Japan 14.2.1.3. South Korea 14.2.2. By Service Model 14.2.3. By Deployment Model 14.2.4. By Organization Size 14.2.5. By Vertical 14.3. Market Attractiveness Analysis 14.3.1. By Country 14.3.2. By Service Model 14.3.3. By Deployment Model 14.3.4. By Organization Size 14.3.5. By Vertical 14.4. Key Takeaways 15. Oceania Market Analysis 2018 to 2022 and Forecast 2023 to 2033, By Country 15.1. Historical Market Size Value (US$ Million) Trend Analysis By Market Taxonomy, 2018 to 2022 15.2. Market Size Value (US$ Million) Forecast By Market Taxonomy, 2023 to 2033 15.2.1. By Country 15.2.1.1. Australia 15.2.1.2. New Zealand 15.2.2. By Service Model 15.2.3. By Deployment Model 15.2.4. By Organization Size 15.2.5. By Vertical 15.3. Market Attractiveness Analysis 15.3.1. By Country 15.3.2. By Service Model 15.3.3. By Deployment Model 15.3.4. By Organization Size 15.3.5. By Vertical 15.4. Key Takeaways 16. MEA Market Analysis 2018 to 2022 and Forecast 2023 to 2033, By Country 16.1. Historical Market Size Value (US$ Million) Trend Analysis By Market Taxonomy, 2018 to 2022 16.2. Market Size Value (US$ Million) Forecast By Market Taxonomy, 2023 to 2033 16.2.1. By Country 16.2.1.1. GCC Countries 16.2.1.2. South Africa 16.2.1.3. Israel 16.2.1.4. Rest of MEA 16.2.2. By Service Model 16.2.3. By Deployment Model 16.2.4. By Organization Size 16.2.5. By Vertical 16.3. Market Attractiveness Analysis 16.3.1. By Country 16.3.2. By Service Model 16.3.3. By Deployment Model 16.3.4. By Organization Size 16.3.5. By Vertical 16.4. Key Takeaways 17. Key Countries Market Analysis 17.1. U.S. 17.1.1. Pricing Analysis 17.1.2. Market Share Analysis, 2022 17.1.2.1. By Service Model 17.1.2.2. By Deployment Model 17.1.2.3. By Organization Size 17.1.2.4. By Vertical 17.2. Canada 17.2.1. Pricing Analysis 17.2.2. Market Share Analysis, 2022 17.2.2.1. By Service Model 17.2.2.2. By Deployment Model 17.2.2.3. By Organization Size 17.2.2.4. By Vertical 17.3. Brazil 17.3.1. Pricing Analysis 17.3.2. Market Share Analysis, 2022 17.3.2.1. By Service Model 17.3.2.2. By Deployment Model 17.3.2.3. By Organization Size 17.3.2.4. By Vertical 17.4. Mexico 17.4.1. Pricing Analysis 17.4.2. Market Share Analysis, 2022 17.4.2.1. By Service Model 17.4.2.2. By Deployment Model 17.4.2.3. By Organization Size 17.4.2.4. By Vertical 17.5. Germany 17.5.1. Pricing Analysis 17.5.2. Market Share Analysis, 2022 17.5.2.1. By Service Model 17.5.2.2. By Deployment Model 17.5.2.3. By Organization Size 17.5.2.4. By Vertical 17.6. U.K. 17.6.1. Pricing Analysis 17.6.2. Market Share Analysis, 2022 17.6.2.1. By Service Model 17.6.2.2. By Deployment Model 17.6.2.3. By Organization Size 17.6.2.4. By Vertical 17.7. France 17.7.1. Pricing Analysis 17.7.2. Market Share Analysis, 2022 17.7.2.1. By Service Model 17.7.2.2. By Deployment Model 17.7.2.3. By Organization Size 17.7.2.4. By Vertical 17.8. Spain 17.8.1. Pricing Analysis 17.8.2. Market Share Analysis, 2022 17.8.2.1. By Service Model 17.8.2.2. By Deployment Model 17.8.2.3. By Organization Size 17.8.2.4. By Vertical 17.9. Italy 17.9.1. Pricing Analysis 17.9.2. Market Share Analysis, 2022 17.9.2.1. By Service Model 17.9.2.2. By Deployment Model 17.9.2.3. By Organization Size 17.9.2.4. By Vertical 17.10. India 17.10.1. Pricing Analysis 17.10.2. Market Share Analysis, 2022 17.10.2.1. By Service Model 17.10.2.2. By Deployment Model 17.10.2.3. By Organization Size 17.10.2.4. By Vertical 17.11. Malaysia 17.11.1. Pricing Analysis 17.11.2. Market Share Analysis, 2022 17.11.2.1. By Service Model 17.11.2.2. By Deployment Model 17.11.2.3. By Organization Size 17.11.2.4. By Vertical 17.12. Singapore 17.12.1. Pricing Analysis 17.12.2. Market Share Analysis, 2022 17.12.2.1. By Service Model 17.12.2.2. By Deployment Model 17.12.2.3. By Organization Size 17.12.2.4. By Vertical 17.13. Thailand 17.13.1. Pricing Analysis 17.13.2. Market Share Analysis, 2022 17.13.2.1. By Service Model 17.13.2.2. By Deployment Model 17.13.2.3. By Organization Size 17.13.2.4. By Vertical 17.14. China 17.14.1. Pricing Analysis 17.14.2. Market Share Analysis, 2022 17.14.2.1. By Service Model 17.14.2.2. By Deployment Model 17.14.2.3. By Organization Size 17.14.2.4. By Vertical 17.15. Japan 17.15.1. Pricing Analysis 17.15.2. Market Share Analysis, 2022 17.15.2.1. By Service Model 17.15.2.2. By Deployment Model 17.15.2.3. By Organization Size 17.15.2.4. By Vertical 17.16. South Korea 17.16.1. Pricing Analysis 17.16.2. Market Share Analysis, 2022 17.16.2.1. By Service Model 17.16.2.2. By Deployment Model 17.16.2.3. By Organization Size 17.16.2.4. By Vertical 17.17. Australia 17.17.1. Pricing Analysis 17.17.2. Market Share Analysis, 2022 17.17.2.1. By Service Model 17.17.2.2. By Deployment Model 17.17.2.3. By Organization Size 17.17.2.4. By Vertical 17.18. New Zealand 17.18.1. Pricing Analysis 17.18.2. Market Share Analysis, 2022 17.18.2.1. By Service Model 17.18.2.2. By Deployment Model 17.18.2.3. By Organization Size 17.18.2.4. By Vertical 17.19. GCC Countries 17.19.1. Pricing Analysis 17.19.2. Market Share Analysis, 2022 17.19.2.1. By Service Model 17.19.2.2. By Deployment Model 17.19.2.3. By Organization Size 17.19.2.4. By Vertical 17.20. South Africa 17.20.1. Pricing Analysis 17.20.2. Market Share Analysis, 2022 17.20.2.1. By Service Model 17.20.2.2. By Deployment Model 17.20.2.3. By Organization Size 17.20.2.4. By Vertical 17.21. Israel 17.21.1. Pricing Analysis 17.21.2. Market Share Analysis, 2022 17.21.2.1. By Service Model 17.21.2.2. By Deployment Model 17.21.2.3. By Organization Size 17.21.2.4. By Vertical 18. Market Structure Analysis 18.1. Competition Dashboard 18.2. Competition Benchmarking 18.3. Market Share Analysis of Top Players 18.3.1. By Regional 18.3.2. By Service Model 18.3.3. By Deployment Model 18.3.4. By Organization Size 18.3.5. By Vertical 19. Competition Analysis 19.1. Competition Deep Dive 19.1.1. AWS 19.1.1.1. Overview 19.1.1.2. Product Portfolio 19.1.1.3. Profitability by Market Segments 19.1.1.4. Sales Footprint 19.1.1.5. Strategy Overview 19.1.1.5.1. Marketing Strategy 19.1.2. Microsoft 19.1.2.1. Overview 19.1.2.2. Product Portfolio 19.1.2.3. Profitability by Market Segments 19.1.2.4. Sales Footprint 19.1.2.5. Strategy Overview 19.1.2.5.1. Marketing Strategy 19.1.3. IBM 19.1.3.1. Overview 19.1.3.2. Product Portfolio 19.1.3.3. Profitability by Market Segments 19.1.3.4. Sales Footprint 19.1.3.5. Strategy Overview 19.1.3.5.1. Marketing Strategy 19.1.4. Salesforce 19.1.4.1. Overview 19.1.4.2. Product Portfolio 19.1.4.3. Profitability by Market Segments 19.1.4.4. Sales Footprint 19.1.4.5. Strategy Overview 19.1.4.5.1. Marketing Strategy 19.1.5. Google 19.1.5.1. Overview 19.1.5.2. Product Portfolio 19.1.5.3. Profitability by Market Segments 19.1.5.4. Sales Footprint 19.1.5.5. Strategy Overview 19.1.5.5.1. Marketing Strategy 19.1.6. Oracle 19.1.6.1. Overview 19.1.6.2. Product Portfolio 19.1.6.3. Profitability by Market Segments 19.1.6.4. Sales Footprint 19.1.6.5. Strategy Overview 19.1.6.5.1. Marketing Strategy 19.1.7. SAP 19.1.7.1. Overview 19.1.7.2. Product Portfolio 19.1.7.3. Profitability by Market Segments 19.1.7.4. Sales Footprint 19.1.7.5. Strategy Overview 19.1.7.5.1. Marketing Strategy 19.1.8. Alibaba Cloud 19.1.8.1. Overview 19.1.8.2. Product Portfolio 19.1.8.3. Profitability by Market Segments 19.1.8.4. Sales Footprint 19.1.8.5. Strategy Overview 19.1.8.5.1. Marketing Strategy 19.1.9. Adobe 19.1.9.1. Overview 19.1.9.2. Product Portfolio 19.1.9.3. Profitability by Market Segments 19.1.9.4. Sales Footprint 19.1.9.5. Strategy Overview 19.1.9.5.1. Marketing Strategy 19.1.10. Workday 19.1.10.1. Overview 19.1.10.2. Product Portfolio 19.1.10.3. Profitability by Market Segments 19.1.10.4. Sales Footprint 19.1.10.5. Strategy Overview 19.1.10.5.1. Marketing Strategy 20. Assumptions & Acronyms Used 21. Research Methodology
Don't pay for what you don't need
Customize your report by selecting specific countries or regions and save 30%!
List of Tables
Table 1: Global Market Value (US$ Million) Forecast by Region, 2018 to 2033 Table 2: Global Market Value (US$ Million) Forecast by Service Model, 2018 to 2033 Table 3: Global Market Value (US$ Million) Forecast by Deployment Model, 2018 to 2033 Table 4: Global Market Value (US$ Million) Forecast by Organization Size, 2018 to 2033 Table 5: Global Market Value (US$ Million) Forecast by Vertical, 2018 to 2033 Table 6: North America Market Value (US$ Million) Forecast by Country, 2018 to 2033 Table 7: North America Market Value (US$ Million) Forecast by Service Model, 2018 to 2033 Table 8: North America Market Value (US$ Million) Forecast by Deployment Model, 2018 to 2033 Table 9: North America Market Value (US$ Million) Forecast by Organization Size, 2018 to 2033 Table 10: North America Market Value (US$ Million) Forecast by Vertical, 2018 to 2033 Table 11: Latin America Market Value (US$ Million) Forecast by Country, 2018 to 2033 Table 12: Latin America Market Value (US$ Million) Forecast by Service Model, 2018 to 2033 Table 13: Latin America Market Value (US$ Million) Forecast by Deployment Model, 2018 to 2033 Table 14: Latin America Market Value (US$ Million) Forecast by Organization Size, 2018 to 2033 Table 15: Latin America Market Value (US$ Million) Forecast by Vertical, 2018 to 2033 Table 16: Europe Market Value (US$ Million) Forecast by Country, 2018 to 2033 Table 17: Europe Market Value (US$ Million) Forecast by Service Model, 2018 to 2033 Table 18: Europe Market Value (US$ Million) Forecast by Deployment Model, 2018 to 2033 Table 19: Europe Market Value (US$ Million) Forecast by Organization Size, 2018 to 2033 Table 20: Europe Market Value (US$ Million) Forecast by Vertical, 2018 to 2033 Table 21: South Asia Market Value (US$ Million) Forecast by Country, 2018 to 2033 Table 22: South Asia Market Value (US$ Million) Forecast by Service Model, 2018 to 2033 Table 23: South Asia Market Value (US$ Million) Forecast by Deployment Model, 2018 to 2033 Table 24: South Asia Market Value (US$ Million) Forecast by Organization Size, 2018 to 2033 Table 25: South Asia Market Value (US$ Million) Forecast by Vertical, 2018 to 2033 Table 26: East Asia Market Value (US$ Million) Forecast by Country, 2018 to 2033 Table 27: East Asia Market Value (US$ Million) Forecast by Service Model, 2018 to 2033 Table 28: East Asia Market Value (US$ Million) Forecast by Deployment Model, 2018 to 2033 Table 29: East Asia Market Value (US$ Million) Forecast by Organization Size, 2018 to 2033 Table 30: East Asia Market Value (US$ Million) Forecast by Vertical, 2018 to 2033 Table 31: Oceania Market Value (US$ Million) Forecast by Country, 2018 to 2033 Table 32: Oceania Market Value (US$ Million) Forecast by Service Model, 2018 to 2033 Table 33: Oceania Market Value (US$ Million) Forecast by Deployment Model, 2018 to 2033 Table 34: Oceania Market Value (US$ Million) Forecast by Organization Size, 2018 to 2033 Table 35: Oceania Market Value (US$ Million) Forecast by Vertical, 2018 to 2033 Table 36: MEA Market Value (US$ Million) Forecast by Country, 2018 to 2033 Table 37: MEA Market Value (US$ Million) Forecast by Service Model, 2018 to 2033 Table 38: MEA Market Value (US$ Million) Forecast by Deployment Model, 2018 to 2033 Table 39: MEA Market Value (US$ Million) Forecast by Organization Size, 2018 to 2033 Table 40: MEA Market Value (US$ Million) Forecast by Vertical, 2018 to 2033
List of Charts
Figure 1: Global Market Value (US$ Million) by Service Model, 2023 to 2033 Figure 2: Global Market Value (US$ Million) by Deployment Model, 2023 to 2033 Figure 3: Global Market Value (US$ Million) by Organization Size, 2023 to 2033 Figure 4: Global Market Value (US$ Million) by Vertical, 2023 to 2033 Figure 5: Global Market Value (US$ Million) by Region, 2023 to 2033 Figure 6: Global Market Value (US$ Million) Analysis by Region, 2018 to 2033 Figure 7: Global Market Value Share (%) and BPS Analysis by Region, 2023 to 2033 Figure 8: Global Market Y-o-Y Growth (%) Projections by Region, 2023 to 2033 Figure 9: Global Market Value (US$ Million) Analysis by Service Model, 2018 to 2033 Figure 10: Global Market Value Share (%) and BPS Analysis by Service Model, 2023 to 2033 Figure 11: Global Market Y-o-Y Growth (%) Projections by Service Model, 2023 to 2033 Figure 12: Global Market Value (US$ Million) Analysis by Deployment Model, 2018 to 2033 Figure 13: Global Market Value Share (%) and BPS Analysis by Deployment Model, 2023 to 2033 Figure 14: Global Market Y-o-Y Growth (%) Projections by Deployment Model, 2023 to 2033 Figure 15: Global Market Value (US$ Million) Analysis by Organization Size, 2018 to 2033 Figure 16: Global Market Value Share (%) and BPS Analysis by Organization Size, 2023 to 2033 Figure 17: Global Market Y-o-Y Growth (%) Projections by Organization Size, 2023 to 2033 Figure 18: Global Market Value (US$ Million) Analysis by Vertical, 2018 to 2033 Figure 19: Global Market Value Share (%) and BPS Analysis by Vertical, 2023 to 2033 Figure 20: Global Market Y-o-Y Growth (%) Projections by Vertical, 2023 to 2033 Figure 21: Global Market Attractiveness by Service Model, 2023 to 2033 Figure 22: Global Market Attractiveness by Deployment Model, 2023 to 2033 Figure 23: Global Market Attractiveness by Organization Size, 2023 to 2033 Figure 24: Global Market Attractiveness by Vertical, 2023 to 2033 Figure 25: Global Market Attractiveness by Region, 2023 to 2033 Figure 26: North America Market Value (US$ Million) by Service Model, 2023 to 2033 Figure 27: North America Market Value (US$ Million) by Deployment Model, 2023 to 2033 Figure 28: North America Market Value (US$ Million) by Organization Size, 2023 to 2033 Figure 29: North America Market Value (US$ Million) by Vertical, 2023 to 2033 Figure 30: North America Market Value (US$ Million) by Country, 2023 to 2033 Figure 31: North America Market Value (US$ Million) Analysis by Country, 2018 to 2033 Figure 32: North America Market Value Share (%) and BPS Analysis by Country, 2023 to 2033 Figure 33: North America Market Y-o-Y Growth (%) Projections by Country, 2023 to 2033 Figure 34: North America Market Value (US$ Million) Analysis by Service Model, 2018 to 2033 Figure 35: North America Market Value Share (%) and BPS Analysis by Service Model, 2023 to 2033 Figure 36: North America Market Y-o-Y Growth (%) Projections by Service Model, 2023 to 2033 Figure 37: North America Market Value (US$ Million) Analysis by Deployment Model, 2018 to 2033 Figure 38: North America Market Value Share (%) and BPS Analysis by Deployment Model, 2023 to 2033 Figure 39: North America Market Y-o-Y Growth (%) Projections by Deployment Model, 2023 to 2033 Figure 40: North America Market Value (US$ Million) Analysis by Organization Size, 2018 to 2033 Figure 41: North America Market Value Share (%) and BPS Analysis by Organization Size, 2023 to 2033 Figure 42: North America Market Y-o-Y Growth (%) Projections by Organization Size, 2023 to 2033 Figure 43: North America Market Value (US$ Million) Analysis by Vertical, 2018 to 2033 Figure 44: North America Market Value Share (%) and BPS Analysis by Vertical, 2023 to 2033 Figure 45: North America Market Y-o-Y Growth (%) Projections by Vertical, 2023 to 2033 Figure 46: North America Market Attractiveness by Service Model, 2023 to 2033 Figure 47: North America Market Attractiveness by Deployment Model, 2023 to 2033 Figure 48: North America Market Attractiveness by Organization Size, 2023 to 2033 Figure 49: North America Market Attractiveness by Vertical, 2023 to 2033 Figure 50: North America Market Attractiveness by Country, 2023 to 2033 Figure 51: Latin America Market Value (US$ Million) by Service Model, 2023 to 2033 Figure 52: Latin America Market Value (US$ Million) by Deployment Model, 2023 to 2033 Figure 53: Latin America Market Value (US$ Million) by Organization Size, 2023 to 2033 Figure 54: Latin America Market Value (US$ Million) by Vertical, 2023 to 2033 Figure 55: Latin America Market Value (US$ Million) by Country, 2023 to 2033 Figure 56: Latin America Market Value (US$ Million) Analysis by Country, 2018 to 2033 Figure 57: Latin America Market Value Share (%) and BPS Analysis by Country, 2023 to 2033 Figure 58: Latin America Market Y-o-Y Growth (%) Projections by Country, 2023 to 2033 Figure 59: Latin America Market Value (US$ Million) Analysis by Service Model, 2018 to 2033 Figure 60: Latin America Market Value Share (%) and BPS Analysis by Service Model, 2023 to 2033 Figure 61: Latin America Market Y-o-Y Growth (%) Projections by Service Model, 2023 to 2033 Figure 62: Latin America Market Value (US$ Million) Analysis by Deployment Model, 2018 to 2033 Figure 63: Latin America Market Value Share (%) and BPS Analysis by Deployment Model, 2023 to 2033 Figure 64: Latin America Market Y-o-Y Growth (%) Projections by Deployment Model, 2023 to 2033 Figure 65: Latin America Market Value (US$ Million) Analysis by Organization Size, 2018 to 2033 Figure 66: Latin America Market Value Share (%) and BPS Analysis by Organization Size, 2023 to 2033 Figure 67: Latin America Market Y-o-Y Growth (%) Projections by Organization Size, 2023 to 2033 Figure 68: Latin America Market Value (US$ Million) Analysis by Vertical, 2018 to 2033 Figure 69: Latin America Market Value Share (%) and BPS Analysis by Vertical, 2023 to 2033 Figure 70: Latin America Market Y-o-Y Growth (%) Projections by Vertical, 2023 to 2033 Figure 71: Latin America Market Attractiveness by Service Model, 2023 to 2033 Figure 72: Latin America Market Attractiveness by Deployment Model, 2023 to 2033 Figure 73: Latin America Market Attractiveness by Organization Size, 2023 to 2033 Figure 74: Latin America Market Attractiveness by Vertical, 2023 to 2033 Figure 75: Latin America Market Attractiveness by Country, 2023 to 2033 Figure 76: Europe Market Value (US$ Million) by Service Model, 2023 to 2033 Figure 77: Europe Market Value (US$ Million) by Deployment Model, 2023 to 2033 Figure 78: Europe Market Value (US$ Million) by Organization Size, 2023 to 2033 Figure 79: Europe Market Value (US$ Million) by Vertical, 2023 to 2033 Figure 80: Europe Market Value (US$ Million) by Country, 2023 to 2033 Figure 81: Europe Market Value (US$ Million) Analysis by Country, 2018 to 2033 Figure 82: Europe Market Value Share (%) and BPS Analysis by Country, 2023 to 2033 Figure 83: Europe Market Y-o-Y Growth (%) Projections by Country, 2023 to 2033 Figure 84: Europe Market Value (US$ Million) Analysis by Service Model, 2018 to 2033 Figure 85: Europe Market Value Share (%) and BPS Analysis by Service Model, 2023 to 2033 Figure 86: Europe Market Y-o-Y Growth (%) Projections by Service Model, 2023 to 2033 Figure 87: Europe Market Value (US$ Million) Analysis by Deployment Model, 2018 to 2033 Figure 88: Europe Market Value Share (%) and BPS Analysis by Deployment Model, 2023 to 2033 Figure 89: Europe Market Y-o-Y Growth (%) Projections by Deployment Model, 2023 to 2033 Figure 90: Europe Market Value (US$ Million) Analysis by Organization Size, 2018 to 2033 Figure 91: Europe Market Value Share (%) and BPS Analysis by Organization Size, 2023 to 2033 Figure 92: Europe Market Y-o-Y Growth (%) Projections by Organization Size, 2023 to 2033 Figure 93: Europe Market Value (US$ Million) Analysis by Vertical, 2018 to 2033 Figure 94: Europe Market Value Share (%) and BPS Analysis by Vertical, 2023 to 2033 Figure 95: Europe Market Y-o-Y Growth (%) Projections by Vertical, 2023 to 2033 Figure 96: Europe Market Attractiveness by Service Model, 2023 to 2033 Figure 97: Europe Market Attractiveness by Deployment Model, 2023 to 2033 Figure 98: Europe Market Attractiveness by Organization Size, 2023 to 2033 Figure 99: Europe Market Attractiveness by Vertical, 2023 to 2033 Figure 100: Europe Market Attractiveness by Country, 2023 to 2033 Figure 101: South Asia Market Value (US$ Million) by Service Model, 2023 to 2033 Figure 102: South Asia Market Value (US$ Million) by Deployment Model, 2023 to 2033 Figure 103: South Asia Market Value (US$ Million) by Organization Size, 2023 to 2033 Figure 104: South Asia Market Value (US$ Million) by Vertical, 2023 to 2033 Figure 105: South Asia Market Value (US$ Million) by Country, 2023 to 2033 Figure 106: South Asia Market Value (US$ Million) Analysis by Country, 2018 to 2033 Figure 107: South Asia Market Value Share (%) and BPS Analysis by Country, 2023 to 2033 Figure 108: South Asia Market Y-o-Y Growth (%) Projections by Country, 2023 to 2033 Figure 109: South Asia Market Value (US$ Million) Analysis by Service Model, 2018 to 2033 Figure 110: South Asia Market Value Share (%) and BPS Analysis by Service Model, 2023 to 2033 Figure 111: South Asia Market Y-o-Y Growth (%) Projections by Service Model, 2023 to 2033 Figure 112: South Asia Market Value (US$ Million) Analysis by Deployment Model, 2018 to 2033 Figure 113: South Asia Market Value Share (%) and BPS Analysis by Deployment Model, 2023 to 2033 Figure 114: South Asia Market Y-o-Y Growth (%) Projections by Deployment Model, 2023 to 2033 Figure 115: South Asia Market Value (US$ Million) Analysis by Organization Size, 2018 to 2033 Figure 116: South Asia Market Value Share (%) and BPS Analysis by Organization Size, 2023 to 2033 Figure 117: South Asia Market Y-o-Y Growth (%) Projections by Organization Size, 2023 to 2033 Figure 118: South Asia Market Value (US$ Million) Analysis by Vertical, 2018 to 2033 Figure 119: South Asia Market Value Share (%) and BPS Analysis by Vertical, 2023 to 2033 Figure 120: South Asia Market Y-o-Y Growth (%) Projections by Vertical, 2023 to 2033 Figure 121: South Asia Market Attractiveness by Service Model, 2023 to 2033 Figure 122: South Asia Market Attractiveness by Deployment Model, 2023 to 2033 Figure 123: South Asia Market Attractiveness by Organization Size, 2023 to 2033 Figure 124: South Asia Market Attractiveness by Vertical, 2023 to 2033 Figure 125: South Asia Market Attractiveness by Country, 2023 to 2033 Figure 126: East Asia Market Value (US$ Million) by Service Model, 2023 to 2033 Figure 127: East Asia Market Value (US$ Million) by Deployment Model, 2023 to 2033 Figure 128: East Asia Market Value (US$ Million) by Organization Size, 2023 to 2033 Figure 129: East Asia Market Value (US$ Million) by Vertical, 2023 to 2033 Figure 130: East Asia Market Value (US$ Million) by Country, 2023 to 2033 Figure 131: East Asia Market Value (US$ Million) Analysis by Country, 2018 to 2033 Figure 132: East Asia Market Value Share (%) and BPS Analysis by Country, 2023 to 2033 Figure 133: East Asia Market Y-o-Y Growth (%) Projections by Country, 2023 to 2033 Figure 134: East Asia Market Value (US$ Million) Analysis by Service Model, 2018 to 2033 Figure 135: East Asia Market Value Share (%) and BPS Analysis by Service Model, 2023 to 2033 Figure 136: East Asia Market Y-o-Y Growth (%) Projections by Service Model, 2023 to 2033 Figure 137: East Asia Market Value (US$ Million) Analysis by Deployment Model, 2018 to 2033 Figure 138: East Asia Market Value Share (%) and BPS Analysis by Deployment Model, 2023 to 2033 Figure 139: East Asia Market Y-o-Y Growth (%) Projections by Deployment Model, 2023 to 2033 Figure 140: East Asia Market Value (US$ Million) Analysis by Organization Size, 2018 to 2033 Figure 141: East Asia Market Value Share (%) and BPS Analysis by Organization Size, 2023 to 2033 Figure 142: East Asia Market Y-o-Y Growth (%) Projections by Organization Size, 2023 to 2033 Figure 143: East Asia Market Value (US$ Million) Analysis by Vertical, 2018 to 2033 Figure 144: East Asia Market Value Share (%) and BPS Analysis by Vertical, 2023 to 2033 Figure 145: East Asia Market Y-o-Y Growth (%) Projections by Vertical, 2023 to 2033 Figure 146: East Asia Market Attractiveness by Service Model, 2023 to 2033 Figure 147: East Asia Market Attractiveness by Deployment Model, 2023 to 2033 Figure 148: East Asia Market Attractiveness by Organization Size, 2023 to 2033 Figure 149: East Asia Market Attractiveness by Vertical, 2023 to 2033 Figure 150: East Asia Market Attractiveness by Country, 2023 to 2033 Figure 151: Oceania Market Value (US$ Million) by Service Model, 2023 to 2033 Figure 152: Oceania Market Value (US$ Million) by Deployment Model, 2023 to 2033 Figure 153: Oceania Market Value (US$ Million) by Organization Size, 2023 to 2033 Figure 154: Oceania Market Value (US$ Million) by Vertical, 2023 to 2033 Figure 155: Oceania Market Value (US$ Million) by Country, 2023 to 2033 Figure 156: Oceania Market Value (US$ Million) Analysis by Country, 2018 to 2033 Figure 157: Oceania Market Value Share (%) and BPS Analysis by Country, 2023 to 2033 Figure 158: Oceania Market Y-o-Y Growth (%) Projections by Country, 2023 to 2033 Figure 159: Oceania Market Value (US$ Million) Analysis by Service Model, 2018 to 2033 Figure 160: Oceania Market Value Share (%) and BPS Analysis by Service Model, 2023 to 2033 Figure 161: Oceania Market Y-o-Y Growth (%) Projections by Service Model, 2023 to 2033 Figure 162: Oceania Market Value (US$ Million) Analysis by Deployment Model, 2018 to 2033 Figure 163: Oceania Market Value Share (%) and BPS Analysis by Deployment Model, 2023 to 2033 Figure 164: Oceania Market Y-o-Y Growth (%) Projections by Deployment Model, 2023 to 2033 Figure 165: Oceania Market Value (US$ Million) Analysis by Organization Size, 2018 to 2033 Figure 166: Oceania Market Value Share (%) and BPS Analysis by Organization Size, 2023 to 2033 Figure 167: Oceania Market Y-o-Y Growth (%) Projections by Organization Size, 2023 to 2033 Figure 168: Oceania Market Value (US$ Million) Analysis by Vertical, 2018 to 2033 Figure 169: Oceania Market Value Share (%) and BPS Analysis by Vertical, 2023 to 2033 Figure 170: Oceania Market Y-o-Y Growth (%) Projections by Vertical, 2023 to 2033 Figure 171: Oceania Market Attractiveness by Service Model, 2023 to 2033 Figure 172: Oceania Market Attractiveness by Deployment Model, 2023 to 2033 Figure 173: Oceania Market Attractiveness by Organization Size, 2023 to 2033 Figure 174: Oceania Market Attractiveness by Vertical, 2023 to 2033 Figure 175: Oceania Market Attractiveness by Country, 2023 to 2033 Figure 176: MEA Market Value (US$ Million) by Service Model, 2023 to 2033 Figure 177: MEA Market Value (US$ Million) by Deployment Model, 2023 to 2033 Figure 178: MEA Market Value (US$ Million) by Organization Size, 2023 to 2033 Figure 179: MEA Market Value (US$ Million) by Vertical, 2023 to 2033 Figure 180: MEA Market Value (US$ Million) by Country, 2023 to 2033 Figure 181: MEA Market Value (US$ Million) Analysis by Country, 2018 to 2033 Figure 182: MEA Market Value Share (%) and BPS Analysis by Country, 2023 to 2033 Figure 183: MEA Market Y-o-Y Growth (%) Projections by Country, 2023 to 2033 Figure 184: MEA Market Value (US$ Million) Analysis by Service Model, 2018 to 2033 Figure 185: MEA Market Value Share (%) and BPS Analysis by Service Model, 2023 to 2033 Figure 186: MEA Market Y-o-Y Growth (%) Projections by Service Model, 2023 to 2033 Figure 187: MEA Market Value (US$ Million) Analysis by Deployment Model, 2018 to 2033 Figure 188: MEA Market Value Share (%) and BPS Analysis by Deployment Model, 2023 to 2033 Figure 189: MEA Market Y-o-Y Growth (%) Projections by Deployment Model, 2023 to 2033 Figure 190: MEA Market Value (US$ Million) Analysis by Organization Size, 2018 to 2033 Figure 191: MEA Market Value Share (%) and BPS Analysis by Organization Size, 2023 to 2033 Figure 192: MEA Market Y-o-Y Growth (%) Projections by Organization Size, 2023 to 2033 Figure 193: MEA Market Value (US$ Million) Analysis by Vertical, 2018 to 2033 Figure 194: MEA Market Value Share (%) and BPS Analysis by Vertical, 2023 to 2033 Figure 195: MEA Market Y-o-Y Growth (%) Projections by Vertical, 2023 to 2033 Figure 196: MEA Market Attractiveness by Service Model, 2023 to 2033 Figure 197: MEA Market Attractiveness by Deployment Model, 2023 to 2033 Figure 198: MEA Market Attractiveness by Organization Size, 2023 to 2033 Figure 199: MEA Market Attractiveness by Vertical, 2023 to 2033 Figure 200: MEA Market Attractiveness by Country, 2023 to 2033
Recommendations
Explore Technology Insights
View Reports