Cloud Compliance Market Size and Share Forecast Outlook From 2024 to 2034

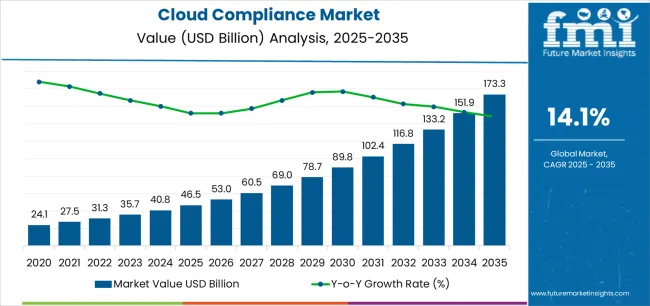
The global Cloud Compliance Market size is projected to reach USD 40.5 billion in 2024. It will likely exhibit a compound annual growth rate (CAGR) of 14.8% during the forecast period, totaling a massive valuation of USD 161.0 billion by 2034.

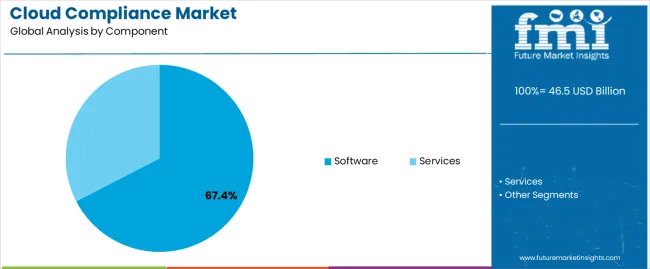
The software segment is expected to lead the global market during the forecast period. This is due to the growing adoption of cloud compliance software, particularly by small-sized businesses. The target segment is poised to grow at 14.6% CAGR through 2034.

Cloud compliance solutions, including software and services, are witnessing strong demand globally. This is because they help businesses ensure that their use of cloud computing services meets all applicable regulations and laws.

One of the key drivers of the cloud compliance market is the adoption of cloud computing and other novel technologies. Due to its multiple advantages, including cost-efficiency and flexibility, several organizations are adopting cloud services. This is expected to create a need for cloud compliance solutions.

Another prominent factor expected to fuel market growth is the presence of industry-specific compliance standards and regulations. For instance, financial institutions must adhere to regulations like the Payment Card Industry Data Security Standard (PCI DSS).

Healthcare organizations must comply with the Health Insurance Portability and Accountability Act (HIPAA). This will likely propel the demand for cloud compliance solutions as they help these organizations meet industry-specific requirements.

Cloud compliance solutions also offer continuous monitoring and real-time reporting capabilities. This is crucial for businesses to become aware of their compliance status and enable quick responses to incidents or deviations.

Kep players offer different cloud compliance solutions, including data loss prevention (DLP) and cloud access security broker (CASB) solutions. The growing popularity and adoption of these solutions will further boost the target market.

Attributes Key Insights
Estimated Cloud Compliance Market Value (2024E) USD 40.5 billion
Projected Cloud Compliance Market Revenue (2034F) USD 161.0 billion
Value CAGR (2024 to 2034) 14.8%

Key Growth Drivers for the Cloud Compliance Market

  • The growing importance of cloud compliance monitoring is expected to drive the demand for cloud compliance solutions.
  • Enforcement of stringent data protection regulations, such as the California Privacy Act (CCPA) and General Data Protection Regulation (GDPR), will likely boost the cloud compliance market growth through 2034. This is because these regulations necessitate businesses to use robust cloud compliance solutions to protect their customers' personal data.
  • Rising cyber security threats and data breach attempts are expected to create growth opportunities for cloud compliance solution vendors.
  • Growing security concerns due to cloud adoption are anticipated to encourage the usage of cloud compliance software and services.
  • Increasing government support for promoting the adoption of cloud services as part of broader digital transformation initiatives will likely foster market growth.
  • The growing complexity of compliance requirements is prompting industries to opt for cloud compliance services.
  • The ability of cloud compliance solutions to help businesses automate compliance tasks and reduce the risk of human error is set to elevate their demand through 2034.
  • The rising importance of web applications, coupled with the increasing penetration of IoT and other advanced technologies
  • The increasing need for cloud security and compliance tools in diverse industries will benefit the market.
  • Rising awareness about regulatory compliance in cloud computing is another factor expected to foster market growth.

Top Market Dynamics and Global Trends in Cloud Compliance

Growing Focus on Data Privacy is a Key Market-shaping Trend

  • Rising emphasis on privacy and ethical data practices
  • Increasing incorporation of compliance into DevOps processes, known as DevSecOps
  • Growing demand for compliance as a service (CaaS)
  • Introduction of advanced cloud compliance automation platforms
  • Rising focus of large enterprises to automate compliance
  • Surging adoption of multi-cloud and hybrid cloud architectures
  • Increasing adoption of automation and artificial intelligence (AI)
  • Collaboration between cloud service providers and compliance solutions vendors to offer integrated solutions

Sales Trend Analysis from Historical Performance Compared to Market Outlook for 2024 to 2034

Global demand for cloud compliance solutions grew at a CAGR of 18.6% from 2019 to 2023. Total market valuation at the end of 2023 reached around USD 34.4 billion. In the assessment period, the market for cloud compliance software and services is projected to advance at 14.8% CAGR.

The global cloud compliance market share has grown rapidly during the historical period. This was mostly due to factors like increased reliance on cloud services, work-from-home trends, and heightened data security concerns.

  • During the historical period, businesses heavily relied on cloud-based solutions for tasks like communication and file storage due to the work-from-home culture. This dependence on cloud services increased cyber threats, prompting organizations to use robust compliance measures.
  • Data security and privacy concerns also escalated as sensitive corporate data spread across home networks and personal devices. Cloud compliance tools offered features like access control, data encryption, and audit trails, ensuring data remained protected.
  • Other factors that boosted market growth were the global shift towards transformation and the high adoption of bring-your-own-device (BYOD) policies.

Over the forecast period, the global cloud compliance industry is projected to expand at a healthy CAGR, attaining a colossal valuation of USD 161.0 billion by 2034.

This growth will likely be fueled by factors like the rising number of cyberattacks and data breaches, the implementation of stringent data privacy regulations, and the growing adoption of advanced technologies like cloud computing.

Emerging Demand from SMEs Supporting Cloud Compliance Adoption

Amid rapid digital transformation and evolving landscape, small and medium-sized enterprises (SMEs) are increasingly adopting cloud computing. This is because it eliminates the need for investing in separate infrastructure.

SMEs, however, lack the resources and expertise to comply with complex data privacy regulations. This is creating demand for cloud compliance solutions specifically designed for small and medium-sized enterprises, thereby fostering market growth.

Semi-annual Market Update for the Cloud Compliance Industry

Particular Value CAGR
H1 14.5% (2023 to 2033)
H2 14.7% (2023 to 2033)
H1 15.3% (2024 to 2034)
H2 14.6% (2024 to 2034)

Analysis of Top Countries Implementing, Regulating, and Utilizing Cloud Compliance Solutions

The table below highlights the cloud compliance market revenue in top nations. The United States, China, and Japan are projected to remain the top three markets for cloud compliance solution providers, with expected valuations of USD 28.7 billion, USD 26.2 billion, and USD 18.1 billion, respectively, in 2034.

Countries Projected Cloud Compliance Market Value (2034)
United States USD 28.7 billion
China USD 26.2 billion
Japan USD 18.1 billion
South Korea USD 10.6 billion
United Kingdom USD 6.6 billion

The below table shows the estimated growth rates of the top countries. South Korea, Japan, and the United Kingdom are set to record high CAGRs of 17.0%, 16.0%, and 16.2%, respectively, through 2034.

Countries Expected Cloud Compliance Market CAGR (2024 to 2034)
United States 14.9%
China 15.5%
Japan 16.0%
South Korea 17.0%
United Kingdom 16.2%

Rising Cloud Adoption Driving Demand in the United States

As per the latest analysis, the United States cloud compliance market size is anticipated to reach USD 28.7 billion in 2034. It will continue to dominate the global market, with overall demand for cloud compliance software and services rising at a 14.9% CAGR throughout the forecast period. Some of the key drivers/trends include:

  • Increasing cloud adoption across the United States
  • Implementation of stringent regulations in data privacy and security, including the California Consumer Privacy Act (CCPA)
  • Rising incidence of cyberattacks
  • Growing need for automated solutions to manage compliance
  • Surging popularity of CNAPP solutions
  • Expansion of the compliance as a service (CaaS) market

The United States has been the leader in cloud adoption for the last ten years. Businesses in the nations are increasingly moving their operations to the cloud to benefit from cost-efficiency, flexibility, and scalability.

The rising adoption of cloud services is leading to a growing need for compliance solutions to ensure that data and processes comply with regulatory standards. This, in turn, will likely provide impetus for the growth of the cloud compliance market in the United States.

The United States is also witnessing increasing data breaches, making businesses more aware of the need to protect their data. This is expected to uplift demand for cloud compliance solutions, which help companies secure their data and comply with regulations.

Growing Data Privacy Concerns in China Boosting Cloud Compliance Market

China’s cloud compliance market is poised to exhibit an impressive CAGR of 15.5% during the assessment period. By 2034, the total market valuation in the country is projected to reach USD 26.2 billion, driven by factors like:

  • Increasing data privacy and security concerns
  • Growing popularity of cloud-based services
  • Presence of Cybersecurity and Personal Information Protection Laws that impose strict requirements on data protection and the management of critical information infrastructure
  • Growing emphasis on complying with cloud compliance frameworks

China-based businesses are becoming concerned about data security amid growing cyberattacks and data breaches and the presence of cloud compliance standards. This is creating demand for cloud compliance solutions, which help them protect their data and mitigate these risks.

Another key factor expected to improve China’s cloud compliance market share is the rising adoption of novel technologies, including artificial intelligence (AI) and cloud computing.

These technologies necessitate compliance solutions that can keep pace with changing regulatory requirements as well as technological advancements.

Enforcement of Strict Data Privacy Regulations in Japan Spurring Market Growth

Japan’s cloud compliance market is projected to thrive at a CAGR of 16.0% during the forecast period, totaling a valuation of USD 18.1 billion by the end of 2034. This is attributable to factors like:

  • Implementation of strict data privacy laws and regulations
  • Increasing government initiatives aimed at promoting digital transformation and cloud adoption across Japan
  • Growing need for cloud compliance tools in healthcare and financial industries
  • Rising popularity of remote work culture

Japan has enforced various strict data privacy regulations, including the Act on the Protection of Personal Information (APPI). These regulations necessitate businesses to employ strong data security measures, which will likely continue to drive demand for cloud compliance solutions.

There is also a growing preference for data residency in Japan. This is expected to create demand for cloud compliance solutions that facilitate local data storage and address data residency requirements in the country during the assessment period.

Cloud Compliance Industry Analysis by Top Investment Segments

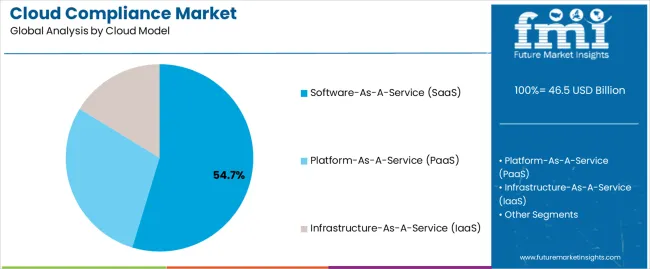
The section below offers profound insights into top segments and their respective growth rates for the assessment period. The software segment is set to grow at a robust CAGR of 14.6% during the forecast period. By the cloud model, the infrastructure-as-a-service (laaS) segment will likely thrive at 14.4% CAGR through 2034.

Demand Likely to Remain High for Cloud Compliance Software

Top Segment Software (Component)
Estimated CAGR (2024 to 2034) 14.6%

As per the latest analysis, cloud compliance software will likely remain highly popular among end users. The target segment is expected to grow at a healthy CAGR of 14.6% during the assessment period. This can be attributed to the multiple benefits of cloud compliance software.

Cloud compliance software is gaining wider popularity among businesses as it ensures regulatory standards and provides compliance controls for networks and infrastructure. It helps businesses enhance visibility over network flows and cloud workloads and protect against container threats, server malware, and network intrusion.

  • Cloud compliance software is ideal for businesses with limited budgets, prioritizing ease of use and scalability. It is generally cheaper than cloud compliance services, especially for smaller organizations.
  • Cloud compliance software's ability to adapt to different organization sizes and compliance complexities is also fueling its adoption globally.
  • Its cloud-based access allows remote collaborations and management from anywhere.
  • Compliance software can significantly improve efficiency and reduce human error risk, thereby encouraging its adoption among businesses. This is because it often automates repetitive tasks like data collection, reporting, and risk assessment.
  • Growing adoption of cloud compliance software, especially by smaller organizations with less complex compliance requirements, is expected to boost the cloud compliance software segment through 2034.
  • To capitalize on this trend, key players are launching new cloud compliance software that is user-friendly, with intuitive interfaces and automated workflow. This will allow organizations to implement and manage compliance tasks without requiring technical expertise.

High Level of Control and Flexibility Making laaS Model Popular

Top Segment Infrastructure-as-a-Service (laaS) (Cloud Model)
Estimated CAGR (2024 to 2034) 14.4%

Based on the cloud model, the infrastructure-as-a-service (laaS) segment is projected to record a CAGR of 14.4% during the forecast period. This is because IaaS offers several advantages when it comes to security, data privacy, and regulatory adherence.

Infrastructure-as-a-service (laaS) model provides a high level of control and flexibility for security measures and compliance with specific regulations. It allows access to infrastructure for deep-level security audits and customization, making it popular among businesses.
  • Industries with stringent data security or privacy regulations often find the IaaS model suitable. This is because it offers granular control over underlying infrastructure, thereby allowing businesses to tailor configurations to meet certain compliance mandates.
  • By providing on-demand resource scaling, IaaS enables organizations to adapt infrastructure to fluctuating compliance workloads without overprovisioning. Thus, it offers cost-efficiency and avoids unnecessary compliance risks related to unused resources.
  • The ability of IaaS to integrate with existing on-premises infrastructure is another factor behind its rising popularity. It facilitates a hybrid cloud approach to compliance.

Leading Suppliers in the Cloud Compliance Sector

Key cloud compliance solution providers are focusing on expanding their offerings by launching new solutions, including data loss prevention (DLP), cloud security posture management (CSPM), and cloud access security broker (CASB) solutions.

They also use strategies like mergers, partnerships, acquisitions, alliances, and collaborations to boost their revenue and expand their footprint.

Recent Developments in the Cloud Compliance Market

  • In November 2023, Wipro Limited introduced its Continuous Compliance Solution built on Amazon Security Lake. The new solution will equip enterprises with advanced capabilities to meet compliance requirements in a dynamic regulatory landscape.
  • In February 2023, Akamai Technologies, Inc. unveiled Akamai Connected Cloud, a massively distributed edge and cloud platform for security, cloud computing, and content delivery that keeps threats farther away and applications and experiences closer.
  • To enable customers to prevent breaches across multi-cloud and hybrid environments proactively, Microsoft launched new advanced multi-cloud posture management capabilities for GCP (Google Cloud Platform) in 2023.
  • In September 2023, to help clients protect data and assess risk across their hybrid, multi-cloud environments and workloads, IBM expanded the IBM Cloud Security and Compliance Center, a suite of advanced cloud security and compliance solutions.

Scope and Coverage of the Cloud Compliance Market Report

Attribute Details
Estimated Market Value (2024) USD 40.5 billion
Projected Market Value (2034) USD 161.0 billion
Anticipated Growth Rate (2024 to 2034) 14.8% CAGR
Forecast Period 2024 to 2034
Historical Data Available for 2019 to 2023
Market Analysis Value (USD billion) and CAGR for 2024 to 2034
Key Regions Covered Latin America; North America; Western Europe; Eastern Europe; South Asia and Pacific; East Asia; and Middle East & Africa
Key Countries Covered Canada, United States, Mexico, Brazil, Chile, Peru, Argentina, Germany, France, Italy, Spain, United Kingdom, Netherlands, Belgium, Nordic, Russia, Poland, China, Japan, South Korea, India, Thailand, Malaysia, Indonesia, Singapore, Australia, New Zealand, GCC Countries, South Africa, Central Africa, and others
Key Market Segments Covered Component, Cloud Model, Application, Organizational Size, Vertical, and Region
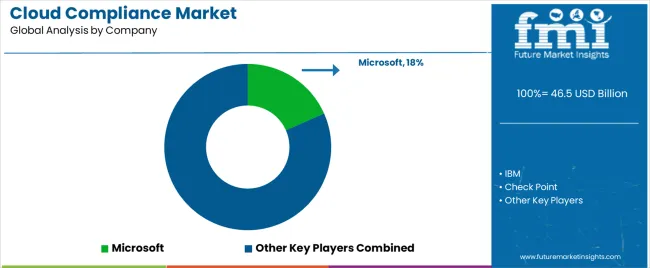
Key Companies Profiled Microsoft; IBM; Check Point; AT&T; Broadcom; Qualys; Nutanix; Sophos; Oracle; Palo Alto Networks

Top Segments Studied in the Cloud Compliance Market

By Component:

  • Software
    • Cloud Security Posture Management
    • Cloud Workload Protection Platform
    • Cloud Access Security Broker
    • Cloud Native Application Protection Platform
  • Services
    • Managed Services
    • Professional Services

By Cloud Model:

  • Infrastructure-as-a-Service (laaS)
  • Platform-as-a-Service (PaaS)
  • Software-as-a-Service (SaaS)

By Application:

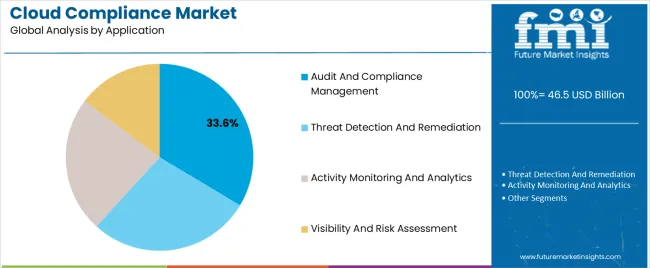
  • Audit and Compliance Management
  • Threat Detection and Remediation
  • Activity Monitoring and Analytics
  • Visibility and Risk Assessment

By Organizational Size:

  • Large Enterprises
  • Small and Medium Enterprises

By Vertical:

  • Banking, Financial Services, and Insurance (BFSI)
  • Government
  • Healthcare
  • IT and ITeS
  • Retail and E-commerce
  • Manufacturing
  • Utilities

By Region:

  • North America
  • Latin America
  • Europe
  • East Asia
  • South Asia
  • Oceania
  • Middle East and Africa

Table of Content

  • 1. Executive Summary
  • 2. Market Overview
  • 3. Market Background
  • 4. Global Market Analysis 2019 to 2023 and Forecast, 2024 to 2034
  • 5. Global Market Analysis 2019 to 2023 and Forecast 2024 to 2034, By Component
    • 5.1. Software
      • 5.1.1. Cloud Security Posture Management
      • 5.1.2. Cloud Workload Protection Platform
      • 5.1.3. Cloud Access Security Broker
      • 5.1.4. Cloud Native Application Protection Platform
    • 5.2. Services
      • 5.2.1. Managed Services
      • 5.2.2. Professional Services
  • 6. Global Market Analysis 2019 to 2023 and Forecast 2024 to 2034, By Cloud Model
    • 6.1. Infrastructure-as-a-Service (IaaS)
    • 6.2. Platform-as-a-Service (PaaS)
    • 6.3. Software-as-a-Service (SaaS)
  • 7. Global Market Analysis 2019 to 2023 and Forecast 2024 to 2034, By Application
    • 7.1. Audit and Compliance Management
    • 7.2. Threat Detection and Remediation
    • 7.3. Activity Monitoring and Analytics
    • 7.4. Visibility and Risk Assessment
  • 8. Global Market Analysis 2019 to 2023 and Forecast 2024 to 2034, By Organizational Size
    • 8.1. Large Enterprises
    • 8.2. Small and Medium Enterprises
  • 9. Global Market Analysis 2019 to 2023 and Forecast 2024 to 2034, By Vertical
    • 9.1. Banking, Financial Services and Insurance (BFSI)
    • 9.2. Government
    • 9.3. Healthcare
    • 9.4. IT and ITeS
    • 9.5. Retail and e-commerce
    • 9.6. Manufacturing
    • 9.7. Utilities
  • 10. Global Market Analysis 2019 to 2023 and Forecast 2024 to 2034, By Region
    • 10.1. North America
    • 10.2. Latin America
    • 10.3. Western Europe
    • 10.4. Eastern Europe
    • 10.5. South Asia and Pacific
    • 10.6. East Asia
    • 10.7. Middle East and Africa
  • 11. North America Market Analysis 2019 to 2023 and Forecast 2024 to 2034, By Country
  • 12. Latin America Market Analysis 2019 to 2023 and Forecast 2024 to 2034, By Country
  • 13. Western Europe Market Analysis 2019 to 2023 and Forecast 2024 to 2034, By Country
  • 14. Eastern Europe Market Analysis 2019 to 2023 and Forecast 2024 to 2034, By Country
  • 15. South Asia and Pacific Market Analysis 2019 to 2023 and Forecast 2024 to 2034, By Country
  • 16. East Asia Market Analysis 2019 to 2023 and Forecast 2024 to 2034, By Country
  • 17. Middle East and Africa Market Analysis 2019 to 2023 and Forecast 2024 to 2034, By Country
  • 18. Key Countries Market Analysis
  • 19. Market Structure Analysis
  • 20. Competition Analysis
    • 20.1. Microsoft
    • 20.2. IBM
    • 20.3. Check Point
    • 20.4. AT&T
    • 20.5. Broadcom
    • 20.6. Qualys
    • 20.7. Nutanix
    • 20.8. Sophos
    • 20.9. Oracle
    • 20.10. Palo Alto Networks
  • 21. Assumptions & Acronyms Used
  • 22. Research Methodology

List of Tables

Table 1: Global Market Value (US$ billion) Forecast by Region, 2019 to 2034

Table 2: Global Market Value (US$ billion) Forecast by Component, 2019 to 2034

Table 3: Global Market Value (US$ billion) Forecast by Cloud Model, 2019 to 2034

Table 4: Global Market Value (US$ billion) Forecast by Application, 2019 to 2034

Table 5: Global Market Value (US$ billion) Forecast by Organizational Size, 2019 to 2034

Table 6: Global Market Value (US$ billion) Forecast by Vertical, 2019 to 2034

Table 7: North America Market Value (US$ billion) Forecast by Country, 2019 to 2034

Table 8: North America Market Value (US$ billion) Forecast by Component, 2019 to 2034

Table 9: North America Market Value (US$ billion) Forecast by Cloud Model, 2019 to 2034

Table 10: North America Market Value (US$ billion) Forecast by Application, 2019 to 2034

Table 11: North America Market Value (US$ billion) Forecast by Organizational Size, 2019 to 2034

Table 12: North America Market Value (US$ billion) Forecast by Vertical, 2019 to 2034

Table 13: Latin America Market Value (US$ billion) Forecast by Country, 2019 to 2034

Table 14: Latin America Market Value (US$ billion) Forecast by Component, 2019 to 2034

Table 15: Latin America Market Value (US$ billion) Forecast by Cloud Model, 2019 to 2034

Table 16: Latin America Market Value (US$ billion) Forecast by Application, 2019 to 2034

Table 17: Latin America Market Value (US$ billion) Forecast by Organizational Size, 2019 to 2034

Table 18: Latin America Market Value (US$ billion) Forecast by Vertical, 2019 to 2034

Table 19: Western Europe Market Value (US$ billion) Forecast by Country, 2019 to 2034

Table 20: Western Europe Market Value (US$ billion) Forecast by Component, 2019 to 2034

Table 21: Western Europe Market Value (US$ billion) Forecast by Cloud Model, 2019 to 2034

Table 22: Western Europe Market Value (US$ billion) Forecast by Application, 2019 to 2034

Table 23: Western Europe Market Value (US$ billion) Forecast by Organizational Size, 2019 to 2034

Table 24: Western Europe Market Value (US$ billion) Forecast by Vertical, 2019 to 2034

Table 25: Eastern Europe Market Value (US$ billion) Forecast by Country, 2019 to 2034

Table 26: Eastern Europe Market Value (US$ billion) Forecast by Component, 2019 to 2034

Table 27: Eastern Europe Market Value (US$ billion) Forecast by Cloud Model, 2019 to 2034

Table 28: Eastern Europe Market Value (US$ billion) Forecast by Application, 2019 to 2034

Table 29: Eastern Europe Market Value (US$ billion) Forecast by Organizational Size, 2019 to 2034

Table 30: Eastern Europe Market Value (US$ billion) Forecast by Vertical, 2019 to 2034

Table 31: South Asia and Pacific Market Value (US$ billion) Forecast by Country, 2019 to 2034

Table 32: South Asia and Pacific Market Value (US$ billion) Forecast by Component, 2019 to 2034

Table 33: South Asia and Pacific Market Value (US$ billion) Forecast by Cloud Model, 2019 to 2034

Table 34: South Asia and Pacific Market Value (US$ billion) Forecast by Application, 2019 to 2034

Table 35: South Asia and Pacific Market Value (US$ billion) Forecast by Organizational Size, 2019 to 2034

Table 36: South Asia and Pacific Market Value (US$ billion) Forecast by Vertical, 2019 to 2034

Table 37: East Asia Market Value (US$ billion) Forecast by Country, 2019 to 2034

Table 38: East Asia Market Value (US$ billion) Forecast by Component, 2019 to 2034

Table 39: East Asia Market Value (US$ billion) Forecast by Cloud Model, 2019 to 2034

Table 40: East Asia Market Value (US$ billion) Forecast by Application, 2019 to 2034

Table 41: East Asia Market Value (US$ billion) Forecast by Organizational Size, 2019 to 2034

Table 42: East Asia Market Value (US$ billion) Forecast by Vertical, 2019 to 2034

Table 43: Middle East and Africa Market Value (US$ billion) Forecast by Country, 2019 to 2034

Table 44: Middle East and Africa Market Value (US$ billion) Forecast by Component, 2019 to 2034

Table 45: Middle East and Africa Market Value (US$ billion) Forecast by Cloud Model, 2019 to 2034

Table 46: Middle East and Africa Market Value (US$ billion) Forecast by Application, 2019 to 2034

Table 47: Middle East and Africa Market Value (US$ billion) Forecast by Organizational Size, 2019 to 2034

Table 48: Middle East and Africa Market Value (US$ billion) Forecast by Vertical, 2019 to 2034

List of Figures

Figure 1: Global Market Value (US$ billion) by Component, 2024 to 2034

Figure 2: Global Market Value (US$ billion) by Cloud Model, 2024 to 2034

Figure 3: Global Market Value (US$ billion) by Application, 2024 to 2034

Figure 4: Global Market Value (US$ billion) by Organizational Size, 2024 to 2034

Figure 5: Global Market Value (US$ billion) by Vertical, 2024 to 2034

Figure 6: Global Market Value (US$ billion) by Region, 2024 to 2034

Figure 7: Global Market Value (US$ billion) Analysis by Region, 2019 to 2034

Figure 8: Global Market Value Share (%) and BPS Analysis by Region, 2024 to 2034

Figure 9: Global Market Y-o-Y Growth (%) Projections by Region, 2024 to 2034

Figure 10: Global Market Value (US$ billion) Analysis by Component, 2019 to 2034

Figure 11: Global Market Value Share (%) and BPS Analysis by Component, 2024 to 2034

Figure 12: Global Market Y-o-Y Growth (%) Projections by Component, 2024 to 2034

Figure 13: Global Market Value (US$ billion) Analysis by Cloud Model, 2019 to 2034

Figure 14: Global Market Value Share (%) and BPS Analysis by Cloud Model, 2024 to 2034

Figure 15: Global Market Y-o-Y Growth (%) Projections by Cloud Model, 2024 to 2034

Figure 16: Global Market Value (US$ billion) Analysis by Application, 2019 to 2034

Figure 17: Global Market Value Share (%) and BPS Analysis by Application, 2024 to 2034

Figure 18: Global Market Y-o-Y Growth (%) Projections by Application, 2024 to 2034

Figure 19: Global Market Value (US$ billion) Analysis by Organizational Size, 2019 to 2034

Figure 20: Global Market Value Share (%) and BPS Analysis by Organizational Size, 2024 to 2034

Figure 21: Global Market Y-o-Y Growth (%) Projections by Organizational Size, 2024 to 2034

Figure 22: Global Market Value (US$ billion) Analysis by Vertical, 2019 to 2034

Figure 23: Global Market Value Share (%) and BPS Analysis by Vertical, 2024 to 2034

Figure 24: Global Market Y-o-Y Growth (%) Projections by Vertical, 2024 to 2034

Figure 25: Global Market Attractiveness by Component, 2024 to 2034

Figure 26: Global Market Attractiveness by Cloud Model, 2024 to 2034

Figure 27: Global Market Attractiveness by Application, 2024 to 2034

Figure 28: Global Market Attractiveness by Organizational Size, 2024 to 2034

Figure 29: Global Market Attractiveness by Vertical, 2024 to 2034

Figure 30: Global Market Attractiveness by Region, 2024 to 2034

Figure 31: North America Market Value (US$ billion) by Component, 2024 to 2034

Figure 32: North America Market Value (US$ billion) by Cloud Model, 2024 to 2034

Figure 33: North America Market Value (US$ billion) by Application, 2024 to 2034

Figure 34: North America Market Value (US$ billion) by Organizational Size, 2024 to 2034

Figure 35: North America Market Value (US$ billion) by Vertical, 2024 to 2034

Figure 36: North America Market Value (US$ billion) by Country, 2024 to 2034

Figure 37: North America Market Value (US$ billion) Analysis by Country, 2019 to 2034

Figure 38: North America Market Value Share (%) and BPS Analysis by Country, 2024 to 2034

Figure 39: North America Market Y-o-Y Growth (%) Projections by Country, 2024 to 2034

Figure 40: North America Market Value (US$ billion) Analysis by Component, 2019 to 2034

Figure 41: North America Market Value Share (%) and BPS Analysis by Component, 2024 to 2034

Figure 42: North America Market Y-o-Y Growth (%) Projections by Component, 2024 to 2034

Figure 43: North America Market Value (US$ billion) Analysis by Cloud Model, 2019 to 2034

Figure 44: North America Market Value Share (%) and BPS Analysis by Cloud Model, 2024 to 2034

Figure 45: North America Market Y-o-Y Growth (%) Projections by Cloud Model, 2024 to 2034

Figure 46: North America Market Value (US$ billion) Analysis by Application, 2019 to 2034

Figure 47: North America Market Value Share (%) and BPS Analysis by Application, 2024 to 2034

Figure 48: North America Market Y-o-Y Growth (%) Projections by Application, 2024 to 2034

Figure 49: North America Market Value (US$ billion) Analysis by Organizational Size, 2019 to 2034

Figure 50: North America Market Value Share (%) and BPS Analysis by Organizational Size, 2024 to 2034

Figure 51: North America Market Y-o-Y Growth (%) Projections by Organizational Size, 2024 to 2034

Figure 52: North America Market Value (US$ billion) Analysis by Vertical, 2019 to 2034

Figure 53: North America Market Value Share (%) and BPS Analysis by Vertical, 2024 to 2034

Figure 54: North America Market Y-o-Y Growth (%) Projections by Vertical, 2024 to 2034

Figure 55: North America Market Attractiveness by Component, 2024 to 2034

Figure 56: North America Market Attractiveness by Cloud Model, 2024 to 2034

Figure 57: North America Market Attractiveness by Application, 2024 to 2034

Figure 58: North America Market Attractiveness by Organizational Size, 2024 to 2034

Figure 59: North America Market Attractiveness by Vertical, 2024 to 2034

Figure 60: North America Market Attractiveness by Country, 2024 to 2034

Figure 61: Latin America Market Value (US$ billion) by Component, 2024 to 2034

Figure 62: Latin America Market Value (US$ billion) by Cloud Model, 2024 to 2034

Figure 63: Latin America Market Value (US$ billion) by Application, 2024 to 2034

Figure 64: Latin America Market Value (US$ billion) by Organizational Size, 2024 to 2034

Figure 65: Latin America Market Value (US$ billion) by Vertical, 2024 to 2034

Figure 66: Latin America Market Value (US$ billion) by Country, 2024 to 2034

Figure 67: Latin America Market Value (US$ billion) Analysis by Country, 2019 to 2034

Figure 68: Latin America Market Value Share (%) and BPS Analysis by Country, 2024 to 2034

Figure 69: Latin America Market Y-o-Y Growth (%) Projections by Country, 2024 to 2034

Figure 70: Latin America Market Value (US$ billion) Analysis by Component, 2019 to 2034

Figure 71: Latin America Market Value Share (%) and BPS Analysis by Component, 2024 to 2034

Figure 72: Latin America Market Y-o-Y Growth (%) Projections by Component, 2024 to 2034

Figure 73: Latin America Market Value (US$ billion) Analysis by Cloud Model, 2019 to 2034

Figure 74: Latin America Market Value Share (%) and BPS Analysis by Cloud Model, 2024 to 2034

Figure 75: Latin America Market Y-o-Y Growth (%) Projections by Cloud Model, 2024 to 2034

Figure 76: Latin America Market Value (US$ billion) Analysis by Application, 2019 to 2034

Figure 77: Latin America Market Value Share (%) and BPS Analysis by Application, 2024 to 2034

Figure 78: Latin America Market Y-o-Y Growth (%) Projections by Application, 2024 to 2034

Figure 79: Latin America Market Value (US$ billion) Analysis by Organizational Size, 2019 to 2034

Figure 80: Latin America Market Value Share (%) and BPS Analysis by Organizational Size, 2024 to 2034

Figure 81: Latin America Market Y-o-Y Growth (%) Projections by Organizational Size, 2024 to 2034

Figure 82: Latin America Market Value (US$ billion) Analysis by Vertical, 2019 to 2034

Figure 83: Latin America Market Value Share (%) and BPS Analysis by Vertical, 2024 to 2034

Figure 84: Latin America Market Y-o-Y Growth (%) Projections by Vertical, 2024 to 2034

Figure 85: Latin America Market Attractiveness by Component, 2024 to 2034

Figure 86: Latin America Market Attractiveness by Cloud Model, 2024 to 2034

Figure 87: Latin America Market Attractiveness by Application, 2024 to 2034

Figure 88: Latin America Market Attractiveness by Organizational Size, 2024 to 2034

Figure 89: Latin America Market Attractiveness by Vertical, 2024 to 2034

Figure 90: Latin America Market Attractiveness by Country, 2024 to 2034

Figure 91: Western Europe Market Value (US$ billion) by Component, 2024 to 2034

Figure 92: Western Europe Market Value (US$ billion) by Cloud Model, 2024 to 2034

Figure 93: Western Europe Market Value (US$ billion) by Application, 2024 to 2034

Figure 94: Western Europe Market Value (US$ billion) by Organizational Size, 2024 to 2034

Figure 95: Western Europe Market Value (US$ billion) by Vertical, 2024 to 2034

Figure 96: Western Europe Market Value (US$ billion) by Country, 2024 to 2034

Figure 97: Western Europe Market Value (US$ billion) Analysis by Country, 2019 to 2034

Figure 98: Western Europe Market Value Share (%) and BPS Analysis by Country, 2024 to 2034

Figure 99: Western Europe Market Y-o-Y Growth (%) Projections by Country, 2024 to 2034

Figure 100: Western Europe Market Value (US$ billion) Analysis by Component, 2019 to 2034

Figure 101: Western Europe Market Value Share (%) and BPS Analysis by Component, 2024 to 2034

Figure 102: Western Europe Market Y-o-Y Growth (%) Projections by Component, 2024 to 2034

Figure 103: Western Europe Market Value (US$ billion) Analysis by Cloud Model, 2019 to 2034

Figure 104: Western Europe Market Value Share (%) and BPS Analysis by Cloud Model, 2024 to 2034

Figure 105: Western Europe Market Y-o-Y Growth (%) Projections by Cloud Model, 2024 to 2034

Figure 106: Western Europe Market Value (US$ billion) Analysis by Application, 2019 to 2034

Figure 107: Western Europe Market Value Share (%) and BPS Analysis by Application, 2024 to 2034

Figure 108: Western Europe Market Y-o-Y Growth (%) Projections by Application, 2024 to 2034

Figure 109: Western Europe Market Value (US$ billion) Analysis by Organizational Size, 2019 to 2034

Figure 110: Western Europe Market Value Share (%) and BPS Analysis by Organizational Size, 2024 to 2034

Figure 111: Western Europe Market Y-o-Y Growth (%) Projections by Organizational Size, 2024 to 2034

Figure 112: Western Europe Market Value (US$ billion) Analysis by Vertical, 2019 to 2034

Figure 113: Western Europe Market Value Share (%) and BPS Analysis by Vertical, 2024 to 2034

Figure 114: Western Europe Market Y-o-Y Growth (%) Projections by Vertical, 2024 to 2034

Figure 115: Western Europe Market Attractiveness by Component, 2024 to 2034

Figure 116: Western Europe Market Attractiveness by Cloud Model, 2024 to 2034

Figure 117: Western Europe Market Attractiveness by Application, 2024 to 2034

Figure 118: Western Europe Market Attractiveness by Organizational Size, 2024 to 2034

Figure 119: Western Europe Market Attractiveness by Vertical, 2024 to 2034

Figure 120: Western Europe Market Attractiveness by Country, 2024 to 2034

Figure 121: Eastern Europe Market Value (US$ billion) by Component, 2024 to 2034

Figure 122: Eastern Europe Market Value (US$ billion) by Cloud Model, 2024 to 2034

Figure 123: Eastern Europe Market Value (US$ billion) by Application, 2024 to 2034

Figure 124: Eastern Europe Market Value (US$ billion) by Organizational Size, 2024 to 2034

Figure 125: Eastern Europe Market Value (US$ billion) by Vertical, 2024 to 2034

Figure 126: Eastern Europe Market Value (US$ billion) by Country, 2024 to 2034

Figure 127: Eastern Europe Market Value (US$ billion) Analysis by Country, 2019 to 2034

Figure 128: Eastern Europe Market Value Share (%) and BPS Analysis by Country, 2024 to 2034

Figure 129: Eastern Europe Market Y-o-Y Growth (%) Projections by Country, 2024 to 2034

Figure 130: Eastern Europe Market Value (US$ billion) Analysis by Component, 2019 to 2034

Figure 131: Eastern Europe Market Value Share (%) and BPS Analysis by Component, 2024 to 2034

Figure 132: Eastern Europe Market Y-o-Y Growth (%) Projections by Component, 2024 to 2034

Figure 133: Eastern Europe Market Value (US$ billion) Analysis by Cloud Model, 2019 to 2034

Figure 134: Eastern Europe Market Value Share (%) and BPS Analysis by Cloud Model, 2024 to 2034

Figure 135: Eastern Europe Market Y-o-Y Growth (%) Projections by Cloud Model, 2024 to 2034

Figure 136: Eastern Europe Market Value (US$ billion) Analysis by Application, 2019 to 2034

Figure 137: Eastern Europe Market Value Share (%) and BPS Analysis by Application, 2024 to 2034

Figure 138: Eastern Europe Market Y-o-Y Growth (%) Projections by Application, 2024 to 2034

Figure 139: Eastern Europe Market Value (US$ billion) Analysis by Organizational Size, 2019 to 2034

Figure 140: Eastern Europe Market Value Share (%) and BPS Analysis by Organizational Size, 2024 to 2034

Figure 141: Eastern Europe Market Y-o-Y Growth (%) Projections by Organizational Size, 2024 to 2034

Figure 142: Eastern Europe Market Value (US$ billion) Analysis by Vertical, 2019 to 2034

Figure 143: Eastern Europe Market Value Share (%) and BPS Analysis by Vertical, 2024 to 2034

Figure 144: Eastern Europe Market Y-o-Y Growth (%) Projections by Vertical, 2024 to 2034

Figure 145: Eastern Europe Market Attractiveness by Component, 2024 to 2034

Figure 146: Eastern Europe Market Attractiveness by Cloud Model, 2024 to 2034

Figure 147: Eastern Europe Market Attractiveness by Application, 2024 to 2034

Figure 148: Eastern Europe Market Attractiveness by Organizational Size, 2024 to 2034

Figure 149: Eastern Europe Market Attractiveness by Vertical, 2024 to 2034

Figure 150: Eastern Europe Market Attractiveness by Country, 2024 to 2034

Figure 151: South Asia and Pacific Market Value (US$ billion) by Component, 2024 to 2034

Figure 152: South Asia and Pacific Market Value (US$ billion) by Cloud Model, 2024 to 2034

Figure 153: South Asia and Pacific Market Value (US$ billion) by Application, 2024 to 2034

Figure 154: South Asia and Pacific Market Value (US$ billion) by Organizational Size, 2024 to 2034

Figure 155: South Asia and Pacific Market Value (US$ billion) by Vertical, 2024 to 2034

Figure 156: South Asia and Pacific Market Value (US$ billion) by Country, 2024 to 2034

Figure 157: South Asia and Pacific Market Value (US$ billion) Analysis by Country, 2019 to 2034

Figure 158: South Asia and Pacific Market Value Share (%) and BPS Analysis by Country, 2024 to 2034

Figure 159: South Asia and Pacific Market Y-o-Y Growth (%) Projections by Country, 2024 to 2034

Figure 160: South Asia and Pacific Market Value (US$ billion) Analysis by Component, 2019 to 2034

Figure 161: South Asia and Pacific Market Value Share (%) and BPS Analysis by Component, 2024 to 2034

Figure 162: South Asia and Pacific Market Y-o-Y Growth (%) Projections by Component, 2024 to 2034

Figure 163: South Asia and Pacific Market Value (US$ billion) Analysis by Cloud Model, 2019 to 2034

Figure 164: South Asia and Pacific Market Value Share (%) and BPS Analysis by Cloud Model, 2024 to 2034

Figure 165: South Asia and Pacific Market Y-o-Y Growth (%) Projections by Cloud Model, 2024 to 2034

Figure 166: South Asia and Pacific Market Value (US$ billion) Analysis by Application, 2019 to 2034

Figure 167: South Asia and Pacific Market Value Share (%) and BPS Analysis by Application, 2024 to 2034

Figure 168: South Asia and Pacific Market Y-o-Y Growth (%) Projections by Application, 2024 to 2034

Figure 169: South Asia and Pacific Market Value (US$ billion) Analysis by Organizational Size, 2019 to 2034

Figure 170: South Asia and Pacific Market Value Share (%) and BPS Analysis by Organizational Size, 2024 to 2034

Figure 171: South Asia and Pacific Market Y-o-Y Growth (%) Projections by Organizational Size, 2024 to 2034

Figure 172: South Asia and Pacific Market Value (US$ billion) Analysis by Vertical, 2019 to 2034

Figure 173: South Asia and Pacific Market Value Share (%) and BPS Analysis by Vertical, 2024 to 2034

Figure 174: South Asia and Pacific Market Y-o-Y Growth (%) Projections by Vertical, 2024 to 2034

Figure 175: South Asia and Pacific Market Attractiveness by Component, 2024 to 2034

Figure 176: South Asia and Pacific Market Attractiveness by Cloud Model, 2024 to 2034

Figure 177: South Asia and Pacific Market Attractiveness by Application, 2024 to 2034

Figure 178: South Asia and Pacific Market Attractiveness by Organizational Size, 2024 to 2034

Figure 179: South Asia and Pacific Market Attractiveness by Vertical, 2024 to 2034

Figure 180: South Asia and Pacific Market Attractiveness by Country, 2024 to 2034

Figure 181: East Asia Market Value (US$ billion) by Component, 2024 to 2034

Figure 182: East Asia Market Value (US$ billion) by Cloud Model, 2024 to 2034

Figure 183: East Asia Market Value (US$ billion) by Application, 2024 to 2034

Figure 184: East Asia Market Value (US$ billion) by Organizational Size, 2024 to 2034

Figure 185: East Asia Market Value (US$ billion) by Vertical, 2024 to 2034

Figure 186: East Asia Market Value (US$ billion) by Country, 2024 to 2034

Figure 187: East Asia Market Value (US$ billion) Analysis by Country, 2019 to 2034

Figure 188: East Asia Market Value Share (%) and BPS Analysis by Country, 2024 to 2034

Figure 189: East Asia Market Y-o-Y Growth (%) Projections by Country, 2024 to 2034

Figure 190: East Asia Market Value (US$ billion) Analysis by Component, 2019 to 2034

Figure 191: East Asia Market Value Share (%) and BPS Analysis by Component, 2024 to 2034

Figure 192: East Asia Market Y-o-Y Growth (%) Projections by Component, 2024 to 2034

Figure 193: East Asia Market Value (US$ billion) Analysis by Cloud Model, 2019 to 2034

Figure 194: East Asia Market Value Share (%) and BPS Analysis by Cloud Model, 2024 to 2034

Figure 195: East Asia Market Y-o-Y Growth (%) Projections by Cloud Model, 2024 to 2034

Figure 196: East Asia Market Value (US$ billion) Analysis by Application, 2019 to 2034

Figure 197: East Asia Market Value Share (%) and BPS Analysis by Application, 2024 to 2034

Figure 198: East Asia Market Y-o-Y Growth (%) Projections by Application, 2024 to 2034

Figure 199: East Asia Market Value (US$ billion) Analysis by Organizational Size, 2019 to 2034

Figure 200: East Asia Market Value Share (%) and BPS Analysis by Organizational Size, 2024 to 2034

Figure 201: East Asia Market Y-o-Y Growth (%) Projections by Organizational Size, 2024 to 2034

Figure 202: East Asia Market Value (US$ billion) Analysis by Vertical, 2019 to 2034

Figure 203: East Asia Market Value Share (%) and BPS Analysis by Vertical, 2024 to 2034

Figure 204: East Asia Market Y-o-Y Growth (%) Projections by Vertical, 2024 to 2034

Figure 205: East Asia Market Attractiveness by Component, 2024 to 2034

Figure 206: East Asia Market Attractiveness by Cloud Model, 2024 to 2034

Figure 207: East Asia Market Attractiveness by Application, 2024 to 2034

Figure 208: East Asia Market Attractiveness by Organizational Size, 2024 to 2034

Figure 209: East Asia Market Attractiveness by Vertical, 2024 to 2034

Figure 210: East Asia Market Attractiveness by Country, 2024 to 2034

Figure 211: Middle East and Africa Market Value (US$ billion) by Component, 2024 to 2034

Figure 212: Middle East and Africa Market Value (US$ billion) by Cloud Model, 2024 to 2034

Figure 213: Middle East and Africa Market Value (US$ billion) by Application, 2024 to 2034

Figure 214: Middle East and Africa Market Value (US$ billion) by Organizational Size, 2024 to 2034

Figure 215: Middle East and Africa Market Value (US$ billion) by Vertical, 2024 to 2034

Figure 216: Middle East and Africa Market Value (US$ billion) by Country, 2024 to 2034

Figure 217: Middle East and Africa Market Value (US$ billion) Analysis by Country, 2019 to 2034

Figure 218: Middle East and Africa Market Value Share (%) and BPS Analysis by Country, 2024 to 2034

Figure 219: Middle East and Africa Market Y-o-Y Growth (%) Projections by Country, 2024 to 2034

Figure 220: Middle East and Africa Market Value (US$ billion) Analysis by Component, 2019 to 2034

Figure 221: Middle East and Africa Market Value Share (%) and BPS Analysis by Component, 2024 to 2034

Figure 222: Middle East and Africa Market Y-o-Y Growth (%) Projections by Component, 2024 to 2034

Figure 223: Middle East and Africa Market Value (US$ billion) Analysis by Cloud Model, 2019 to 2034

Figure 224: Middle East and Africa Market Value Share (%) and BPS Analysis by Cloud Model, 2024 to 2034

Figure 225: Middle East and Africa Market Y-o-Y Growth (%) Projections by Cloud Model, 2024 to 2034

Figure 226: Middle East and Africa Market Value (US$ billion) Analysis by Application, 2019 to 2034

Figure 227: Middle East and Africa Market Value Share (%) and BPS Analysis by Application, 2024 to 2034

Figure 228: Middle East and Africa Market Y-o-Y Growth (%) Projections by Application, 2024 to 2034

Figure 229: Middle East and Africa Market Value (US$ billion) Analysis by Organizational Size, 2019 to 2034

Figure 230: Middle East and Africa Market Value Share (%) and BPS Analysis by Organizational Size, 2024 to 2034

Figure 231: Middle East and Africa Market Y-o-Y Growth (%) Projections by Organizational Size, 2024 to 2034

Figure 232: Middle East and Africa Market Value (US$ billion) Analysis by Vertical, 2019 to 2034

Figure 233: Middle East and Africa Market Value Share (%) and BPS Analysis by Vertical, 2024 to 2034

Figure 234: Middle East and Africa Market Y-o-Y Growth (%) Projections by Vertical, 2024 to 2034

Figure 235: Middle East and Africa Market Attractiveness by Component, 2024 to 2034

Figure 236: Middle East and Africa Market Attractiveness by Cloud Model, 2024 to 2034

Figure 237: Middle East and Africa Market Attractiveness by Application, 2024 to 2034

Figure 238: Middle East and Africa Market Attractiveness by Organizational Size, 2024 to 2034

Figure 239: Middle East and Africa Market Attractiveness by Vertical, 2024 to 2034

Figure 240: Middle East and Africa Market Attractiveness by Country, 2024 to 2034

Frequently Asked Questions

How big is the cloud compliance market?

The global cloud compliance market value is expected to total USD 40.5 billion in 2024.

What is the demand outlook for cloud compliance solutions?

Cloud compliance demand is set to grow at 14.8% CAGR through 2034.

What is the expected market size for 2034?

The cloud compliance market size is projected to reach USD 161.0 billion by 2034.

What was the historical CAGR for the industry?

The cloud compliance industry expanded with a CAGR of 18.6% from 2019 to 2023.

How big is the United States cloud compliance market?

The United States market is projected to be valued at USD 28.7 billion in 2034.

Which component segment is expected to lead the market?

Thriving at 14.6% CAGR, the software segment is set to lead the market.

Explore Similar Insights

Future Market Insights

Cloud Compliance Market