Cloud Access Security Brokers Market
Market Insights on Cloud Access Security Brokers covering sales outlook, demand forecast & up-to-date key trends
Cloud Access Security Brokers Market By Cloud Deployment Type (Software as a service, Platform as a Service, Infrastructure as a Service), Software Type (On-premise Software), Services (Consulting, System Integration, Operation & maintenance), Services (Consulting, System Integration, Operation & maintenance) & Region - Forecast 2022 - 2032
Cloud Access Security Brokers Market Outlook (2022-2032)
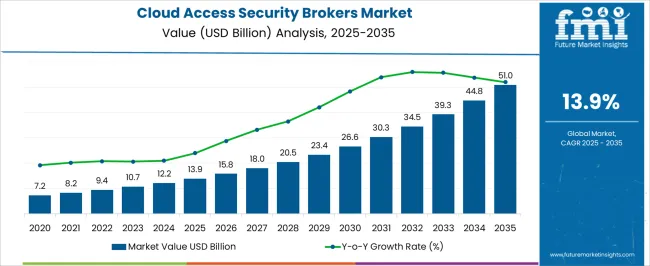
[324 Pages Report] The cloud access security brokers market is likely to expand its roots in the global market at a promising CAGR of 13.9% between 2022 and 2032.
The market is valued at US$ 9.4 bn in 2022 and is likely to reach US$ 34.4 Bn by 2032. Previously, the market was booming at a higher CAGR of 15.4% (2016-2021), resulting in market size of US$ 8 Bn in 2021.
“Concerns related to cloud-based applications and programs and their safety and security; the adoption of cloud access security brokers are rapidly increasing. Corporate enterprises are implementing these brokers system in their spaces to ensure data security.”
As the need for better safeguarding of the data and important information related to the accounts, recruitments, or any other documentation rises, the demand for cloud access security brokers also rises. Vendors ensuring to provide security services related to the latest threats are improving the market dynamics, allowing new players to experiment with the platform.
Attributes |
Details |
Cloud Access Security Brokers Market CAGR (2022-2032) |
13.9% |
Cloud Access Security Brokers Market Value (2022) |
US$ 9.4 Bn |
Cloud Access Security Brokers Market Value (2032) |
US 34.4 Bn |
Let us know your requirement to get
100% FREE customization
What is the COVID-19 Impact on the Cloud Access Security Brokers Market?
Covid-19 has impacted multiple global markets by rearranging the supply chains because of the market restrictions and logistics bans introduced by governments around the world. Yet there were some markets that had only a slight impact from the pandemic.
The cloud access security brokers market is one of those markets that expanded, especially in the period of covid-19. The covid-19 pushed the governments to shut the office spaces, enabling the work from the home procedure for employees. This helped in the growth of demand for cloud access security brokers that help companies keep their data safe and decrease the chances of risks and fraud.
The covid-19 and work from home procedures followed by small- and large-scale companies help these spaces in monitoring their data, securing it into auto optimized safe storage.
What are the Key Drivers and Restraints for Growth of the Cloud Access Security Brokers Market?
“With the growth of digitization of corporate spaces and integrating technology coming through, the use of cloud access security brokers solutions has also increased in the last decade, enabling security platforms to integrate with the latest technology.”
The major driver behind the growth of the market is the increasing need for cloud access security brokers in small and medium-sized businesses. Small startups that don’t have cloud storage support take the help of third-party cloud support systems.
These companies hold data related to HR and critical data related to the accounts of their employees. Small and medium-sized enterprises lack the capital and structural strength to implement cloud storage and ensure that level of security.
Rising data breaches all around the world are also pushing corporations to safeguard their data by using tools like cloud access security broker solutions, ensuring multilayered security that doesn’t let any ransomware affect the data. It also helps in recognizing any suspicious activity happening within the data sources, providing real-time monitoring to the end users, and increasing the risk and fraud management level.
The availability of real-time data monitoring makes the end user aware of the data processing and dimensions of multiple funnels, including sales and marketing. This gives a proportional idea to the end user that can be used in the predictive decision marking.
Integrating the cloud access security brokers solution to the latest technology like artificial intelligence Internet of things (IoT) pushes the market upward, securing the data from any type of threat. Better segmentation of critical and complex data provides a balanced outlook to the end user that can be utilized in data dashboards and analytical planning.
Overall, cloud access security broker solutions are an easily manageable, customized security solution that provides inward and outward safety to the data, which ensures that the stored information is secure when any malicious activity occurs.
The major restraint of the cloud access security broker market is the lack of awareness amongst corporate spaces as they still use old-fashioned security solutions.
Organizations are not aware of the advantages and efficiency of cloud access security broker solutions. Another factor that restricts the growth of the market is less awareness of threat management, compliance management and data monitoring.
Find your sweet spots for generating winning opportunities in this market.
Talk to AnalystComparative View of Adjacent Cloud Access Security Brokers Market
Cloud access security brokers Market:
Attributes |
Cloud access security brokers Market |
CAGR (2022 - 2032) |
13.9% |
Market Value (2026) |
US$ 15.82 Bn |
Growth Factor |
Increasing need for risk and fraud management regarding data and information is driving the market. |
Opportunity |
Enabling the opportunities for new additional platform industries such as cloud data security and management. |
Key Trends |
Increased use of cloud access security brokers in small and medium businesses due to the cost effectiveness. |
Multi-Cloud Management Market:
Attributes |
Multi-Cloud Management Market |
CAGR (2022 - 2032) |
26% |
Market Value (2026) |
US$ 20.41 Bn |
Growth Factor |
Enterprises are aggressively choosing multi-clou management solutions that offer low price, efficient operations and optimum security. |
Opportunity |
Covid-19 has increased the opportunities related to the data and information management, which ensures the flexibility in data deployment. |
Key Trends |
Artificial Intelligence and machine learning integrating with multi-cloud management, ensuring optimum operational capability. |
Cloud Security Market:
Attributes |
Cloud Security Market |
CAGR (2022 - 2032) |
13.5% |
Market Value (2026) |
US$ 77.5 Bn |
Growth Factor |
The growth is owed to technological advancement and developments that help in managing the data storage of corporates. |
Opportunity |
The rising cyber-attacks on cloud systems and cloud compliances are creating opportunities for the cloud security market. |
Key Trends |
SaaS segment is likely to hold the largest portion as it helps in dealing with advanced threats and malware attacks. |
The latest trends explained through FMI’s report on the cloud access security brokers market are the integration of these solutions with the latest technology available such as artificial intelligence, internet of things (IoT) and machine learning that is likely to benefit the market in the forecast period.
These latest technologies also help the vendor industries by opening up the doors for innovation and experiments in the security sector as new threats develop every other day, the need to adopt new end to end encryption security solutions.
These latest trends make cloud access security brokers solutions a one-stop-shop for compliance management, threat management and data monitoring. With the help of predictive decision making through machine learning, it gives a perspective outlook to the end users.
What is the Segmentation Outlook for the Cloud Access Security Brokers Market?
Cloud access security holds different categories; cloud deployment type, software type and services. These categories have small segments that expand their roots in new regions, connecting the distribution channels to enhance the supply chains.
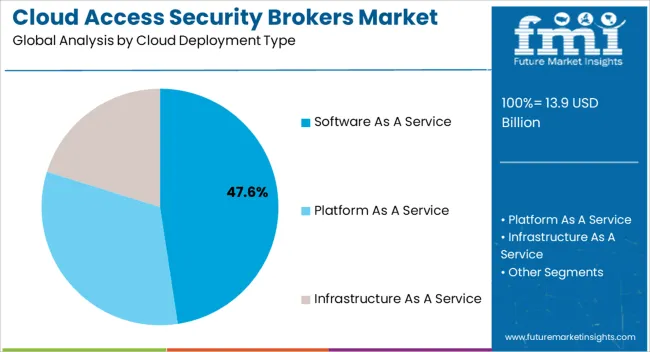
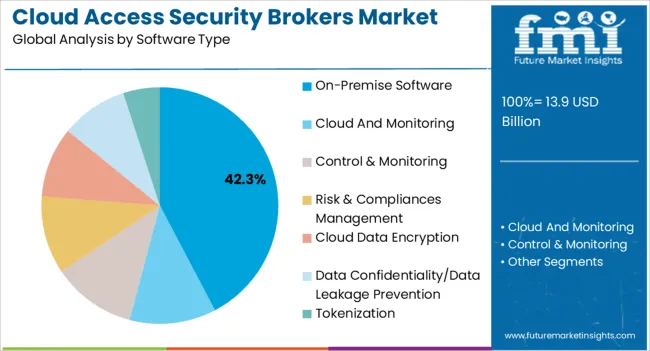
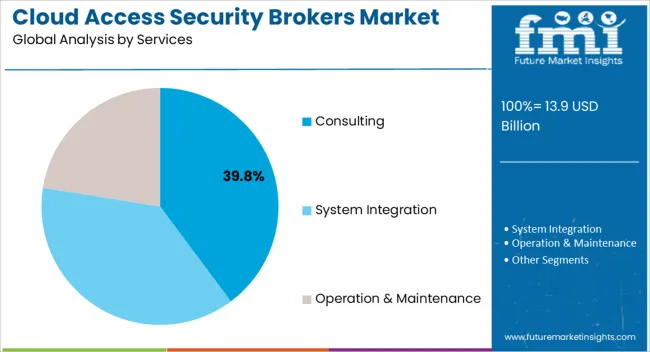
The cloud deployment type is segmented into software as a service, platform as a service, and infrastructure as a service. At the same time, the software type category is segmented into On-premise software and cloud-based software. The services category was segmented into Consulting, System Integration and Operation & Maintenance.

A unified Market Research Subscription Platform, built for today's disparate research needs.
Which Segment is likely to Lead the Cloud Access Security Brokers Market by Cloud Deployment Type?
By cloud deployment type, the software as a service segment is the largest segment in the cloud access security brokers market, thriving at a CAGR of 14.3 and is likely to hold the biggest portion in the market.
The factors behind the growth of this segment are the easy installation of software as a secure solution to cloud storage. Other driving factors are faster deployment, mobility, reduced cost and scalability than software as a service provides to its end users. This pushes the sales of cloud access security broker solutions.
Which Segment is likely to Lead the Cloud Access Security Brokers Market by Software Type?
By software type, the On-premise software is the largest segment in the market that is booming at a CAGR of 12.5% and is expected to hold the biggest portion by the forecast period.
The factors behind the excessive growth of this segment are reliability and customer behaviour around the on-premise software type. On-premise software secures the individual systems, safeguarding the data and information.
What is the Regional Analysis for the Cloud Access Security Brokers Market?
The cloud access security brokers market is divided into regions; North America, Latin America, Asia Pacific, Middle East and Africa (MEA) and Europe. The biggest market is the United States, thriving at a CAGR of 16% between 2022-2032.
The region is expected to hold a market revenue of US$ 10.3 Bn by the end of 2032. Growing concern regarding data and information security from fraud and data breaches is pushing the sales of cloud access security broker solutions.
Another reason behind the high growth of the cloud access security broker solution market in this region is the high competition and new private players in the sector. Australia has the highest CAGR of 16.7% in the market that is because of its high capital investments in markets.
Apart from this, China is the third-highest growing market for the cloud access security broker market. Chinese region will hold US$ 2.1 Bn by the end of 2032 as it thrives on a strong CAGR of 14.3% between 2022-and 2032. Though Japan is likely to be the second-largest market by 2032 in terms of revenue that, is US$ 3.2 Bn with a CAGR of 14.2%
Regions |
CAGR (2022-2032) |
United States |
16% |
Brazil |
13.3% |
China |
14.3% |
Japan |
14.2% |
Australia |
16.7% |
- United States hold the biggest portion in the Cloud access security broker market.
- Australia is also the highest growing market in the cloud access security broker. While the US is the second highest growing market for Cloud access security brokers market with a CAGR of 16% between (2022-2032).
- Technological advancements, growing market competition and growing concern over data and information security that fuels the cloud access security brokers industry in developed countries like the US and Australian region.
How is the Competition in the Cloud Access Security Brokers Market?
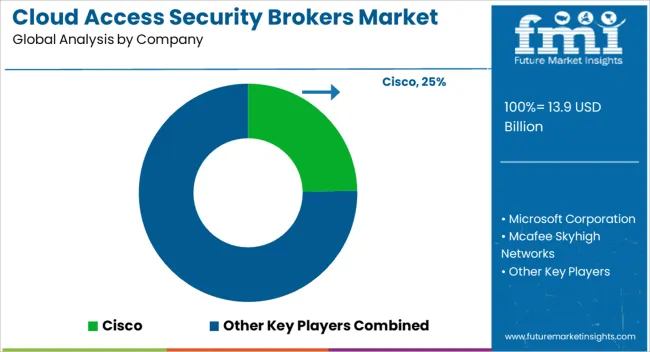
The competitive analysis explains how cloud access security brokers market is dynamic. The key players are experimenting and adding more layers to the software in order to provide security from all kinds of advanced threats, including fraud and spam strikes. The major competitors also focus on collaborations and seasonal discounts on sales. The market is currently under an ongoing development process where vendors add new components to it.
Recent Developments in the Cloud access security brokers Market
- NetSkope Inc has introduced its security service edge (SSE) platform that provides unrivaled visibility & real-time data monitoring, pushing the cloud access security brokers solutions.
- Zscaler Inc has introduced industry’s first security service edge innovation that is likely to protect enterprises from advanced cyber-attacks, pushing the sales of cloud access security brokers solutions.
Key Players
- NetSkope Inc
- Skyhigh Networks
- CloudLock Inc
- Zscaler Inc
- Bitglass Inc.
Key Segments
By Cloud Deployment Type:
- Software as a Service
- Platform as a Service
- Infrastructure as a Service
By Software Type:
- On-Premise Software
- Cloud and Monitoring
- Control & Monitoring
- Risk & Compliances Management
- Cloud Data Encryption
- Data Confidentiality/Data Leakage Prevention
- Tokenization
By Services:
- Consulting
- System Integration
- Operation & Maintenance
By Region:
- United States
- Brazil
- China
- Japan
- Australia
Frequently Asked Questions
What is the CAGR of the Cloud Access Security Brokers Market?
Cloud access security brokers market is set to grow at a CAGR of 13.9% by 2032.
Which is the Leading Region in the Cloud Access Security Brokers Market?
United States is the biggest region in cloud access security brokers market with a CAGR of 16% by 2032.
Which Segment leads in the Cloud Access Security Brokers Market by Cloud Deployment Type?
Software as a service is the leading segment in the cloud access security brokers market by cloud deployment type.
What is the Growth Estimated for the Cloud Access Security Brokers Market by 2032?
The cloud access security brokers market is set to reach US$ 52.6 Bn by 2032.
Which Region has the Highest Growth Potential?
Australia has the highest growth potential in the cloud access security brokers market with a CAGR of 16.7% by 2032.
Table of Content
1. Executive Summary 1.1. Global Market Outlook 1.2. Summary of Statistics 1.3. Key Market Characteristics & Attributes 1.4. Fact.MR Analysis and Recommendations 2. Market Overview 2.1. Introduction 2.2. Market Coverage 2.3. Market Definition 3. Market Risks and Trends Assessment 3.1. Risk Assessment 3.1.1. COVID-19 Impact Benchmark with Previous Crisis 3.1.2. Impact on Market Value (US$ Mn) 3.1.3. Assessment by Key Countries 3.1.4. Assessment by Key Market Segments 3.1.5. Action Points and Recommendation for Suppliers 3.2. Key Trends Impacting the Market 3.3. Product Development Trends 4. Market Background and Foundation Data Points 4.1. Cloud Access Security Brokers Market Opportunity Assessment (US$ Mn) 4.1.1. Total Available Market 4.1.2. Serviceable Addressable Market 4.1.3. Serviceable Obtainable Market 4.2. Market Scenario Forecast 4.2.1. Demand in Optimistic Scenario 4.2.2. Demand in Likely Scenario 4.2.3. Demand in Conservative Scenario 4.3. Investment Feasibility Analysis 4.3.1. Investment in Established Markets 4.3.1.1. In Short Term 4.3.1.2. In Long Term 4.3.2. Investment in Emerging Markets 4.3.2.1. In Short Term 4.3.2.2. In Long Term 4.4. Forecast Factors - Relevance & Impact 4.4.1. Top Companies Historical Growth 4.5. Market Dynamics 4.5.1. Market Driving Factors and Impact Assessment 4.5.2. Prominent Market Challenges and Impact Assessment 4.5.3. Cloud Access Security Brokers Market Opportunities 4.5.4. Prominent Trends in the Global Market & Their Impact Assessment 5. Global Cloud Access Security Brokers Market Demand Analysis 2015-2021 and Forecast,2022-2032 5.1. Historical Market Analysis, 2015-2021 5.2. Current and Future Market Projections,2022-2032 5.3. Y-o-Y Growth Trend Analysis 6. Global Cloud Access Security Brokers Market Value Analysis 2015-2021 and Forecast,2022-2032 6.1. Historical Market Value (US$ Mn) Analysis, 2015-2021 6.2. Current and Future Market Value (US$ Mn) Projections,2022-2032 6.2.1. Y-o-Y Growth Trend Analysis 6.2.2. Absolute $ Opportunity Analysis 7. Global Cloud Access Security Brokers Market Analysis 2015-2021 and Forecast 2022-2032, By Cloud Deployment Type 7.1. Introduction / Key Findings 7.2. Historical Market Size (US$ Mn) Analysis By Cloud Deployment Type, 2015-2021 7.3. Current and Future Market Size (US$ Mn) Analysis and Forecast By Cloud Deployment Type,2022-2032 7.3.1. Software as a Service 7.3.2. Platform as a Service 7.3.3. Infrastructure as a Service 7.4. Market Attractiveness Analysis By Cloud Deployment Type 8. Global Cloud Access Security Brokers Market Analysis 2015-2021 and Forecast 2022-2032, By Software Type 8.1. Introduction / Key Findings 8.2. Historical Market Size (US$ Mn) Analysis By Software Type, 2015-2021 8.3. Current and Future Market Size (US$ Mn) Analysis and Forecast By Software Type,2022-2032 8.3.1. On-premise Software 8.3.2. Cloud Based Software 8.4. Market Attractiveness Analysis By Software Type 9. Global Cloud Access Security Brokers Market Analysis 2015-2021 and Forecast 2022-2032, By Services 9.1. Introduction / Key Findings 9.2. Historical Market Size (US$ Mn) Analysis By Services, 2015-2021 9.3. Current and Future Market Size (US$ Mn) Analysis and Forecast By Services,2022-2032 9.3.1. Consulting 9.3.2. System Integration 9.3.3. Operation and Maintenance 9.4. Market Attractiveness Analysis By Services 10. Global Cloud Access Security Brokers Market Analysis 2015-2021 and Forecast 2022-2032, by Region 10.1. Introduction 10.2. Historical Market Size (US$ Mn) Analysis By Region, 2015-2021 10.3. Current Market Size (US$ Mn) & Analysis and Forecast By Region,2022-2032 10.3.1. North America 10.3.2. Latin America 10.3.3. Europe 10.3.4. Asia Pacific 10.3.5. Middle East and Africa (MEA) 10.4. Market Attractiveness Analysis By Region 11. North America Cloud Access Security Brokers Market Analysis 2015-2021 and Forecast 2022-2032 11.1. Introduction 11.2. Historical Market Value (US$ Mn) Trend Analysis By Market Taxonomy, 2015-2021 11.3. Market Value (US$ Mn) & Forecast By Market Taxonomy,2022-2032 11.3.1. By Country 11.3.1.1. U.S. 11.3.1.2. Rest of North America 11.3.2. By Software Type 11.3.3. By Cloud Deployment Type 11.3.4. By Services 11.4. Market Attractiveness Analysis 11.4.1. By Country 11.4.2. By Software Type 11.4.3. By Cloud Deployment Type 11.4.4. By Services 12. Latin America Cloud Access Security Brokers Market Analysis 2015-2021 and Forecast 2022-2032 12.1. Introduction 12.2. Historical Market Value (US$ Mn) Trend Analysis By Market Taxonomy, 2015-2021 12.3. Market Value (US$ Mn) & Forecast By Market Taxonomy,2022-2032 12.3.1. By Country 12.3.1.1. Brazil 12.3.1.2. Rest of Latin America 12.3.2. By Software Type 12.3.3. By Cloud Deployment Type 12.3.4. By Services 12.4. Market Attractiveness Analysis 12.4.1. By Country 12.4.2. By Software Type 12.4.3. By Cloud Deployment Type 12.4.4. By Services 13. Europe Cloud Access Security Brokers Market Analysis 2015-2021 and Forecast2022-2032 13.1. Introduction 13.2. Historical Market Value (US$ Mn) Trend Analysis By Market Taxonomy, 2015-2021 13.3. Market Value (US$ Mn) & Forecast By Market Taxonomy,2022-2032 13.3.1. By Country 13.3.1.1. EU7 13.3.1.2. CIS 13.3.1.3. Rest of Europe 13.3.2. By Software Type 13.3.3. By Cloud Deployment Type 13.3.4. By Services 13.4. Market Attractiveness Analysis 13.4.1. By Country 13.4.2. By Software Type 13.4.3. By Cloud Deployment Type 13.4.4. By Services 14. Asia Pacific Cloud Access Security Brokers Market Analysis 2015-2021 and Forecast2022-2032 14.1. Introduction 14.2. Historical Market Value (US$ Mn) Trend Analysis By Market Taxonomy, 2015-2021 14.3. Market Value (US$ Mn) & Forecast By Market Taxonomy,2022-2032 14.3.1. By Country 14.3.1.1. China 14.3.1.2. Japan 14.3.1.3. South Asia 14.3.1.4. Australia 14.3.1.5. Rest of APAC 14.3.2. By Software Type 14.3.3. By Cloud Deployment Type 14.3.4. By Services 14.4. Market Attractiveness Analysis 14.4.1. By Country 14.4.2. By Software Type 14.4.3. By Cloud Deployment Type 14.4.4. By Services 15. Middle East and Africa Cloud Access Security Brokers Market Analysis 2015-2021 and Forecast2022-2032 15.1. Introduction 15.2. Historical Market Value (US$ Mn) Trend Analysis By Market Taxonomy, 2015-2021 15.3. Market Value (US$ Mn) & Forecast By Market Taxonomy,2022-2032 15.3.1. By Country 15.3.1.1. GCC Countries 15.3.1.2. Southern Africa 15.3.1.3. Rest of Middle East and Africa 15.3.2. By Software Type 15.3.3. By Cloud Deployment Type 15.3.4. By Services 15.4. Market Attractiveness Analysis 15.4.1. By Country 15.4.2. By Software Type 15.4.3. By Cloud Deployment Type 15.4.4. By Services 16. Market Structure Analysis 16.1. Market Analysis by Tier of Companies 16.2. Market Concentration 16.3. Market Share Analysis of Top Players 16.4. Market Presence Analysis 16.4.1. By Regional footprint of Players 16.4.2. Product footprint by Players 16.4.3. Channel footprint by Players 17. Competition Analysis 17.1. Competition Dashboard 17.2. Competition Benchmarking 17.3. Competition Deep Dive 17.3.1. NetSkope Inc. 17.3.1.1. Overview 17.3.1.2. Product Portfolio 17.3.1.3. Sales Footprint 17.3.1.4. Strategy Overview 17.3.2. Skyhigh Networks 17.3.2.1. Overview 17.3.2.2. Product Portfolio 17.3.2.3. Sales Footprint 17.3.2.4. Strategy Overview 17.3.3. CloudLock Inc. 17.3.3.1. Overview 17.3.3.2. Product Portfolio 17.3.3.3. Sales Footprint 17.3.3.4. Strategy Overview 17.3.4. Zscaler, Inc. 17.3.4.1. Overview 17.3.4.2. Product Portfolio 17.3.4.3. Sales Footprint 17.3.4.4. Strategy Overview 17.3.5. Adallom, Inc. 17.3.5.1. Overview 17.3.5.2. Product Portfolio 17.3.5.3. Sales Footprint 17.3.5.4. Strategy Overview 17.3.6. Bitglass, Inc. 17.3.6.1. Overview 17.3.6.2. Product Portfolio 17.3.6.3. Sales Footprint 17.3.6.4. Strategy Overview 17.3.7. CipherCloud Inc. 17.3.7.1. Overview 17.3.7.2. Product Portfolio 17.3.7.3. Sales Footprint 17.3.7.4. Strategy Overview 17.3.8. Protegrity USA, Inc. 17.3.8.1. Overview 17.3.8.2. Product Portfolio 17.3.8.3. Sales Footprint 17.3.8.4. Strategy Overview 18. Assumptions and Acronyms Used 19. Research Methodology
Let us know your requirement to get
100% FREE customization
List of Tables
Table1: Global Cloud Access Security Brokers Market Value (US$ Mn), By Software Type, 2015 – 2021 Table2: Global Cloud Access Security Brokers Market Value (US$ Mn), By Software Type, 2022 – 2032 Table3: Global Cloud Access Security Brokers Market Value (US$ Mn), By Cloud Deployment Type, 2015 – 2021 Table4: Global Cloud Access Security Brokers Market Value (US$ Mn), By Cloud Deployment Type, 2022 – 2032 Table5: Global Cloud Access Security Brokers Market Value (US$ Mn), By Services, 2015 – 2021 Table6: Global Cloud Access Security Brokers Market Value (US$ Mn), By Services, 2022 – 2032 Table7: Global Cloud Access Security Brokers Market, By Region, 2015 – 2021 Table8: Global Cloud Access Security Brokers Market, By Region, 2022 – 2032 Table9: North America Cloud Access Security Brokers Market Value (US$ Mn), By Software Type, 2015 – 2021 Table10: North America Cloud Access Security Brokers Market Value (US$ Mn), By Software Type, 2022 – 2032 Table11: North America Cloud Access Security Brokers Market Value (US$ Mn), By Cloud Deployment Type, 2015 – 2021 Table12: North America Cloud Access Security Brokers Market Value (US$ Mn), By Cloud Deployment Type, 2022 – 2032 Table13: North America Cloud Access Security Brokers Market Value (US$ Mn), By Services, 2015 – 2021 Table14: North America Cloud Access Security Brokers Market Value (US$ Mn), By Services, 2022 – 2032 Table15: North America Cloud Access Security Brokers Market, By Country, 2015 – 2021 Table16: North America Cloud Access Security Brokers Market, By Country, 2022 – 2032 Table17: Latin America Cloud Access Security Brokers Market Value (US$ Mn), By Software Type, 2015 – 2021 Table18: Latin America Cloud Access Security Brokers Market Value (US$ Mn), By Software Type, 2022 – 2032 Table19: Latin America Cloud Access Security Brokers Market Value (US$ Mn), By Cloud Deployment Type, 2015 – 2021 Table20: Latin America Cloud Access Security Brokers Market Value (US$ Mn), By Cloud Deployment Type, 2022 – 2032 Table21: Latin America Cloud Access Security Brokers Market Value (US$ Mn), By Services, 2015 – 2021 Table22: Latin America Cloud Access Security Brokers Market Value (US$ Mn), By Services, 2022 – 2032 Table23: Latin America Cloud Access Security Brokers Market, By Country, 2015 – 2021 Table24: Latin America Cloud Access Security Brokers Market, By Country, 2022 – 2032 Table25: Europe Cloud Access Security Brokers Market Value (US$ Mn), By Software Type, 2015 – 2021 Table26: Europe Cloud Access Security Brokers Market Value (US$ Mn), By Software Type, 2022 – 2032 Table27: Europe Cloud Access Security Brokers Market Value (US$ Mn), By Cloud Deployment Type, 2015 – 2021 Table28: Europe Cloud Access Security Brokers Market Value (US$ Mn), By Cloud Deployment Type, 2022 – 2032 Table29: Europe Cloud Access Security Brokers Market Value (US$ Mn), By Services, 2015 – 2021 Table30: Europe Cloud Access Security Brokers Market Value (US$ Mn), By Services, 2022 – 2032 Table31: Europe Cloud Access Security Brokers Market, By Country, 2015 – 2021 Table32: Europe Cloud Access Security Brokers Market, By Country, 2022 – 2032 Table33: Asia Pacific Cloud Access Security Brokers Market Value (US$ Mn), By Software Type, 2015 – 2021 Table34: Asia Pacific Cloud Access Security Brokers Market Value (US$ Mn), By Software Type, 2022 – 2032 Table35: Asia Pacific Cloud Access Security Brokers Market Value (US$ Mn), By Cloud Deployment Type, 2015 – 2021 Table36: Asia Pacific Cloud Access Security Brokers Market Value (US$ Mn), By Cloud Deployment Type, 2022 – 2032 Table37: Asia Pacific Cloud Access Security Brokers Market Value (US$ Mn), By Services, 2015 – 2021 Table38: Asia Pacific Cloud Access Security Brokers Market Value (US$ Mn), By Services, 2022 – 2032 Table39: Asia Pacific Cloud Access Security Brokers Market, By Country, 2015 – 2021 Table40: Asia Pacific Cloud Access Security Brokers Market, By Country, 2022 – 2032 Table41: MEA Cloud Access Security Brokers Market Value (US$ Mn), By Software Type, 2015 – 2021 Table42: MEA Cloud Access Security Brokers Market Value (US$ Mn), By Software Type, 2022 – 2032 Table43: MEA Cloud Access Security Brokers Market Value (US$ Mn), By Cloud Deployment Type, 2015 – 2021 Table44: MEA Cloud Access Security Brokers Market Value (US$ Mn), By Cloud Deployment Type, 2022 – 2032 Table45: MEA Cloud Access Security Brokers Market Value (US$ Mn), By Services, 2015 – 2021 Table46: MEA Cloud Access Security Brokers Market Value (US$ Mn), By Services, 2022 – 2032 Table47: MEA Cloud Access Security Brokers Market, By Country, 2015 – 2021 Table48: MEA Cloud Access Security Brokers Market, By Country, 2022 – 2032 Table49: Global Cloud Access Security Brokers Market Incremental $ Opportunity, By Software Type, 2015 - 2021 Table50: Global Cloud Access Security Brokers Market Incremental $ Opportunity, By Cloud Deployment Type, 2022 – 2032 Table51: Global Cloud Access Security Brokers Market Incremental $ Opportunity, By Services, 2015 - 2021 Table52: Global Cloud Access Security Brokers Market Incremental $ Opportunity, by Region, 2022 – 2032 Table53: North America Cloud Access Security Brokers Market Incremental $ Opportunity, By Software Type, 2015 - 2021 Table54: North America Cloud Access Security Brokers Market Incremental $ Opportunity, By Cloud Deployment Type, 2022 – 2032 Table55: North America Cloud Access Security Brokers Market Incremental $ Opportunity, By Services, 2015 – 2021 Table56: North America Cloud Access Security Brokers Market Incremental $ Opportunity, by Country, 2022 – 2032 Table57: Latin America Cloud Access Security Brokers Market Incremental $ Opportunity, By Software Type, 2015 - 2021 Table58: Latin America Cloud Access Security Brokers Market Incremental $ Opportunity, By Cloud Deployment Type, 2022 – 2032 Table59: Latin America Cloud Access Security Brokers Market Incremental $ Opportunity, By Services, 2015 - 2021 Table60: Latin America Cloud Access Security Brokers Market Incremental $ Opportunity, by Country, 2022 – 2032 Table61: Europe Cloud Access Security Brokers Market Incremental $ Opportunity, By Software Type, 2015 - 2021 Table62: Europe Cloud Access Security Brokers Market Incremental $ Opportunity, By Cloud Deployment Type, 2022 – 2032 Table63: Europe Cloud Access Security Brokers Market Incremental $ Opportunity, By Services, 2015 - 2021 Table64: Europe Cloud Access Security Brokers Market Incremental $ Opportunity, by Country, 2022-2032 Table65: Asia Pacific Cloud Access Security Brokers Market Incremental $ Opportunity, By Software Type, 2015 - 2021 Table66: Asia Pacific Cloud Access Security Brokers Market Incremental $ Opportunity, By Cloud Deployment Type, 2022 – 2032 Table67: Asia Pacific Cloud Access Security Brokers Market Incremental $ Opportunity, By Services, 2015 - 2021 Table68: Asia Pacific Cloud Access Security Brokers Market Incremental $ Opportunity, by Country, 2022 – 2032 Table69: MEA Cloud Access Security Brokers Market Incremental $ Opportunity, By Software Type, 2015 - 2021 Table70: MEA Cloud Access Security Brokers Market Incremental $ Opportunity, By Cloud Deployment Type, 2022 – 2032 Table71: MEA Cloud Access Security Brokers Market Incremental $ Opportunity, By Services, 2015 - 2021 Table72: MEA Cloud Access Security Brokers Market Incremental $ Opportunity, by Country, 2022-2032
Find your sweet spots for generating winning opportunities in this market.
Talk to AnalystList of Charts
Figure 1: Global Cloud Access Security Brokers Market Value (US$ Mn) and Year-on-Year Growth, 2015-2032 Figure 2: Global Cloud Access Security Brokers Market Absolute $ Historical Gain (2015 - 2021) and Opportunity (2022 – 2032), US$ Mn Figure 3: Global Cloud Access Security Brokers Market Share, By Software Type,2021 & 2032 Figure 4: Global Cloud Access Security Brokers Market Y-o-Y Growth Projections, By Software Type –2022-2032 Figure 5: Global Cloud Access Security Brokers Market Attractiveness Index, By Software Type –2022-2032 Figure 6: Global Cloud Access Security Brokers Market Share, By Cloud Deployment Type,2021 & 2032 Figure 7: Global Cloud Access Security Brokers Market Y-o-Y Growth Projections, By Cloud Deployment Type –2022-2032 Figure 8: Global Cloud Access Security Brokers Market Attractiveness Index, By Cloud Deployment Type –2022-2032 Figure 9: Global Cloud Access Security Brokers Market Share, By Services,2021 & 2032 Figure 10: Global Cloud Access Security Brokers Market Y-o-Y Growth Projections, By Services –2022-2032 Figure 11: Global Cloud Access Security Brokers Market Attractiveness Index, By Services –2022-2032 Figure 12: Global Cloud Access Security Brokers Market Share, By Services,2021 & 2032 Figure 13: Global Cloud Access Security Brokers Market Y-o-Y Growth Projections, By Services –2022-2032 Figure 14: Global Cloud Access Security Brokers Market Attractiveness Index, By Services –2022-2032 Figure 15: Global Cloud Access Security Brokers Market Share, by Region,2021 & 2032 Figure 16: Global Cloud Access Security Brokers Market Y-o-Y Growth Projections, by Region –2022-2032 Figure 17: Global Cloud Access Security Brokers Market Attractiveness Index, by Region –2022-2032 Figure 18: North America Cloud Access Security Brokers Market Value (US$ Mn) and Year-on-Year Growth, 2015-2032 Figure 19: North America Cloud Access Security Brokers Market Absolute $ Opportunity Historical (2015 - 2021) and Forecast Period (2022 – 2032), US$ Mn Figure 20: North America Cloud Access Security Brokers Market Share, By Software Type,2021 & 2032 Figure 21: North America Cloud Access Security Brokers Market Y-o-Y Growth Projections, By Software Type –2022-2032 Figure 22: North America Cloud Access Security Brokers Market Attractiveness Index, By Software Type –2022-2032 Figure 23: North America Cloud Access Security Brokers Market Share, By Cloud Deployment Type,2021 & 2032 Figure 24: North America Cloud Access Security Brokers Market Y-o-Y Growth Projections, By Cloud Deployment Type –2022-2032 Figure 25: North America Cloud Access Security Brokers Market Attractiveness Index, By Cloud Deployment Type –2022-2032 Figure 26: North America Cloud Access Security Brokers Market Share, By Services,2021 & 2032 Figure 27: North America Cloud Access Security Brokers Market Y-o-Y Growth Projections, By Services –2022-2032 Figure 28: North America Cloud Access Security Brokers Market Attractiveness Index, By Services –2022-2032 Figure 29: North America Cloud Access Security Brokers Market Share, By Services,2021 & 2032 Figure 30: North America Cloud Access Security Brokers Market Y-o-Y Growth Projections, By Services –2022-2032 Figure 31: North America Cloud Access Security Brokers Market Attractiveness Index, By Services –2022-2032 Figure 32: North America Cloud Access Security Brokers Market Share, by Country,2021 & 2032 Figure 33: North America Market Y-o-Y Growth Projections, by Country –2022-2032 Figure 34: North America Market Attractiveness Index, by Country –2022-2032 Figure 35: Latin America Cloud Access Security Brokers Market Value (US$ Mn) and Year-on-Year Growth, 2015-2032 Figure 36: Latin America Cloud Access Security Brokers Market Absolute $ Opportunity Historical (2015 - 2021) and Forecast Period (2022 – 2032), US$ Mn Figure 37: Latin America Cloud Access Security Brokers Market Share, By Software Type,2021 & 2032 Figure 38: Latin America Cloud Access Security Brokers Market Y-o-Y Growth Projections, By Software Type –2022-2032 Figure 39: Latin America Cloud Access Security Brokers Market Attractiveness Index, By Software Type –2022-2032 Figure 40: Latin America Cloud Access Security Brokers Market Share, By Cloud Deployment Type,2021 & 2032 Figure 41: Latin America Cloud Access Security Brokers Market Y-o-Y Growth Projections, By Cloud Deployment Type –2022-2032 Figure 42: Latin America Cloud Access Security Brokers Market Attractiveness Index, By Cloud Deployment Type –2022-2032 Figure 43: Latin America Cloud Access Security Brokers Market Share, By Services,2021 & 2032 Figure 44: Latin America Cloud Access Security Brokers Market Y-o-Y Growth Projections, By Services –2022-2032 Figure 45: Latin America Cloud Access Security Brokers Market Attractiveness Index, By Services –2022-2032 Figure 46: Latin America Cloud Access Security Brokers Market Share, By Services,2021 & 2032 Figure 47: Latin America Cloud Access Security Brokers Market Y-o-Y Growth Projections, By Services –2022-2032 Figure 48: Latin America Cloud Access Security Brokers Market Attractiveness Index, By Services –2022-2032 Figure 49: Latin America Cloud Access Security Brokers Market Share, by Country,2021 & 2032 Figure 50: Latin America Cloud Access Security Brokers Market Y-o-Y Growth Projections, by Country –2022-2032 Figure 51: Latin America Cloud Access Security Brokers Market Attractiveness Index, by Country –2022-2032 Figure 52: Europe Cloud Access Security Brokers Market Value (US$ Mn) and Year-on-Year Growth, 2015-2032 Figure 53: Europe Cloud Access Security Brokers Market Absolute $ Opportunity Historical (2015 - 2021) and Forecast Period (2022 – 2032), US$ Mn Figure 54: Europe Cloud Access Security Brokers Market Share, By Software Type,2021 & 2032 Figure 55: Europe Cloud Access Security Brokers Market Y-o-Y Growth Projections, By Software Type –2022-2032 Figure 56: Europe Cloud Access Security Brokers Market Attractiveness Index, By Software Type –2022-2032 Figure 57: Europe Cloud Access Security Brokers Market Share, By Cloud Deployment Type,2021 & 2032 Figure 58: Europe Cloud Access Security Brokers Market Y-o-Y Growth Projections, By Cloud Deployment Type –2022-2032 Figure 59: Europe Cloud Access Security Brokers Market Attractiveness Index, By Cloud Deployment Type –2022-2032 Figure 60: Europe Cloud Access Security Brokers Market Share, By Services,2021 & 2032 Figure 61: Europe Cloud Access Security Brokers Market Y-o-Y Growth Projections, By Services –2022-2032 Figure 62: Europe Cloud Access Security Brokers Market Attractiveness Index, By Services –2022-2032 Figure 63: Europe Cloud Access Security Brokers Market Share, By Services,2021 & 2032 Figure 64: Europe Cloud Access Security Brokers Market Y-o-Y Growth Projections, By Services –2022-2032 Figure 65: Europe Cloud Access Security Brokers Market Attractiveness Index, By Services –2022-2032 Figure 66: Europe Cloud Access Security Brokers Market Share, by Country,2021 & 2032 Figure 67: Europe Cloud Access Security Brokers Market Y-o-Y Growth Projections, by Country –2022-2032 Figure 68: Europe Cloud Access Security Brokers Market Attractiveness Index, by Country –2022-2032 Figure 69: MEA Cloud Access Security Brokers Market Value (US$ Mn) and Year-on-Year Growth, 2015-2032 Figure 70: MEA Cloud Access Security Brokers Market Absolute $ Opportunity Historical (2015 - 2021) and Forecast Period (2022 – 2032), US$ Mn Figure 71: MEA Cloud Access Security Brokers Market Share, By Software Type,2021 & 2032 Figure 72: MEA Cloud Access Security Brokers Market Y-o-Y Growth Projections, By Software Type –2022-2032 Figure 73: MEA Cloud Access Security Brokers Market Attractiveness Index, By Software Type –2022-2032 Figure 74: MEA Cloud Access Security Brokers Market Share, By Cloud Deployment Type,2021 & 2032 Figure 75: MEA Cloud Access Security Brokers Market Y-o-Y Growth Projections, By Cloud Deployment Type –2022-2032 Figure 76: MEA Cloud Access Security Brokers Market Attractiveness Index, By Cloud Deployment Type –2022-2032 Figure 77: MEA Cloud Access Security Brokers Market Share, By Services,2021 & 2032 Figure 78: MEA Cloud Access Security Brokers Market Y-o-Y Growth Projections, By Services –2022-2032 Figure 79: MEA Cloud Access Security Brokers Market Attractiveness Index, By Services –2022-2032 Figure 80: MEA Cloud Access Security Brokers Market Share, By Services,2021 & 2032 Figure 81: MEA Cloud Access Security Brokers Market Y-o-Y Growth Projections, By Services –2022-2032 Figure 82: MEA Cloud Access Security Brokers Market Attractiveness Index, By Services –2022-2032 Figure 83: MEA Cloud Access Security Brokers Market Share, by Country,2021 & 2032 Figure 84: MEA Cloud Access Security Brokers Market Y-o-Y Growth Projections, by Country –2022-2032 Figure 85: MEA Cloud Access Security Brokers Market Attractiveness Index, by Country –2022-2032 Figure 86: Asia Pacific Cloud Access Security Brokers Market Value (US$ Mn) and Year-on-Year Growth, 2015-2030 Figure 87: Asia Pacific Cloud Access Security Brokers Market Absolute $ Opportunity Historical (2016 - 2019) and Forecast Period (2020 – 2030), US$ Mn Figure 88: Asia Pacific Cloud Access Security Brokers Market Share, By Software Type,2021 & 2032 Figure 89: Asia Pacific Cloud Access Security Brokers Market Y-o-Y Growth Projections, By Software Type –2022-2032 Figure 90: Asia Pacific Cloud Access Security Brokers Market Attractiveness Index, By Software Type –2022-2032 Figure 91: Asia Pacific Cloud Access Security Brokers Market Share, By Cloud Deployment Type,2021 & 2032 Figure 92: Asia Pacific Cloud Access Security Brokers Market Y-o-Y Growth Projections, By Cloud Deployment Type –2022-2032 Figure 93: Asia Pacific Cloud Access Security Brokers Market Attractiveness Index, By Cloud Deployment Type –2022-2032 Figure 94: Asia Pacific Cloud Access Security Brokers Market Share, By Services,2021 & 2032 Figure 95: Asia Pacific Cloud Access Security Brokers Market Y-o-Y Growth Projections, By Services –2022-2032 Figure 96: Asia Pacific Cloud Access Security Brokers Market Attractiveness Index, By Services –2022-2032 Figure 97: Asia Pacific Cloud Access Security Brokers Market Share, By Services,2021 & 2032 Figure 98: Asia Pacific Cloud Access Security Brokers Market Y-o-Y Growth Projections, By Services –2022-2032 Figure 99: Asia Pacific Cloud Access Security Brokers Market Attractiveness Index, By Services –2022-2032 Figure 100: Asia Pacific Cloud Access Security Brokers Market Share, by Country,2021 & 2032 Figure 101: Asia Pacific Cloud Access Security Brokers Market Y-o-Y Growth Projections, by Country –2022-2032 Figure 102: Asia Pacific Cloud Access Security Brokers Market Attractiveness Index, by Country –2022-2032 Figure 103: US Cloud Access Security Brokers Market Value (US$ Mn) and Forecast, 2022-2032 Figure 104: US Cloud Access Security Brokers Market Share, By Software Type, 2021 Figure 105: US Cloud Access Security Brokers Market Share, By Cloud Deployment Type, 2021 Figure 106: US Cloud Access Security Brokers Market Share, By Services, 2021 Figure 107: Rest of North America Cloud Access Security Brokers Market Value (US$ Mn) and Forecast, 2022-2032 Figure 108: Rest of North America Cloud Access Security Brokers Market Share, By Software Type, 2021 Figure 109: Rest of North America Cloud Access Security Brokers Market Share, By Cloud Deployment Type, 2021 Figure 110: Rest of North America Cloud Access Security Brokers Market Share, By Services, 2021 Figure 111: Brazil Cloud Access Security Brokers Market Value (US$ Mn) and Forecast, 2022-2032 Figure 112: Brazil Cloud Access Security Brokers Market Share, By Software Type, 2021 Figure 113: Brazil Cloud Access Security Brokers Market Share, By Cloud Deployment Type, 2021 Figure 114: Brazil Cloud Access Security Brokers Market Share, By Services, 2021 Figure 115: Rest of Latin America Cloud Access Security Brokers Market Value (US$ Mn) and Forecast, 2022-2032 Figure 116: Rest of Latin America Cloud Access Security Brokers Market Share, By Software Type, 2021 Figure 117: Rest of Latin America Cloud Access Security Brokers Market Share, By Cloud Deployment Type, 2021 Figure 118: Rest of Latin America Cloud Access Security Brokers Market Share, By Services, 2021 Figure 119: EU7Cloud Access Security Brokers Market Value (US$ Mn) and Forecast, 2022-2032 Figure 120: EU7Cloud Access Security Brokers Market Share, By Software Type, 2021 Figure 121: EU7Cloud Access Security Brokers Market Share, By Cloud Deployment Type, 2021 Figure 122: EU7Cloud Access Security Brokers Market Share, By Services, 2021 Figure 123:CIS Cloud Access Security Brokers Market Value (US$ Mn) and Forecast, 2022-2032 Figure 124:CIS Cloud Access Security Brokers Market Share, By Software Type, 2021 Figure 125:CIS Cloud Access Security Brokers Market Share, By Cloud Deployment Type, 2021 Figure 126:CIS Cloud Access Security Brokers Market Share, By Services, 2021 Figure 127: Rest of Europe Cloud Access Security Brokers Market Value (US$ Mn) and Forecast, 2022-2032 Figure 128: Rest of Europe Cloud Access Security Brokers Market Share, By Software Type, 2021 Figure 129: Rest of Europe Cloud Access Security Brokers Market Share, By Cloud Deployment Type, 2021 Figure 130: Rest of Europe Cloud Access Security Brokers Market Share, By Services, 2021 Figure 131: China Cloud Access Security Brokers Market Value (US$ Mn) and Forecast, 2022-2032 Figure 132: China Cloud Access Security Brokers Market Share, By Software Type, 2021 Figure 133: China Cloud Access Security Brokers Market Share, By Cloud Deployment Type, 2021 Figure 134: China Cloud Access Security Brokers Market Share, By Services, 2021 Figure 135: Japan Cloud Access Security Brokers Market Value (US$ Mn) and Forecast, 2022-2032 Figure 136: Japan Cloud Access Security Brokers Market Share, By Software Type, 2021 Figure 137: Japan Cloud Access Security Brokers Market Share, By Cloud Deployment Type, 2021 Figure 138: Japan Cloud Access Security Brokers Market Share, By Services, 2021 Figure 139: South Asia Cloud Access Security Brokers Market Value (US$ Mn) and Forecast, 2022-2032 Figure 140: South Asia Cloud Access Security Brokers Market Share, By Software Type, 2021 Figure 141: South Asia Cloud Access Security Brokers Market Share, By Cloud Deployment Type, 2021 Figure 142: South Asia Cloud Access Security Brokers Market Share, By Services, 2021 Figure 143: Australia Cloud Access Security Brokers Market Value (US$ Mn) and Forecast, 2022-2032 Figure 144: Australia Cloud Access Security Brokers Market Share, By Software Type, 2021 Figure 145: Australia Cloud Access Security Brokers Market Share, By Cloud Deployment Type, 2021 Figure 146: Australia Cloud Access Security Brokers Market Share, By Services, 2021 Figure 147: Rest of APAC Cloud Access Security Brokers Market Value (US$ Mn) and Forecast, 2022-2032 Figure 148: Rest of APAC Cloud Access Security Brokers Market Share, By Software Type, 2021 Figure 149: Rest of APAC Cloud Access Security Brokers Market Share, By Cloud Deployment Type, 2021 Figure 150: Rest of APAC Cloud Access Security Brokers Market Share, By Services, 2021 Figure 151: GCC Countries Cloud Access Security Brokers Market Value (US$ Mn) and Forecast, 2022-2032 Figure 152: GCC Countries Cloud Access Security Brokers Market Share, By Software Type, 2021 Figure 153: GCC Countries Cloud Access Security Brokers Market Share, By Cloud Deployment Type, 2021 Figure 154: GCC Countries Cloud Access Security Brokers Market Share, By Services, 2021 Figure 155: Southern Africa Cloud Access Security Brokers Market Value (US$ Mn) and Forecast, 2022-2032 Figure 156: Southern Africa Cloud Access Security Brokers Market Share, By Software Type, 2021 Figure 157: Southern Africa Cloud Access Security Brokers Market Share, By Cloud Deployment Type, 2021 Figure 158: Southern Africa Cloud Access Security Brokers Market Share, By Services, 2021 Figure 159: Rest of Middle East & Africa Cloud Access Security Brokers Market Value (US$ Mn) and Forecast, 2022-2032 Figure 160: Rest of Middle East & Africa Cloud Access Security Brokers Market Share, By Software Type, 2021 Figure 161: Rest of Middle East & Africa Cloud Access Security Brokers Market Share, By Cloud Deployment Type, 2021 Figure 162: Rest of Middle East & Africa Cloud Access Security Brokers Market Share, By Services, 2021
Need specific information?
Request CustomizationExplore Technology Insights
View Reports