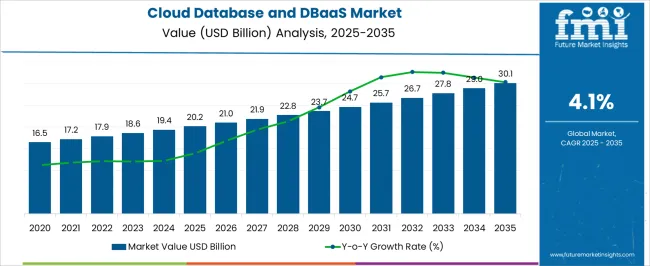
The cloud database and DBaaS market size is projected to be valued at USD 18,611.2 million in 2023 and is expected to rise to USD 69,806.5 million by 2033. The sales of cloud databases and DBaaS are anticipated to expand at a significant CAGR of 14.1% during the forecast period. Various factors propelling the demand for Cloud Database and DBaaS market are discussed below.
In order to reduce the operational costs and enhance efficiency, companies in the sectors like healthcare, banking and insurance implement cloud databases and DBaaS solutions as these companies rely heavily on their websites. Meanwhile, industries such as social networking, online music and online gaming are attracting huge demand for cloud databases and DBaaS due to the large amount of data storing and downloading.
Cost savings, accessibility, upgrading, faultless incorporation, and leanness are all motivating firms to use cloud databases in their operations. This is anticipated to boost the sales of cloud databases and DBaaS during the forecast period.
Attribute | Details |
---|---|
Cloud Database and DBaaS Market Estimated Size (2023) | USD 18,611.2 million |
Cloud Database and DBaaS Market CAGR (2023 to 2033) | 14.1% |
Cloud Database and DBaaS Market Forecasted Size (2033) | USD 69,806.5 million |
Businesses are seeing an insane amount of demand for cloud databases and DBaaS due to heavy rise in data storage after the pandemic. Increasing number of people started visiting different online channels such as gaming sites, music among others. Hence, the market is likely to grow significantly.
In order to comprehend and handle the insights evaluated from massive datasets, the demand of cloud databases and DBaaS among businesses is increasing. These businesses are analyzing this data to earn competitive edge in the market. Cloud database and DBaaS fulfills the demand these businesses are looking for, increasing the demand of these solutions.
The demand for cloud databases and DBaaS is also growing as moving to the cloud reduces the cost of maintaining a sprawling, continually increasing database architecture.
Physical infrastructure expenditures become obsolete, and non-peak consumption hours can be scaled down effortlessly and economically. Due to these factors, the sales of cloud database and DBaaS is anticipated to rise, contributing to the overall growth of the cloud database and DBaaS market.
Cloud database providers' built-in security capabilities improve enterprise network security, which is a key factor propelling the demand for cloud database and DBaaS solutions during the forecast period. Default data encryption, integrated identity, access management controls, and regulatory compliance tools are a few other factors responsible for growing sales of cloud databases and DBaaS solutions.
The key advantage of moving to a cloud-based database architecture from a largely on-premises database solution for many enterprises is accessibility. This is anticipated to boost the global market for cloud databases and DBaaS as the global corporate sector rises from the pandemic of 2020 with a renewed focus on remote work arrangements.
Cloud databases and DBaaS can be scaled up or down based on actual usage, as opposed to purchasing physical database capacity in anticipation of future needs that may or may not arise.
The demand for cloud databases and DBaaS is increasing since these solutions are simple to set up and less expensive, allowing businesses to develop business continuity plans that can be implemented automatically in the case of a network failure.
The sales of cloud databases and DBaaS solutions are built with disaster recovery in mind. Data is replicated between servers, allowing businesses to access information instantly, decreasing downtime and productivity. These factors combined aid in the development of cloud databases and DBaaS market share.
The demand for cloud databases and DBaaS is rising as encrypted cloud databases are significant for distributed workforces, such as remote workers and worldwide enterprises with multiple locations. As a result, the sales of cloud databases and DBaaS solutions are likely to rise.
Public cloud segment hold 43.4% market share in the year 2022. Big Data as a Service (BDaaS) can be set up using a public cloud, private cloud, or hybrid cloud. A public cloud works like regular cloud computing, where a service provider offers resources like virtual machines (VMs), applications, and storage over the Internet. These services can be free or on a pay-per-use basis.
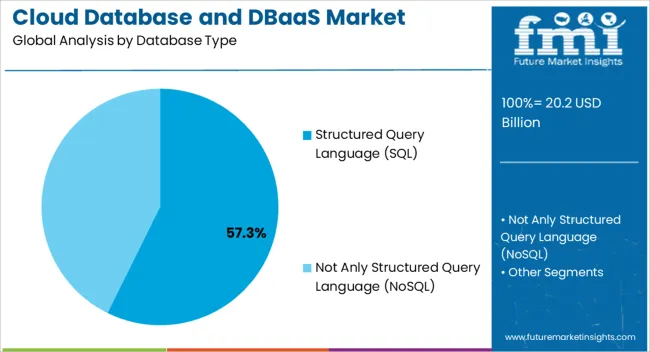
The structured query language segment is anticipated to have a commanding share of 55.5% in the cloud databases and the DBaaS market.
For a long time, relational databases have dominated multiple verticals, providing varied mechanisms for data storage, concurrency control, and transaction.
It has also provided standard interfaces for data and reporting integration. Structured Query Language is a relational database's application program interface (API) and standard user. The SQL database allows you to access managed relational databases on demand.
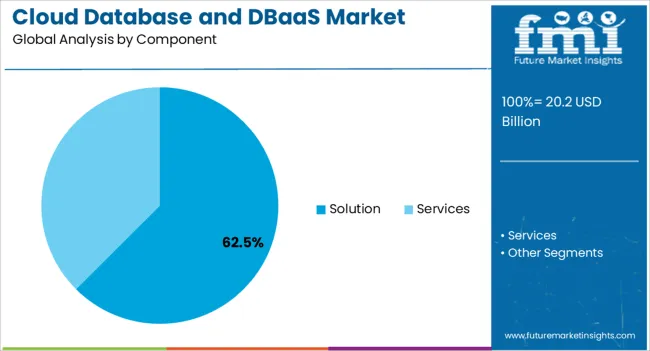
In the cloud database and Database-as-a-Service (DBaaS) market, solutions are offered as components that enable organizations to build and customize their database environments. These solutions provide specific functionalities and capabilities to enhance database management and operations.
The United Kingdom cloud database and DBaaS industry are helping to stabilize and see vital prospects thanks to important government regulations and funding to support research and development projects in the ICT industry.
Leading companies are investing hugely to incorporate AI into their products across a range of industries. These industries are telecommunications, consumer electronics, and automobiles, which are significant elements affecting sector sales.
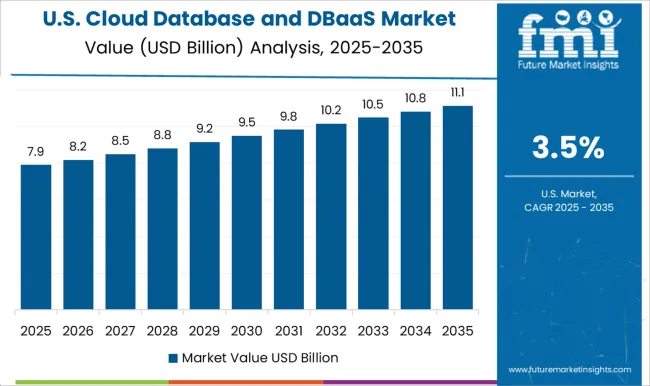
The United States and Canada are likely to influence North America’s cloud databases and the DBaaS market with a CAGR of 13.8%. The region's businesses are the most forward-thinking in terms of AI, machine learning, and cloud adoption, propelling the cloud databases and DBaaS market's growth.
China is also anticipated to show promising growth potential in the cloud databases and DBaaS market. During the forecast period, China's cloud databases and DBaaS market is anticipated to expand steadily with a CAGR of 13.4%. Technological advancements and smooth government regulations in the region are likely to be the driving factors in the cloud databases and DBaaS market.
In India, the potential of cloud database and DBaaS is quite high as the market is growing rapidly at 15.4% CAGR. The country is developing rapidly in the market due to its growing IT industry, healthier business environment and increase in digitization. These factors have empowered the adoption of cloud-based database solutions.
The cloud database and database-as-a-service market is fragmented due to the presence of numerous solutions providers including global and regional companies. Hence, the companies in are working to grow their global footprint by making strategic partnerships, collaborations and product launches.
Attribute | Details |
---|---|
Growth Rate | CAGR of 14.1% from 2023 to 2033 |
Base Year of Estimation | 2023 |
Historical Data | 2018 to 2022 |
Forecast Period | 2023 to 2033 |
Quantitative Units | Revenue in USD million and Volume in Units and F-CAGR from 2023 to 2033 |
Report Coverage | Revenue Forecast, Volume Forecast, Company Ranking, Competitive Landscape, growth factors, Trends, and Pricing Analysis |
Key Segments Covered | Database Type, Component, Service, Vertical, Organization Size, By Region |
Regions Covered | North America; Latin America; Europe; East Asia; South Asia; The Middle East & Africa; Oceania |
Key Countries Profiled | The United States, Canada, Brazil, Mexico, Germany, Italy, France, The United Kingdom, Spain, Russia, China, Japan, India, GCC Countries, Australia |
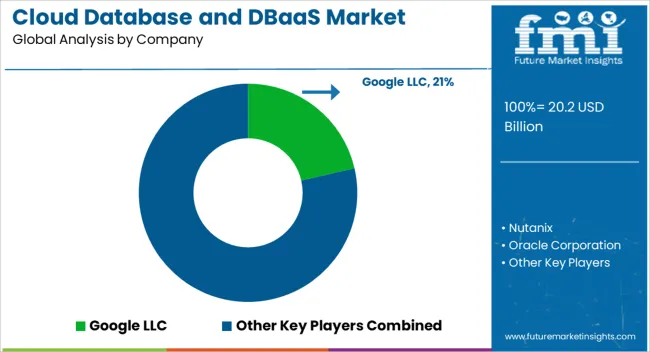
Key Companies Profiled | Google LLC; Nutanix; Oracle Corporation; IBM Corporation; SAP SE; Amazon Web Services, Inc.; Alibaba Cloud; MongoDB, Inc.; Microsoft Corp.; Teradata; Ninox Software GmbH; DataStax |
Customization & Pricing | Available upon Request |
Table 1: Global Market Value (US$ Million) Forecast by Region, 2018 to 2033
Table 2: Global Market Value (US$ Million) Forecast by Database Type, 2018 to 2033
Table 3: Global Market Value (US$ Million) Forecast by Component, 2018 to 2033
Table 4: Global Market Value (US$ Million) Forecast by Service , 2018 to 2033
Table 5: Global Market Value (US$ Million) Forecast by Deployment Model, 2018 to 2033
Table 6: Global Market Value (US$ Million) Forecast by Organization Size, 2018 to 2033
Table 7: Global Market Value (US$ Million) Forecast by Vertical, 2018 to 2033
Table 8: North America Market Value (US$ Million) Forecast by Country, 2018 to 2033
Table 9: North America Market Value (US$ Million) Forecast by Database Type, 2018 to 2033
Table 10: North America Market Value (US$ Million) Forecast by Component, 2018 to 2033
Table 11: North America Market Value (US$ Million) Forecast by Service , 2018 to 2033
Table 12: North America Market Value (US$ Million) Forecast by Deployment Model, 2018 to 2033
Table 13: North America Market Value (US$ Million) Forecast by Organization Size, 2018 to 2033
Table 14: North America Market Value (US$ Million) Forecast by Vertical, 2018 to 2033
Table 15: Latin America Market Value (US$ Million) Forecast by Country, 2018 to 2033
Table 16: Latin America Market Value (US$ Million) Forecast by Database Type, 2018 to 2033
Table 17: Latin America Market Value (US$ Million) Forecast by Component, 2018 to 2033
Table 18: Latin America Market Value (US$ Million) Forecast by Service , 2018 to 2033
Table 19: Latin America Market Value (US$ Million) Forecast by Deployment Model, 2018 to 2033
Table 20: Latin America Market Value (US$ Million) Forecast by Organization Size, 2018 to 2033
Table 21: Latin America Market Value (US$ Million) Forecast by Vertical, 2018 to 2033
Table 22: Europe Market Value (US$ Million) Forecast by Country, 2018 to 2033
Table 23: Europe Market Value (US$ Million) Forecast by Database Type, 2018 to 2033
Table 24: Europe Market Value (US$ Million) Forecast by Component, 2018 to 2033
Table 25: Europe Market Value (US$ Million) Forecast by Service , 2018 to 2033
Table 26: Europe Market Value (US$ Million) Forecast by Deployment Model, 2018 to 2033
Table 27: Europe Market Value (US$ Million) Forecast by Organization Size, 2018 to 2033
Table 28: Europe Market Value (US$ Million) Forecast by Vertical, 2018 to 2033
Table 29: South Asia Market Value (US$ Million) Forecast by Country, 2018 to 2033
Table 30: South Asia Market Value (US$ Million) Forecast by Database Type, 2018 to 2033
Table 31: South Asia Market Value (US$ Million) Forecast by Component, 2018 to 2033
Table 32: South Asia Market Value (US$ Million) Forecast by Service , 2018 to 2033
Table 33: South Asia Market Value (US$ Million) Forecast by Deployment Model, 2018 to 2033
Table 34: South Asia Market Value (US$ Million) Forecast by Organization Size, 2018 to 2033
Table 35: South Asia Market Value (US$ Million) Forecast by Vertical, 2018 to 2033
Table 36: East Asia Market Value (US$ Million) Forecast by Country, 2018 to 2033
Table 37: East Asia Market Value (US$ Million) Forecast by Database Type, 2018 to 2033
Table 38: East Asia Market Value (US$ Million) Forecast by Component, 2018 to 2033
Table 39: East Asia Market Value (US$ Million) Forecast by Service , 2018 to 2033
Table 40: East Asia Market Value (US$ Million) Forecast by Deployment Model, 2018 to 2033
Table 41: East Asia Market Value (US$ Million) Forecast by Organization Size, 2018 to 2033
Table 42: East Asia Market Value (US$ Million) Forecast by Vertical, 2018 to 2033
Table 43: Oceania Market Value (US$ Million) Forecast by Country, 2018 to 2033
Table 44: Oceania Market Value (US$ Million) Forecast by Database Type, 2018 to 2033
Table 45: Oceania Market Value (US$ Million) Forecast by Component, 2018 to 2033
Table 46: Oceania Market Value (US$ Million) Forecast by Service , 2018 to 2033
Table 47: Oceania Market Value (US$ Million) Forecast by Deployment Model, 2018 to 2033
Table 48: Oceania Market Value (US$ Million) Forecast by Organization Size, 2018 to 2033
Table 49: Oceania Market Value (US$ Million) Forecast by Vertical, 2018 to 2033
Table 50: MEA Market Value (US$ Million) Forecast by Country, 2018 to 2033
Table 51: MEA Market Value (US$ Million) Forecast by Database Type, 2018 to 2033
Table 52: MEA Market Value (US$ Million) Forecast by Component, 2018 to 2033
Table 53: MEA Market Value (US$ Million) Forecast by Service , 2018 to 2033
Table 54: MEA Market Value (US$ Million) Forecast by Deployment Model, 2018 to 2033
Table 55: MEA Market Value (US$ Million) Forecast by Organization Size, 2018 to 2033
Table 56: MEA Market Value (US$ Million) Forecast by Vertical, 2018 to 2033
Figure 1: Global Market Value (US$ Million) by Database Type, 2023 to 2033
Figure 2: Global Market Value (US$ Million) by Component, 2023 to 2033
Figure 3: Global Market Value (US$ Million) by Service , 2023 to 2033
Figure 4: Global Market Value (US$ Million) by Deployment Model, 2023 to 2033
Figure 5: Global Market Value (US$ Million) by Organization Size, 2023 to 2033
Figure 6: Global Market Value (US$ Million) by Vertical, 2023 to 2033
Figure 7: Global Market Value (US$ Million) by Region, 2023 to 2033
Figure 8: Global Market Value (US$ Million) Analysis by Region, 2018 to 2033
Figure 9: Global Market Value Share (%) and BPS Analysis by Region, 2023 to 2033
Figure 10: Global Market Y-o-Y Growth (%) Projections by Region, 2023 to 2033
Figure 11: Global Market Value (US$ Million) Analysis by Database Type, 2018 to 2033
Figure 12: Global Market Value Share (%) and BPS Analysis by Database Type, 2023 to 2033
Figure 13: Global Market Y-o-Y Growth (%) Projections by Database Type, 2023 to 2033
Figure 14: Global Market Value (US$ Million) Analysis by Component, 2018 to 2033
Figure 15: Global Market Value Share (%) and BPS Analysis by Component, 2023 to 2033
Figure 16: Global Market Y-o-Y Growth (%) Projections by Component, 2023 to 2033
Figure 17: Global Market Value (US$ Million) Analysis by Service , 2018 to 2033
Figure 18: Global Market Value Share (%) and BPS Analysis by Service , 2023 to 2033
Figure 19: Global Market Y-o-Y Growth (%) Projections by Service , 2023 to 2033
Figure 20: Global Market Value (US$ Million) Analysis by Deployment Model, 2018 to 2033
Figure 21: Global Market Value Share (%) and BPS Analysis by Deployment Model, 2023 to 2033
Figure 22: Global Market Y-o-Y Growth (%) Projections by Deployment Model, 2023 to 2033
Figure 23: Global Market Value (US$ Million) Analysis by Organization Size, 2018 to 2033
Figure 24: Global Market Value Share (%) and BPS Analysis by Organization Size, 2023 to 2033
Figure 25: Global Market Y-o-Y Growth (%) Projections by Organization Size, 2023 to 2033
Figure 26: Global Market Value (US$ Million) Analysis by Vertical, 2018 to 2033
Figure 27: Global Market Value Share (%) and BPS Analysis by Vertical, 2023 to 2033
Figure 28: Global Market Y-o-Y Growth (%) Projections by Vertical, 2023 to 2033
Figure 29: Global Market Attractiveness by Database Type, 2023 to 2033
Figure 30: Global Market Attractiveness by Component, 2023 to 2033
Figure 31: Global Market Attractiveness by Service , 2023 to 2033
Figure 32: Global Market Attractiveness by Deployment Model, 2023 to 2033
Figure 33: Global Market Attractiveness by Organization Size, 2023 to 2033
Figure 34: Global Market Attractiveness by Vertical, 2023 to 2033
Figure 35: Global Market Attractiveness by Region, 2023 to 2033
Figure 36: North America Market Value (US$ Million) by Database Type, 2023 to 2033
Figure 37: North America Market Value (US$ Million) by Component, 2023 to 2033
Figure 38: North America Market Value (US$ Million) by Service , 2023 to 2033
Figure 39: North America Market Value (US$ Million) by Deployment Model, 2023 to 2033
Figure 40: North America Market Value (US$ Million) by Organization Size, 2023 to 2033
Figure 41: North America Market Value (US$ Million) by Vertical, 2023 to 2033
Figure 42: North America Market Value (US$ Million) by Country, 2023 to 2033
Figure 43: North America Market Value (US$ Million) Analysis by Country, 2018 to 2033
Figure 44: North America Market Value Share (%) and BPS Analysis by Country, 2023 to 2033
Figure 45: North America Market Y-o-Y Growth (%) Projections by Country, 2023 to 2033
Figure 46: North America Market Value (US$ Million) Analysis by Database Type, 2018 to 2033
Figure 47: North America Market Value Share (%) and BPS Analysis by Database Type, 2023 to 2033
Figure 48: North America Market Y-o-Y Growth (%) Projections by Database Type, 2023 to 2033
Figure 49: North America Market Value (US$ Million) Analysis by Component, 2018 to 2033
Figure 50: North America Market Value Share (%) and BPS Analysis by Component, 2023 to 2033
Figure 51: North America Market Y-o-Y Growth (%) Projections by Component, 2023 to 2033
Figure 52: North America Market Value (US$ Million) Analysis by Service , 2018 to 2033
Figure 53: North America Market Value Share (%) and BPS Analysis by Service , 2023 to 2033
Figure 54: North America Market Y-o-Y Growth (%) Projections by Service , 2023 to 2033
Figure 55: North America Market Value (US$ Million) Analysis by Deployment Model, 2018 to 2033
Figure 56: North America Market Value Share (%) and BPS Analysis by Deployment Model, 2023 to 2033
Figure 57: North America Market Y-o-Y Growth (%) Projections by Deployment Model, 2023 to 2033
Figure 58: North America Market Value (US$ Million) Analysis by Organization Size, 2018 to 2033
Figure 59: North America Market Value Share (%) and BPS Analysis by Organization Size, 2023 to 2033
Figure 60: North America Market Y-o-Y Growth (%) Projections by Organization Size, 2023 to 2033
Figure 61: North America Market Value (US$ Million) Analysis by Vertical, 2018 to 2033
Figure 62: North America Market Value Share (%) and BPS Analysis by Vertical, 2023 to 2033
Figure 63: North America Market Y-o-Y Growth (%) Projections by Vertical, 2023 to 2033
Figure 64: North America Market Attractiveness by Database Type, 2023 to 2033
Figure 65: North America Market Attractiveness by Component, 2023 to 2033
Figure 66: North America Market Attractiveness by Service , 2023 to 2033
Figure 67: North America Market Attractiveness by Deployment Model, 2023 to 2033
Figure 68: North America Market Attractiveness by Organization Size, 2023 to 2033
Figure 69: North America Market Attractiveness by Vertical, 2023 to 2033
Figure 70: North America Market Attractiveness by Country, 2023 to 2033
Figure 71: Latin America Market Value (US$ Million) by Database Type, 2023 to 2033
Figure 72: Latin America Market Value (US$ Million) by Component, 2023 to 2033
Figure 73: Latin America Market Value (US$ Million) by Service , 2023 to 2033
Figure 74: Latin America Market Value (US$ Million) by Deployment Model, 2023 to 2033
Figure 75: Latin America Market Value (US$ Million) by Organization Size, 2023 to 2033
Figure 76: Latin America Market Value (US$ Million) by Vertical, 2023 to 2033
Figure 77: Latin America Market Value (US$ Million) by Country, 2023 to 2033
Figure 78: Latin America Market Value (US$ Million) Analysis by Country, 2018 to 2033
Figure 79: Latin America Market Value Share (%) and BPS Analysis by Country, 2023 to 2033
Figure 80: Latin America Market Y-o-Y Growth (%) Projections by Country, 2023 to 2033
Figure 81: Latin America Market Value (US$ Million) Analysis by Database Type, 2018 to 2033
Figure 82: Latin America Market Value Share (%) and BPS Analysis by Database Type, 2023 to 2033
Figure 83: Latin America Market Y-o-Y Growth (%) Projections by Database Type, 2023 to 2033
Figure 84: Latin America Market Value (US$ Million) Analysis by Component, 2018 to 2033
Figure 85: Latin America Market Value Share (%) and BPS Analysis by Component, 2023 to 2033
Figure 86: Latin America Market Y-o-Y Growth (%) Projections by Component, 2023 to 2033
Figure 87: Latin America Market Value (US$ Million) Analysis by Service , 2018 to 2033
Figure 88: Latin America Market Value Share (%) and BPS Analysis by Service , 2023 to 2033
Figure 89: Latin America Market Y-o-Y Growth (%) Projections by Service , 2023 to 2033
Figure 90: Latin America Market Value (US$ Million) Analysis by Deployment Model, 2018 to 2033
Figure 91: Latin America Market Value Share (%) and BPS Analysis by Deployment Model, 2023 to 2033
Figure 92: Latin America Market Y-o-Y Growth (%) Projections by Deployment Model, 2023 to 2033
Figure 93: Latin America Market Value (US$ Million) Analysis by Organization Size, 2018 to 2033
Figure 94: Latin America Market Value Share (%) and BPS Analysis by Organization Size, 2023 to 2033
Figure 95: Latin America Market Y-o-Y Growth (%) Projections by Organization Size, 2023 to 2033
Figure 96: Latin America Market Value (US$ Million) Analysis by Vertical, 2018 to 2033
Figure 97: Latin America Market Value Share (%) and BPS Analysis by Vertical, 2023 to 2033
Figure 98: Latin America Market Y-o-Y Growth (%) Projections by Vertical, 2023 to 2033
Figure 99: Latin America Market Attractiveness by Database Type, 2023 to 2033
Figure 100: Latin America Market Attractiveness by Component, 2023 to 2033
Figure 101: Latin America Market Attractiveness by Service , 2023 to 2033
Figure 102: Latin America Market Attractiveness by Deployment Model, 2023 to 2033
Figure 103: Latin America Market Attractiveness by Organization Size, 2023 to 2033
Figure 104: Latin America Market Attractiveness by Vertical, 2023 to 2033
Figure 105: Latin America Market Attractiveness by Country, 2023 to 2033
Figure 106: Europe Market Value (US$ Million) by Database Type, 2023 to 2033
Figure 107: Europe Market Value (US$ Million) by Component, 2023 to 2033
Figure 108: Europe Market Value (US$ Million) by Service , 2023 to 2033
Figure 109: Europe Market Value (US$ Million) by Deployment Model, 2023 to 2033
Figure 110: Europe Market Value (US$ Million) by Organization Size, 2023 to 2033
Figure 111: Europe Market Value (US$ Million) by Vertical, 2023 to 2033
Figure 112: Europe Market Value (US$ Million) by Country, 2023 to 2033
Figure 113: Europe Market Value (US$ Million) Analysis by Country, 2018 to 2033
Figure 114: Europe Market Value Share (%) and BPS Analysis by Country, 2023 to 2033
Figure 115: Europe Market Y-o-Y Growth (%) Projections by Country, 2023 to 2033
Figure 116: Europe Market Value (US$ Million) Analysis by Database Type, 2018 to 2033
Figure 117: Europe Market Value Share (%) and BPS Analysis by Database Type, 2023 to 2033
Figure 118: Europe Market Y-o-Y Growth (%) Projections by Database Type, 2023 to 2033
Figure 119: Europe Market Value (US$ Million) Analysis by Component, 2018 to 2033
Figure 120: Europe Market Value Share (%) and BPS Analysis by Component, 2023 to 2033
Figure 121: Europe Market Y-o-Y Growth (%) Projections by Component, 2023 to 2033
Figure 122: Europe Market Value (US$ Million) Analysis by Service , 2018 to 2033
Figure 123: Europe Market Value Share (%) and BPS Analysis by Service , 2023 to 2033
Figure 124: Europe Market Y-o-Y Growth (%) Projections by Service , 2023 to 2033
Figure 125: Europe Market Value (US$ Million) Analysis by Deployment Model, 2018 to 2033
Figure 126: Europe Market Value Share (%) and BPS Analysis by Deployment Model, 2023 to 2033
Figure 127: Europe Market Y-o-Y Growth (%) Projections by Deployment Model, 2023 to 2033
Figure 128: Europe Market Value (US$ Million) Analysis by Organization Size, 2018 to 2033
Figure 129: Europe Market Value Share (%) and BPS Analysis by Organization Size, 2023 to 2033
Figure 130: Europe Market Y-o-Y Growth (%) Projections by Organization Size, 2023 to 2033
Figure 131: Europe Market Value (US$ Million) Analysis by Vertical, 2018 to 2033
Figure 132: Europe Market Value Share (%) and BPS Analysis by Vertical, 2023 to 2033
Figure 133: Europe Market Y-o-Y Growth (%) Projections by Vertical, 2023 to 2033
Figure 134: Europe Market Attractiveness by Database Type, 2023 to 2033
Figure 135: Europe Market Attractiveness by Component, 2023 to 2033
Figure 136: Europe Market Attractiveness by Service , 2023 to 2033
Figure 137: Europe Market Attractiveness by Deployment Model, 2023 to 2033
Figure 138: Europe Market Attractiveness by Organization Size, 2023 to 2033
Figure 139: Europe Market Attractiveness by Vertical, 2023 to 2033
Figure 140: Europe Market Attractiveness by Country, 2023 to 2033
Figure 141: South Asia Market Value (US$ Million) by Database Type, 2023 to 2033
Figure 142: South Asia Market Value (US$ Million) by Component, 2023 to 2033
Figure 143: South Asia Market Value (US$ Million) by Service , 2023 to 2033
Figure 144: South Asia Market Value (US$ Million) by Deployment Model, 2023 to 2033
Figure 145: South Asia Market Value (US$ Million) by Organization Size, 2023 to 2033
Figure 146: South Asia Market Value (US$ Million) by Vertical, 2023 to 2033
Figure 147: South Asia Market Value (US$ Million) by Country, 2023 to 2033
Figure 148: South Asia Market Value (US$ Million) Analysis by Country, 2018 to 2033
Figure 149: South Asia Market Value Share (%) and BPS Analysis by Country, 2023 to 2033
Figure 150: South Asia Market Y-o-Y Growth (%) Projections by Country, 2023 to 2033
Figure 151: South Asia Market Value (US$ Million) Analysis by Database Type, 2018 to 2033
Figure 152: South Asia Market Value Share (%) and BPS Analysis by Database Type, 2023 to 2033
Figure 153: South Asia Market Y-o-Y Growth (%) Projections by Database Type, 2023 to 2033
Figure 154: South Asia Market Value (US$ Million) Analysis by Component, 2018 to 2033
Figure 155: South Asia Market Value Share (%) and BPS Analysis by Component, 2023 to 2033
Figure 156: South Asia Market Y-o-Y Growth (%) Projections by Component, 2023 to 2033
Figure 157: South Asia Market Value (US$ Million) Analysis by Service , 2018 to 2033
Figure 158: South Asia Market Value Share (%) and BPS Analysis by Service , 2023 to 2033
Figure 159: South Asia Market Y-o-Y Growth (%) Projections by Service , 2023 to 2033
Figure 160: South Asia Market Value (US$ Million) Analysis by Deployment Model, 2018 to 2033
Figure 161: South Asia Market Value Share (%) and BPS Analysis by Deployment Model, 2023 to 2033
Figure 162: South Asia Market Y-o-Y Growth (%) Projections by Deployment Model, 2023 to 2033
Figure 163: South Asia Market Value (US$ Million) Analysis by Organization Size, 2018 to 2033
Figure 164: South Asia Market Value Share (%) and BPS Analysis by Organization Size, 2023 to 2033
Figure 165: South Asia Market Y-o-Y Growth (%) Projections by Organization Size, 2023 to 2033
Figure 166: South Asia Market Value (US$ Million) Analysis by Vertical, 2018 to 2033
Figure 167: South Asia Market Value Share (%) and BPS Analysis by Vertical, 2023 to 2033
Figure 168: South Asia Market Y-o-Y Growth (%) Projections by Vertical, 2023 to 2033
Figure 169: South Asia Market Attractiveness by Database Type, 2023 to 2033
Figure 170: South Asia Market Attractiveness by Component, 2023 to 2033
Figure 171: South Asia Market Attractiveness by Service , 2023 to 2033
Figure 172: South Asia Market Attractiveness by Deployment Model, 2023 to 2033
Figure 173: South Asia Market Attractiveness by Organization Size, 2023 to 2033
Figure 174: South Asia Market Attractiveness by Vertical, 2023 to 2033
Figure 175: South Asia Market Attractiveness by Country, 2023 to 2033
Figure 176: East Asia Market Value (US$ Million) by Database Type, 2023 to 2033
Figure 177: East Asia Market Value (US$ Million) by Component, 2023 to 2033
Figure 178: East Asia Market Value (US$ Million) by Service , 2023 to 2033
Figure 179: East Asia Market Value (US$ Million) by Deployment Model, 2023 to 2033
Figure 180: East Asia Market Value (US$ Million) by Organization Size, 2023 to 2033
Figure 181: East Asia Market Value (US$ Million) by Vertical, 2023 to 2033
Figure 182: East Asia Market Value (US$ Million) by Country, 2023 to 2033
Figure 183: East Asia Market Value (US$ Million) Analysis by Country, 2018 to 2033
Figure 184: East Asia Market Value Share (%) and BPS Analysis by Country, 2023 to 2033
Figure 185: East Asia Market Y-o-Y Growth (%) Projections by Country, 2023 to 2033
Figure 186: East Asia Market Value (US$ Million) Analysis by Database Type, 2018 to 2033
Figure 187: East Asia Market Value Share (%) and BPS Analysis by Database Type, 2023 to 2033
Figure 188: East Asia Market Y-o-Y Growth (%) Projections by Database Type, 2023 to 2033
Figure 189: East Asia Market Value (US$ Million) Analysis by Component, 2018 to 2033
Figure 190: East Asia Market Value Share (%) and BPS Analysis by Component, 2023 to 2033
Figure 191: East Asia Market Y-o-Y Growth (%) Projections by Component, 2023 to 2033
Figure 192: East Asia Market Value (US$ Million) Analysis by Service , 2018 to 2033
Figure 193: East Asia Market Value Share (%) and BPS Analysis by Service , 2023 to 2033
Figure 194: East Asia Market Y-o-Y Growth (%) Projections by Service , 2023 to 2033
Figure 195: East Asia Market Value (US$ Million) Analysis by Deployment Model, 2018 to 2033
Figure 196: East Asia Market Value Share (%) and BPS Analysis by Deployment Model, 2023 to 2033
Figure 197: East Asia Market Y-o-Y Growth (%) Projections by Deployment Model, 2023 to 2033
Figure 198: East Asia Market Value (US$ Million) Analysis by Organization Size, 2018 to 2033
Figure 199: East Asia Market Value Share (%) and BPS Analysis by Organization Size, 2023 to 2033
Figure 200: East Asia Market Y-o-Y Growth (%) Projections by Organization Size, 2023 to 2033
Figure 201: East Asia Market Value (US$ Million) Analysis by Vertical, 2018 to 2033
Figure 202: East Asia Market Value Share (%) and BPS Analysis by Vertical, 2023 to 2033
Figure 203: East Asia Market Y-o-Y Growth (%) Projections by Vertical, 2023 to 2033
Figure 204: East Asia Market Attractiveness by Database Type, 2023 to 2033
Figure 205: East Asia Market Attractiveness by Component, 2023 to 2033
Figure 206: East Asia Market Attractiveness by Service , 2023 to 2033
Figure 207: East Asia Market Attractiveness by Deployment Model, 2023 to 2033
Figure 208: East Asia Market Attractiveness by Organization Size, 2023 to 2033
Figure 209: East Asia Market Attractiveness by Vertical, 2023 to 2033
Figure 210: East Asia Market Attractiveness by Country, 2023 to 2033
Figure 211: Oceania Market Value (US$ Million) by Database Type, 2023 to 2033
Figure 212: Oceania Market Value (US$ Million) by Component, 2023 to 2033
Figure 213: Oceania Market Value (US$ Million) by Service , 2023 to 2033
Figure 214: Oceania Market Value (US$ Million) by Deployment Model, 2023 to 2033
Figure 215: Oceania Market Value (US$ Million) by Organization Size, 2023 to 2033
Figure 216: Oceania Market Value (US$ Million) by Vertical, 2023 to 2033
Figure 217: Oceania Market Value (US$ Million) by Country, 2023 to 2033
Figure 218: Oceania Market Value (US$ Million) Analysis by Country, 2018 to 2033
Figure 219: Oceania Market Value Share (%) and BPS Analysis by Country, 2023 to 2033
Figure 220: Oceania Market Y-o-Y Growth (%) Projections by Country, 2023 to 2033
Figure 221: Oceania Market Value (US$ Million) Analysis by Database Type, 2018 to 2033
Figure 222: Oceania Market Value Share (%) and BPS Analysis by Database Type, 2023 to 2033
Figure 223: Oceania Market Y-o-Y Growth (%) Projections by Database Type, 2023 to 2033
Figure 224: Oceania Market Value (US$ Million) Analysis by Component, 2018 to 2033
Figure 225: Oceania Market Value Share (%) and BPS Analysis by Component, 2023 to 2033
Figure 226: Oceania Market Y-o-Y Growth (%) Projections by Component, 2023 to 2033
Figure 227: Oceania Market Value (US$ Million) Analysis by Service , 2018 to 2033
Figure 228: Oceania Market Value Share (%) and BPS Analysis by Service , 2023 to 2033
Figure 229: Oceania Market Y-o-Y Growth (%) Projections by Service , 2023 to 2033
Figure 230: Oceania Market Value (US$ Million) Analysis by Deployment Model, 2018 to 2033
Figure 231: Oceania Market Value Share (%) and BPS Analysis by Deployment Model, 2023 to 2033
Figure 232: Oceania Market Y-o-Y Growth (%) Projections by Deployment Model, 2023 to 2033
Figure 233: Oceania Market Value (US$ Million) Analysis by Organization Size, 2018 to 2033
Figure 234: Oceania Market Value Share (%) and BPS Analysis by Organization Size, 2023 to 2033
Figure 235: Oceania Market Y-o-Y Growth (%) Projections by Organization Size, 2023 to 2033
Figure 236: Oceania Market Value (US$ Million) Analysis by Vertical, 2018 to 2033
Figure 237: Oceania Market Value Share (%) and BPS Analysis by Vertical, 2023 to 2033
Figure 238: Oceania Market Y-o-Y Growth (%) Projections by Vertical, 2023 to 2033
Figure 239: Oceania Market Attractiveness by Database Type, 2023 to 2033
Figure 240: Oceania Market Attractiveness by Component, 2023 to 2033
Figure 241: Oceania Market Attractiveness by Service , 2023 to 2033
Figure 242: Oceania Market Attractiveness by Deployment Model, 2023 to 2033
Figure 243: Oceania Market Attractiveness by Organization Size, 2023 to 2033
Figure 244: Oceania Market Attractiveness by Vertical, 2023 to 2033
Figure 245: Oceania Market Attractiveness by Country, 2023 to 2033
Figure 246: MEA Market Value (US$ Million) by Database Type, 2023 to 2033
Figure 247: MEA Market Value (US$ Million) by Component, 2023 to 2033
Figure 248: MEA Market Value (US$ Million) by Service , 2023 to 2033
Figure 249: MEA Market Value (US$ Million) by Deployment Model, 2023 to 2033
Figure 250: MEA Market Value (US$ Million) by Organization Size, 2023 to 2033
Figure 251: MEA Market Value (US$ Million) by Vertical, 2023 to 2033
Figure 252: MEA Market Value (US$ Million) by Country, 2023 to 2033
Figure 253: MEA Market Value (US$ Million) Analysis by Country, 2018 to 2033
Figure 254: MEA Market Value Share (%) and BPS Analysis by Country, 2023 to 2033
Figure 255: MEA Market Y-o-Y Growth (%) Projections by Country, 2023 to 2033
Figure 256: MEA Market Value (US$ Million) Analysis by Database Type, 2018 to 2033
Figure 257: MEA Market Value Share (%) and BPS Analysis by Database Type, 2023 to 2033
Figure 258: MEA Market Y-o-Y Growth (%) Projections by Database Type, 2023 to 2033
Figure 259: MEA Market Value (US$ Million) Analysis by Component, 2018 to 2033
Figure 260: MEA Market Value Share (%) and BPS Analysis by Component, 2023 to 2033
Figure 261: MEA Market Y-o-Y Growth (%) Projections by Component, 2023 to 2033
Figure 262: MEA Market Value (US$ Million) Analysis by Service , 2018 to 2033
Figure 263: MEA Market Value Share (%) and BPS Analysis by Service , 2023 to 2033
Figure 264: MEA Market Y-o-Y Growth (%) Projections by Service , 2023 to 2033
Figure 265: MEA Market Value (US$ Million) Analysis by Deployment Model, 2018 to 2033
Figure 266: MEA Market Value Share (%) and BPS Analysis by Deployment Model, 2023 to 2033
Figure 267: MEA Market Y-o-Y Growth (%) Projections by Deployment Model, 2023 to 2033
Figure 268: MEA Market Value (US$ Million) Analysis by Organization Size, 2018 to 2033
Figure 269: MEA Market Value Share (%) and BPS Analysis by Organization Size, 2023 to 2033
Figure 270: MEA Market Y-o-Y Growth (%) Projections by Organization Size, 2023 to 2033
Figure 271: MEA Market Value (US$ Million) Analysis by Vertical, 2018 to 2033
Figure 272: MEA Market Value Share (%) and BPS Analysis by Vertical, 2023 to 2033
Figure 273: MEA Market Y-o-Y Growth (%) Projections by Vertical, 2023 to 2033
Figure 274: MEA Market Attractiveness by Database Type, 2023 to 2033
Figure 275: MEA Market Attractiveness by Component, 2023 to 2033
Figure 276: MEA Market Attractiveness by Service , 2023 to 2033
Figure 277: MEA Market Attractiveness by Deployment Model, 2023 to 2033
Figure 278: MEA Market Attractiveness by Organization Size, 2023 to 2033
Figure 279: MEA Market Attractiveness by Vertical, 2023 to 2033
Figure 280: MEA Market Attractiveness by Country, 2023 to 2033
The market is estimated to secure a valuation of USD 18,611.2 in 2023.
Google LLC, Nutanix, and Oracle Corporation are key Cloud Database and DBaaS market players.
The global market size is to reach USD 69,806.5 million by 2033.
The growth potential of the Cloud Database and DBaaS market is 14.1% through 2033.
Businesses in the region are exceptionally forward-thinking in terms of AI, machine learning, and cloud adoption, encouraging the growth of the cloud databases and DBaaS market.
The public cloud sector held a market share of about 43.4% in 2021.
Explore Similar Insights
Thank you!
You will receive an email from our Business Development Manager. Please be sure to check your SPAM/JUNK folder too.