Virtual Machine Market
Virtual Machine Market by Type, Platform, Enterprise Size, Industry & Region | Forecast 2023 to 2033
Increasing Demand for Virtualization of IT Infrastructure Boosting the Adoption of Virtual Machines- FMI Tracks the Global Adoption of Virtual Machine Products in 20+ High-Growth Markets
Virtual Machine Market Overview (2023 to 2033)
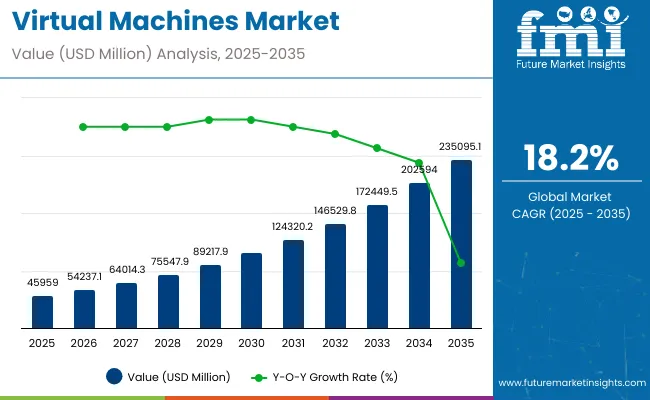
The global virtual machine market is expected to reach a valuation of US$ 177.3 Billion by 2033. The increasing adoption of heavy applications among organizations and the rise in cloud computing technologies across the globe have fueled the demand for virtual machine systems and solutions. Moreover, virtual machines enable time and money saving for businesses.
The adoption of VMs allows businesses to be flexible, create mobile workforces, and virtualize work environments. More and more enterprises are adopting virtual machines due to the simplicity it offers for end users and IT professionals alike. Thus, the increasing adoption of VMs among enterprises across several industries is expected to propel the growth of the virtual machine market.
Virtual Machine Market Value (2023) |
US$ 27.9 Billion |
Virtual Machine Market Forecast Value (2033) |
US$ 177.3 Billion |
Virtual Machine Market CAGR (2023 to 2033) |
20.3% |
Don't pay for what you don't need
Customize your report by selecting specific countries or regions and save 30%!
How will Adoption of Heavy Applications Impact Growth?
The term workload is defined as the amount of work performed by an application in a given period. Every application has limited capability to handle and process work. Several organizations use heavy applications for their business processes. If the assigned applications go beyond the workload capacity, they may take a long time to complete or often it gets crash. It becomes even more severe in cases where a workload requires high compute resources, such as servers or database systems assigned a workload upon creation.
VMs offer an efficient and optimal way to address the problem of heavy workloads, irrespective of platform or industry. Capabilities of a virtual machine include parallel processing of heavy applications to execute intensive workloads of varying sizes, by creating a pool of VMs to tackle these loads. VM offers several options tailored to suit various requirements like RAM, storage, low-cost option, general computing, and data protection. It also enables the running of heavy-memory applications such as SAP, High-Performance Computing (HPC), video encoding, and massive multiplayer games. Thus, driving the virtual machine market forward.
Rising Digitalization and Continuous Growth in IT Infrastructure
Businesses and organizations are finding themselves in an increasingly complex network world. As businesses continue to generate a staggering volume of data on a daily basis, they are looking at transformation through automation and virtualization to optimize the cost and scale of experiences. There is an ongoing trend of using mobile devices, apps, and a variety of collaboration tools to communicate with other teams across geographies, platforms, and devices.
The workforce is transforming the way their employees carry out their daily activities. Enterprises are moving beyond being desktop-centric to a multi-device anywhere, anytime workplace. Furthermore, the changing IT consumption trends and increasing adoption of cloud computing solutions are creating potential growth opportunities for the virtual machine market. Apart from this, the increasing investment by governments of various regions in transforming and digitalizing IT infrastructure is also supporting the growth of the virtual machine market.
Lack of Isolation Affecting Virtual Machines Sales
One of the major factors hampering the growth and adoption of virtual machines is the lack of isolation between multiple VMs. The virtual machine brings several benefits to enterprises. It can enhance IT agility, flexibility, and scalability while creating significant cost savings. However, with several advantages, there are a few key challenges associated with VMs. Lack of isolation between multiple VM instances is one of the major challenges for system administrators, which might obstruct the virtual machine market growth.
Virtual infrastructure platforms include software that can migrate running VM instances from one physical device, which often causes a lapse in app availability. For example, two applications running in two separate VM instances but on the same host compete for a single set of resources on that host. It is well known that because of the lack of proper isolation of some shared resources; a VM may perceive varying performance based on how many other VMs are competing for the same resource.
Some administrators prefer to avoid using virtual machines for running business applications in relatively small organizations. This could be attributed to the lack of isolation between VM instances, which is considered the major challenge in the market.
Cost-Effectiveness to Enable VM Sales
VMs have the ability to transform a physical workplace into a more mobile, flexible workplace where traditional hardware equipment such as storage, networking, and computing resources are replaced with virtual environments, infrastructure, and storage. VMs enables users to access virtual environments from anywhere at any time, allowing businesses to forgo the upfront costs of expensive hardware. Moreover, cloud VMs have one substantial advantage - they only incur costs when they are actually in operation.
For instance, Microsoft Azure, an IaaS-based VM solution can be deployed flexibly and is only billed according to the actual usage. This produces numerous scenarios in which dynamic modifications/provisioning can lead to noticeable cost savings.
Huge workload mobility increased performance and availability of resources, automated operations are some of the key benefits of VMs that make IT simpler to manage and less costly to own and operate. More and more businesses are opting for VMs due to the simplicity for end users and IT professionals alike.
Get the data you need at a Fraction of the cost
Personalize your report by choosing insights you need
and save 40%!
How Will Historical Market (2023) & Future Projections (2033) for Virtual Machine Market Match Up?
Between 2018 and 2022, the global virtual machine market registered a CAGR of 16.6%. The increasing adoption of data science and AI technologies has fueled the demand for virtual machine systems.
Data science is a banquet of data cleaning, analysis, and preparation, an umbrella term for several scientific methodologies to discover hidden patterns in raw data. Data science also involves solving business problems in multidimensional processes deploying prototypes, algorithms, predictive models, and custom analysis.
The structured and unstructured data is exploding through emails, financial transaction numbers, audio files, web pages, business documents, social media messages, and among many more sources. This has created a huge need for flexible solutions for data scientists to explore and build data science models quickly, often more quickly and flexibly than traditional on-premises IT hardware can provide.
VM vendors have created a Data Science Virtual Machine (DSVM), which is a customized image of a VM that is specifically used for doing data science. The platform has many popular data science and other tools pre-installed and pre-configured to jump-start building intelligent applications for advanced analytics.
Data science has become fuel for industries. There are various industries such as banking, finance, manufacturing, transport, e-Commerce, education, etc. that use data science for their business processes.
Thus, organizations across various industries are adopting DSVM solutions to generate meaningful insights from their organizational data.
Historical CAGR (2017 to 2022) |
Forecast CAGR (2023 to 2033) |
16.6% |
20.3% |
Comparative Analysis of Adjacent Markets
Virtual Machine Market:
Differentiating Aspects |
Virtual Machine Market |
CAGR (Forecast Period) |
20.3% |
Market Valuation in 2023 |
US$ 27.9 Billion |
Projected Market Value in 2033 |
US$ 177.3 Billion |
Growth Factors |
Increasing use of these machines across various verticals |
Trends |
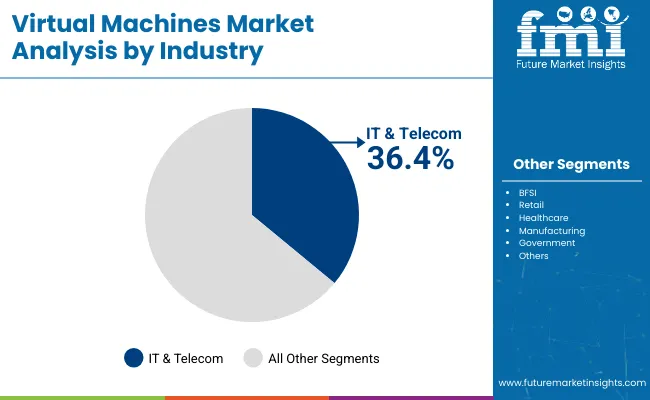
Surging demand for information technology solutions |
Opportunities |
Emerging trends, such as desktop-as-a-service (DaaS), creating new opportunities |
Data As a Service (DAAS) Market:
Differentiating Aspects |
Data As a Service (DAAS) Market |
CAGR (Forecast Period) |
23.2% |
Market Valuation in 2023 |
US$ 10,548.88 Million |
Projected Market Value in 2033 |
US$ 84,979.33 Million |
Growth Factors |
Early adoption of new service models like the DAAS platform |
Trends |
Increasing demand for automation in the company processes |
Opportunities |
Rising investments in the market by key players |
Data Management Platforms Market:
Differentiating Aspects |
Data Management Platforms Market |
CAGR (Forecast Period) |
12.1% |
Market Valuation in 2023 |
US$ 2,117.12 Million |
Projected Market Value in 2033 |
US$ 6,634.40 Million |
Growth Factors |
Surging demand for data collection from several sources like CRM data, POS data, etc. |
Trends |
Rising application of these platforms by advertisers to target clients and meet their demands |
Opportunities |
Development of new and advanced products by corporations |
Market Share Analysis of Virtual Machine Vendors
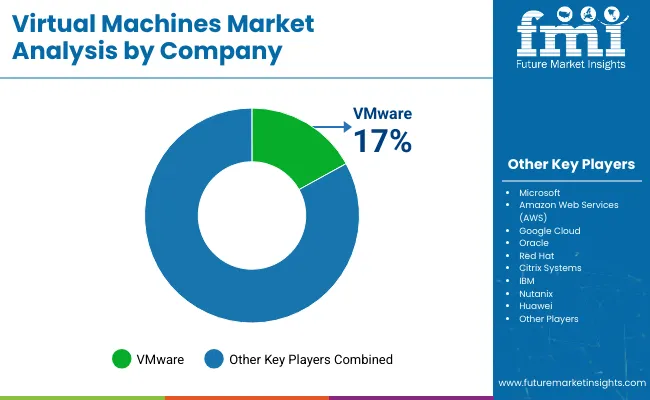
The virtual machine market is highly concentrated. The concentration of the global market may be attributed to the majority share held by prominent virtual machine software vendors. The companies that hold a market share near 50% are tier-1 companies. This group includes players like Amazon Web Services, Microsoft Corporation, Google, and Alibaba Group.
The companies with market shares of above 10% and below 15% are the promising players. These companies are likely to showcase a quick growth trend and harness the opportunities that the global market has to offer to accommodate business expansion and revenue generation. This group includes IBM Corporation, VMware, Hewlett Packard Enterprise, and Citrix.
Companies that have a relatively lower size with a market share worth less than 10% are strategizing to attract new clientele in foreign markets. The companies in this group are Proxmox Server Solutions, Parallels International, and among others.
Country-wise Analysis
Country |
The US |
CAGR (2023 to 2033) |
14.2% |
Market Size (2033) |
US$ 38 Billion |
Country |
The UK |
CAGR (2023 to 2033) |
27.8% |
Market Size (2033) |
US$ 9.3 Billion |
Country |
China |
CAGR (2023 to 2033) |
22.2% |
Market Size (2033) |
US$ 19.5 Billion |
Country |
Japan |
CAGR (2023-2033) |
20.2% |
Market Size (2033) |
US$ 7 Billion |
Country |
South Korea |
CAGR (2023 to 2033) |
18% |
Market Size (2033) |
US$ 2.8 Billion |
US Virtual Machine Market to Grab the Largest Market Share
Attributes |
Details |
Market Size (2033) |
US$ 38 Billion |
Market Absolute Dollar Growth (US$ Million/Billion) |
US$ 27.9 Billion |
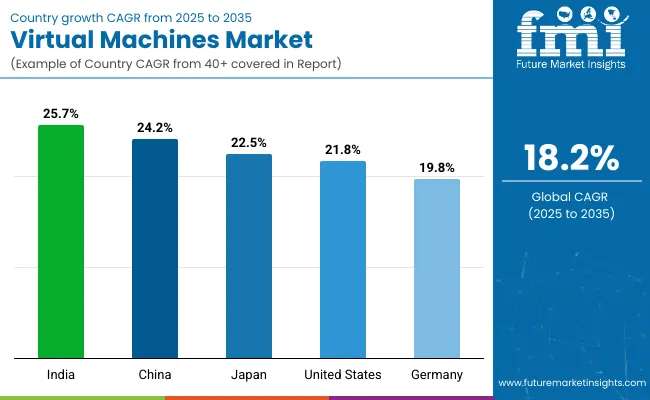
Until 2020, virtual machine value across the United States experienced a Y-o-Y growth of over 11.8% to reach US$ 29.01 Billion. The market is set to further aggrandize at an impressive CAGR of 14.2% through 2033. FMI has projected the US to remain one of the most lucrative markets in North America throughout the course of the forecast period. This could be ascribed to the presence of prominent virtual machine and cloud computing service vendors in the region.
According to estimates, virtual machine adoption in the US is increased by more than 2.5%, as businesses are continuously shifting their entire server virtualization environment to the virtual cloud. Moreover, the increasing demand, specifically from the healthcare and manufacturing sector has propelled the growth of the US virtual machine market.
Historical CAGR (2017 to 2022) |
Forecast CAGR (2023 to 2033) |
13.2% |
14.2% |
Increasing Demand for Virtual Machine Products Across Several Industries Enabling Growth in the UK
Attributes |
Details |
Market Size (2033) |
US$ 9.3 Billion |
Market Absolute Dollar Growth (US$ Million/Billion) |
US$ 8.5 Billion |
As a G7 economy, the UK is among the matured IT and related services markets, the country is one of the most important global markets for cloud computing. With the UK being one of the most advanced global markets for cloud computing, there is a sizeable business ecosystem serving the primary market, for example in data centers and Cloud VMs.
Cloud computing is a key driver of the UK’s data-driven economy, with cloud-based virtual machine platforms, infrastructure, and services supporting UK businesses across every industry and sector.
Moreover, the country exhibits the presence of multiple data centers located across different states. The prominent data center vendors in the country include Amazon, Microsoft, and Google.
The growing demand for virtual machine products across several industries is driving the growth of the UK virtual machine market. The UK virtual machine market is estimated to reach a valuation of 5,614.6 Mn by the end of 2031 by registering a CAGR of 27.5%.
Historical CAGR (2017 to 2022) |
Forecast CAGR (2023 to 2033) |
25.7% |
27.8% |
China's Leading Virtual Machine Providers and Development Trends
Attributes |
Details |
Market Size (2033) |
US$ 19.5 Billion |
Market Absolute Dollar Growth (US$ Million/Billion) |
US$ 16.9 Billion |
China is estimated to record an incremental opportunity surpassing US$ 19.5 Billion by 2033. It is among the world’s largest cloud computing markets. Companies such as Alibaba, Tencent, and Huawei are among the ones best-positioned to capitalize on opportunities prevalent in China.
The IT cloud computing market is growing at a rapid pace. With cloud infrastructure spending set to rise considerably, China will attract several leading market players. Coupled with this, the Chinese government is dedicated to pushing the cloud computing market in the country, creating major business opportunities for virtual machine vendors.
The government is continuously focusing on investing in cloud and related ICT technologies to enhance digital transformation, which in return, would drive the growth of China's virtual machine market.
Historical CAGR (2017 to 2022) |
Forecast CAGR (2023 to 2033) |
21.2% |
22.2% |
Virtual Machine Adoption Trend in India
Cloud computing offers immense potential and benefits for all types of organizations. In India, the adoption of cloud computing is gaining momentum and growing exponentially. The main reason behind the growth is because of the government’s support in embracing emerging latest technologies and best practices. These are derived from different cloud deployment scenarios and application areas.
The Indian cloud computing market is a very vibrant one. The country has the presence of all of the major global cloud providers such as Amazon, Microsoft, IBM, Google, and others. Small and medium-sized businesses in the country are actively migrating to cloud-based virtualization technologies and large enterprises are also following suit.
Category-wise Insights
Taxonomy |
Type |
Top Segment |
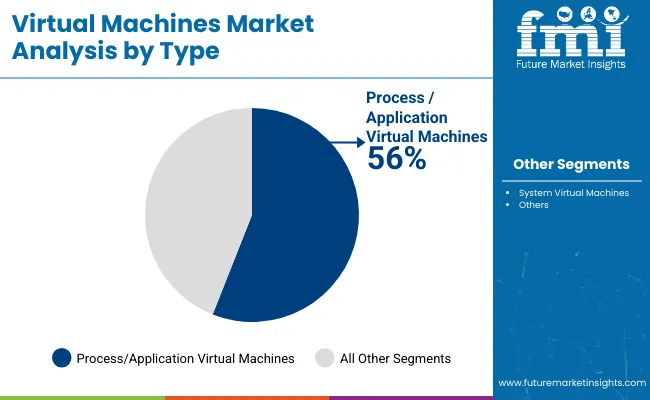
Process/Application Virtual Machines |
Forecast CAGR |
17.1% |
Taxonomy |
Platform |
Top Segment |
Linux |
Forecast CAGR |
16.8% |
Wide Application Spectrum of Linux Platform Driving the Market Expansion
Linux platform is projected to lead the market going forward. The segment is projected to grow at a CAGR of 15%, increasing from the 16.8% CAGR witnessed in the historical period. Linux is more than just an operating system. Recently, Linux is also being used to run desktops, embedded systems, and servers. The Linux system manages various services like process scheduling, basic peripheral devices, application scheduling, file system, etc.
The system offers many benefits over other operating systems like macOS and Windows, thus increasing its uptake in every field. With the expansion of the Linux segment, the virtual machine market size is projected to increase.
Historical CAGR (2017 to 2022) |
Forecast CAGR (2023 to 2033) |
15% |
16.8% |
How will the adoption of Virtual Machines in the Manufacturing Sector Impact Growth?
Technology is constantly changing and computers are more powerful than ever. Manufacturing companies are continuously trying to get the most from their IT-based plant assets. This could be attributed to the presence of aging manufacturing plant infrastructures, tighter regulations, technology upgradation, and numerous other challenges. Companies are trying to focus on having a strategic solution to manage application usage in such a volatile environment that has become a priority for manufacturers.
To deal with these challenges, several manufacturing companies have included VMs in their automation migration plans. VM helps manufacturing companies consolidate multiple physical computers into one and swap data between computers with no downtime. In a virtual environment, manufacturers can simply create a new VM, load the new updated software to it, test it, bring down the running VM with the old software, and bring up the new one.
Moreover, manufacturing companies are leveraging VMs to coordinate different PLCs and HMI systems throughout the plants. VM is rapidly transforming the manufacturing IT landscape, and fundamentally changing the way engineers use hardware resources in manufacturing plants. The technology is gaining traction and is expected that half of all the manufacturing applications will leverage VM in the next 5 years.
Adoption of Virtual Machines in SMEs Creating New Opportunities
The concept of virtualization started out decades ago as a way to make better use of large, expensive, mainframe computers. However, the IT landscape has changed dramatically since then. VMs are continuously been adopted by several businesses irrespective of their sizes to optimize the use of their existing server resources and, in turn, lower IT costs.
Over the past few years, the adoption of virtual machines has increased among mid-sized businesses. With the rise in the number of applications and to manage those across different OS’s, companies are implementing VMs to make better use of hardware, lower costs, and increase business agility. A growing number of VM solutions are emerging that target mid-sized businesses, which helps them optimize their limited IT resources and enable them to focus on their business processes.
Expansion Strategies Employed by Key Players
The market is witnessing expansion in both virtual machines business & virtualization. Companies operating in the virtual machine market rely on multiple expansion strategies to deepen penetration across lucrative markets. These strategies include product launches, collaborations with key players, partnerships, acquisitions, and strengthening of regional and global distribution networks.
- In June 2020, Microsoft announced the availability of its Azure general purpose and memory-optimized Virtual Machines based on the 2nd generation Intel Xeon Platinum 8272CL, to deliver up to ~20 percent CPU performance improvement compared to their predecessors, the Dv3 and Ev3 VM.
- In December 2020, VMware released its new update of VMware vSphere 7. The new update is the most powerful version of VMware vSphere to date and provides the capabilities that organizations need for traditional and modern applications and workloads.
- In November 2020, AWS has announced the new Mac instances (EC2 Mac instances) for Amazon EC2. Built on Mac mini computers, EC2 Mac instances enable customers to run on-demand macOS workloads in the AWS cloud that offers extended flexibility, scalability, and cost benefits of AWS to all Apple developers.
FMI has profiled the following prominent virtual machine providers in its report:
- Microsoft Corporation
- VMware, Inc. (Dell Technologies)
- Amazon Web Services, Inc.
- IBM Corporation
- Oracle Corporation
- Alibaba Group
- Hewlett Packard Enterprise
- Citrix
- Huawei Technologies
- Proxmox Server Solutions GmbH
- Parallels Inc.
Virtual Machine Market Report Scope
Attribute |
Details |
Forecast Period |
2023 to 2033 |
Historical Data Available for |
2018 to 2022 |
Market Analysis |
US$ Billion/Million for Value |
Key Regions Covered |
North America, Latin America, Europe, East Asia, South Asia & Pacific, and Middle East & Africa |
Key Countries Covered |
US, Canada, Germany, Italy, France, UK, Spain, GCC, and South Africa |
Key Segments Covered |
Type, Platform, Enterprise Size, Industry, and Region |
Key Companies Profiled |
|
Key Segments Covered of the Virtual Machine Market
Type:
- Process/Application Virtual Machines
- System Virtual Machines
Platform:
- Windows
- Mac
- Linux
- Others
Enterprise Size:
- Small & Medium Enterprises (SMEs)
- Large Enterprises
Industry:
- BFSI
- IT & Telecom
- Retail
- Healthcare
- Manufacturing
- Government
- Others
Region:
- North America
- Latin America
- Europe
- East Asia
- South Asia & Pacific
- Middle East & Africa (MEA)
Frequently Asked Questions
How much is the Global Virtual Machine Market Worth?
The global market of a virtual machine is projected to reach a valuation of US$ 177.3 Billion by 2033.
Which are the Top Companies Providing Virtual Machine?
Microsoft Corporation and VMware, Inc. (Dell Technologies) are top players in the virtual machine market.
Which Region is Expected to Dominate the Virtual Machine Market?
The US is expected to dominate the virtual machine market throughout the forecast period.
At what CAGR is the Global Virtual Machine Market Projected to Grow in the Forecast Period?
The global market of a virtual machine is projected to grow at approximately a CAGR of 20.3%.
Table of Content
1. Executive Summary | Virtual Machine Market 1.1. Global Market Outlook 1.2. Demand-side Trends 1.3. Supply-side Trends 1.4. Technology Roadmap Analysis 1.5. Analysis and Recommendations 2. Market Overview 2.1. Market Coverage / Taxonomy 2.2. Market Definition / Scope / Limitations 3. Market Background 3.1. Market Dynamics 3.1.1. Drivers 3.1.2. Restraints 3.1.3. Opportunity 3.1.4. Trends 3.2. Scenario Forecast 3.2.1. Demand in Optimistic Scenario 3.2.2. Demand in Likely Scenario 3.2.3. Demand in Conservative Scenario 3.3. Opportunity Map Analysis 3.4. Investment Feasibility Matrix 3.5. PESTLE and Porter’s Analysis 3.6. Regulatory Landscape 3.6.1. By Key Regions 3.6.2. By Key Countries 3.7. Regional Parent Market Outlook 4. Global Market Analysis 2017 to 2022 and Forecast, 2023 to 2033 4.1. Historical Market Size Value (US$ Million) Analysis, 2017 to 2022 4.2. Current and Future Market Size Value (US$ Million) Projections, 2023 to 2033 4.2.1. Y-o-Y Growth Trend Analysis 4.2.2. Absolute $ Opportunity Analysis 5. Global Market Analysis 2017 to 2022 and Forecast 2023 to 2033, By Type 5.1. Introduction / Key Findings 5.2. Historical Market Size Value (US$ Million) Analysis By Type, 2017 to 2022 5.3. Current and Future Market Size Value (US$ Million) Analysis and Forecast By Type, 2023 to 2033 5.3.1. Process/Application Virtual Machines 5.3.2. System Virtual Machines 5.4. Y-o-Y Growth Trend Analysis By Type, 2017 to 2022 5.5. Absolute $ Opportunity Analysis By Type, 2023 to 2033 6. Global Market Analysis 2017 to 2022 and Forecast 2023 to 2033, By Platform 6.1. Introduction / Key Findings 6.2. Historical Market Size Value (US$ Million) Analysis By Platform, 2017 to 2022 6.3. Current and Future Market Size Value (US$ Million) Analysis and Forecast By Platform, 2023 to 2033 6.3.1. Linux 6.3.2. Mac 6.3.3. Windows 6.3.4. Others 6.4. Y-o-Y Growth Trend Analysis By Platform, 2017 to 2022 6.5. Absolute $ Opportunity Analysis By Platform, 2023 to 2033 7. Global Market Analysis 2017 to 2022 and Forecast 2023 to 2033, By Enterprise Size 7.1. Introduction / Key Findings 7.2. Historical Market Size Value (US$ Million) Analysis By Enterprise Size, 2017 to 2022 7.3. Current and Future Market Size Value (US$ Million) Analysis and Forecast By Enterprise Size, 2023 to 2033 7.3.1. Large Enterprises 7.3.2. Small & Medium Enterprises 7.4. Y-o-Y Growth Trend Analysis By Enterprise Size, 2017 to 2022 7.5. Absolute $ Opportunity Analysis By Enterprise Size, 2023 to 2033 8. Global Market Analysis 2017 to 2022 and Forecast 2023 to 2033, By By Industry 8.1. Introduction / Key Findings 8.2. Historical Market Size Value (US$ Million) Analysis By By Industry, 2017 to 2022 8.3. Current and Future Market Size Value (US$ Million) Analysis and Forecast By By Industry, 2023 to 2033 8.3.1. BFSI 8.3.2. Government 8.3.3. Healthcare 8.3.4. IT & Telecom 8.3.5. Manufacturing 8.3.6. Retail 8.3.7. Others 8.4. Y-o-Y Growth Trend Analysis By By Industry, 2017 to 2022 8.5. Absolute $ Opportunity Analysis By By Industry, 2023 to 2033 9. Global Market Analysis 2017 to 2022 and Forecast 2023 to 2033, By Region 9.1. Introduction 9.2. Historical Market Size Value (US$ Million) Analysis By Region, 2017 to 2022 9.3. Current Market Size Value (US$ Million) Analysis and Forecast By Region, 2023 to 2033 9.3.1. North America 9.3.2. Latin America 9.3.3. Europe 9.3.4. East Asia 9.3.5. South Asia Pacific 9.3.6. Middle East & Africa (MEA) 9.4. Market Attractiveness Analysis By Region 10. North America Market Analysis 2017 to 2022 and Forecast 2023 to 2033, By Country 10.1. Historical Market Size Value (US$ Million) Trend Analysis By Market Taxonomy, 2017 to 2022 10.2. Market Size Value (US$ Million) Forecast By Market Taxonomy, 2023 to 2033 10.2.1. By Country 10.2.1.1. The US 10.2.1.2. Canada 10.2.2. By Type 10.2.3. By Platform 10.2.4. By Enterprise Size 10.2.5. By By Industry 10.3. Market Attractiveness Analysis 10.3.1. By Country 10.3.2. By Type 10.3.3. By Platform 10.3.4. By Enterprise Size 10.3.5. By By Industry 10.4. Key Takeaways 11. Latin America Market Analysis 2017 to 2022 and Forecast 2023 to 2033, By Country 11.1. Historical Market Size Value (US$ Million) Trend Analysis By Market Taxonomy, 2017 to 2022 11.2. Market Size Value (US$ Million) Forecast By Market Taxonomy, 2023 to 2033 11.2.1. By Country 11.2.1.1. Brazil 11.2.1.2. Mexico 11.2.1.3. Rest of Latin America 11.2.2. By Type 11.2.3. By Platform 11.2.4. By Enterprise Size 11.2.5. By By Industry 11.3. Market Attractiveness Analysis 11.3.1. By Country 11.3.2. By Type 11.3.3. By Platform 11.3.4. By Enterprise Size 11.3.5. By By Industry 11.4. Key Takeaways 12. Europe Market Analysis 2017 to 2022 and Forecast 2023 to 2033, By Country 12.1. Historical Market Size Value (US$ Million) Trend Analysis By Market Taxonomy, 2017 to 2022 12.2. Market Size Value (US$ Million) Forecast By Market Taxonomy, 2023 to 2033 12.2.1. By Country 12.2.1.1. Germany 12.2.1.2. France 12.2.1.3. Italy 12.2.1.4. Spain 12.2.1.5. The UK 12.2.1.6. Benelux 12.2.1.7. Russia 12.2.1.8. Rest of Europe 12.2.2. By Type 12.2.3. By Platform 12.2.4. By Enterprise Size 12.2.5. By By Industry 12.3. Market Attractiveness Analysis 12.3.1. By Country 12.3.2. By Type 12.3.3. By Platform 12.3.4. By Enterprise Size 12.3.5. By By Industry 12.4. Key Takeaways 13. East Asia Market Analysis 2017 to 2022 and Forecast 2023 to 2033, By Country 13.1. Historical Market Size Value (US$ Million) Trend Analysis By Market Taxonomy, 2017 to 2022 13.2. Market Size Value (US$ Million) Forecast By Market Taxonomy, 2023 to 2033 13.2.1. By Country 13.2.1.1. China 13.2.1.2. Japan 13.2.1.3. South Korea 13.2.2. By Type 13.2.3. By Platform 13.2.4. By Enterprise Size 13.2.5. By By Industry 13.3. Market Attractiveness Analysis 13.3.1. By Country 13.3.2. By Type 13.3.3. By Platform 13.3.4. By Enterprise Size 13.3.5. By By Industry 13.4. Key Takeaways 14. South Asia Pacific Market Analysis 2017 to 2022 and Forecast 2023 to 2033, By Country 14.1. Historical Market Size Value (US$ Million) Trend Analysis By Market Taxonomy, 2017 to 2022 14.2. Market Size Value (US$ Million) Forecast By Market Taxonomy, 2023 to 2033 14.2.1. By Country 14.2.1.1. Australia & New Zealand 14.2.1.2. India 14.2.1.3. Indonesia 14.2.1.4. Malaysia 14.2.1.5. Thailand 14.2.1.6. Rest of South Asia & Pacific 14.2.2. By Type 14.2.3. By Platform 14.2.4. By Enterprise Size 14.2.5. By By Industry 14.3. Market Attractiveness Analysis 14.3.1. By Country 14.3.2. By Type 14.3.3. By Platform 14.3.4. By Enterprise Size 14.3.5. By By Industry 14.4. Key Takeaways 15. MEA Market Analysis 2017 to 2022 and Forecast 2023 to 2033, By Country 15.1. Historical Market Size Value (US$ Million) Trend Analysis By Market Taxonomy, 2017 to 2022 15.2. Market Size Value (US$ Million) Forecast By Market Taxonomy, 2023 to 2033 15.2.1. By Country 15.2.1.1. GCC Countries 15.2.1.2. South Africa 15.2.1.3. Turkey 15.2.1.4. Rest of MEA 15.2.2. By Type 15.2.3. By Platform 15.2.4. By Enterprise Size 15.2.5. By By Industry 15.3. Market Attractiveness Analysis 15.3.1. By Country 15.3.2. By Type 15.3.3. By Platform 15.3.4. By Enterprise Size 15.3.5. By By Industry 15.4. Key Takeaways 16. Key Countries Market Analysis 16.1. The US 16.1.1. Pricing Analysis 16.1.2. Market Share Analysis, 2022 16.1.2.1. By Type 16.1.2.2. By Platform 16.1.2.3. By Enterprise Size 16.1.2.4. By By Industry 16.2. Canada 16.2.1. Pricing Analysis 16.2.2. Market Share Analysis, 2022 16.2.2.1. By Type 16.2.2.2. By Platform 16.2.2.3. By Enterprise Size 16.2.2.4. By By Industry 16.3. Brazil 16.3.1. Pricing Analysis 16.3.2. Market Share Analysis, 2022 16.3.2.1. By Type 16.3.2.2. By Platform 16.3.2.3. By Enterprise Size 16.3.2.4. By By Industry 16.4. Mexico 16.4.1. Pricing Analysis 16.4.2. Market Share Analysis, 2022 16.4.2.1. By Type 16.4.2.2. By Platform 16.4.2.3. By Enterprise Size 16.4.2.4. By By Industry 16.5. Germany 16.5.1. Pricing Analysis 16.5.2. Market Share Analysis, 2022 16.5.2.1. By Type 16.5.2.2. By Platform 16.5.2.3. By Enterprise Size 16.5.2.4. By By Industry 16.6. France 16.6.1. Pricing Analysis 16.6.2. Market Share Analysis, 2022 16.6.2.1. By Type 16.6.2.2. By Platform 16.6.2.3. By Enterprise Size 16.6.2.4. By By Industry 16.7. Italy 16.7.1. Pricing Analysis 16.7.2. Market Share Analysis, 2022 16.7.2.1. By Type 16.7.2.2. By Platform 16.7.2.3. By Enterprise Size 16.7.2.4. By By Industry 16.8. Spain 16.8.1. Pricing Analysis 16.8.2. Market Share Analysis, 2022 16.8.2.1. By Type 16.8.2.2. By Platform 16.8.2.3. By Enterprise Size 16.8.2.4. By By Industry 16.9. The UK 16.9.1. Pricing Analysis 16.9.2. Market Share Analysis, 2022 16.9.2.1. By Type 16.9.2.2. By Platform 16.9.2.3. By Enterprise Size 16.9.2.4. By By Industry 16.10. Benelux 16.10.1. Pricing Analysis 16.10.2. Market Share Analysis, 2022 16.10.2.1. By Type 16.10.2.2. By Platform 16.10.2.3. By Enterprise Size 16.10.2.4. By By Industry 16.11. Russia 16.11.1. Pricing Analysis 16.11.2. Market Share Analysis, 2022 16.11.2.1. By Type 16.11.2.2. By Platform 16.11.2.3. By Enterprise Size 16.11.2.4. By By Industry 16.12. China 16.12.1. Pricing Analysis 16.12.2. Market Share Analysis, 2022 16.12.2.1. By Type 16.12.2.2. By Platform 16.12.2.3. By Enterprise Size 16.12.2.4. By By Industry 16.13. Japan 16.13.1. Pricing Analysis 16.13.2. Market Share Analysis, 2022 16.13.2.1. By Type 16.13.2.2. By Platform 16.13.2.3. By Enterprise Size 16.13.2.4. By By Industry 16.14. South Korea 16.14.1. Pricing Analysis 16.14.2. Market Share Analysis, 2022 16.14.2.1. By Type 16.14.2.2. By Platform 16.14.2.3. By Enterprise Size 16.14.2.4. By By Industry 16.15. Australia & New Zealand 16.15.1. Pricing Analysis 16.15.2. Market Share Analysis, 2022 16.15.2.1. By Type 16.15.2.2. By Platform 16.15.2.3. By Enterprise Size 16.15.2.4. By By Industry 16.16. India 16.16.1. Pricing Analysis 16.16.2. Market Share Analysis, 2022 16.16.2.1. By Type 16.16.2.2. By Platform 16.16.2.3. By Enterprise Size 16.16.2.4. By By Industry 16.17. Indonesia 16.17.1. Pricing Analysis 16.17.2. Market Share Analysis, 2022 16.17.2.1. By Type 16.17.2.2. By Platform 16.17.2.3. By Enterprise Size 16.17.2.4. By By Industry 16.18. Malaysia 16.18.1. Pricing Analysis 16.18.2. Market Share Analysis, 2022 16.18.2.1. By Type 16.18.2.2. By Platform 16.18.2.3. By Enterprise Size 16.18.2.4. By By Industry 16.19. Thailand 16.19.1. Pricing Analysis 16.19.2. Market Share Analysis, 2022 16.19.2.1. By Type 16.19.2.2. By Platform 16.19.2.3. By Enterprise Size 16.19.2.4. By By Industry 16.20. GCC Countries 16.20.1. Pricing Analysis 16.20.2. Market Share Analysis, 2022 16.20.2.1. By Type 16.20.2.2. By Platform 16.20.2.3. By Enterprise Size 16.20.2.4. By By Industry 16.21. South Africa 16.21.1. Pricing Analysis 16.21.2. Market Share Analysis, 2022 16.21.2.1. By Type 16.21.2.2. By Platform 16.21.2.3. By Enterprise Size 16.21.2.4. By By Industry 16.22. Turkey 16.22.1. Pricing Analysis 16.22.2. Market Share Analysis, 2022 16.22.2.1. By Type 16.22.2.2. By Platform 16.22.2.3. By Enterprise Size 16.22.2.4. By By Industry 17. Market Structure Analysis 17.1. Competition Dashboard 17.2. Competition Benchmarking 17.3. Market Share Analysis of Top Players 17.3.1. By Regional 17.3.2. By Type 17.3.3. By Platform 17.3.4. By Enterprise Size 17.3.5. By By Industry 18. Competition Analysis 18.1. Competition Deep Dive 18.1.1. Microsoft Corporation 18.1.1.1. Overview 18.1.1.2. Product Portfolio 18.1.1.3. Profitability by Market Segments 18.1.1.4. Sales Footprint 18.1.1.5. Strategy Overview 18.1.1.5.1. Marketing Strategy 18.1.2. VMware, Inc. 18.1.2.1. Overview 18.1.2.2. Product Portfolio 18.1.2.3. Profitability by Market Segments 18.1.2.4. Sales Footprint 18.1.2.5. Strategy Overview 18.1.2.5.1. Marketing Strategy 18.1.3. Amazon Web Services, Inc. 18.1.3.1. Overview 18.1.3.2. Product Portfolio 18.1.3.3. Profitability by Market Segments 18.1.3.4. Sales Footprint 18.1.3.5. Strategy Overview 18.1.3.5.1. Marketing Strategy 18.1.4. Google 18.1.4.1. Overview 18.1.4.2. Product Portfolio 18.1.4.3. Profitability by Market Segments 18.1.4.4. Sales Footprint 18.1.4.5. Strategy Overview 18.1.4.5.1. Marketing Strategy 18.1.5. IBM Corporation 18.1.5.1. Overview 18.1.5.2. Product Portfolio 18.1.5.3. Profitability by Market Segments 18.1.5.4. Sales Footprint 18.1.5.5. Strategy Overview 18.1.5.5.1. Marketing Strategy 18.1.6. Oracle Corporation 18.1.6.1. Overview 18.1.6.2. Product Portfolio 18.1.6.3. Profitability by Market Segments 18.1.6.4. Sales Footprint 18.1.6.5. Strategy Overview 18.1.6.5.1. Marketing Strategy 18.1.7. Alibaba Group 18.1.7.1. Overview 18.1.7.2. Product Portfolio 18.1.7.3. Profitability by Market Segments 18.1.7.4. Sales Footprint 18.1.7.5. Strategy Overview 18.1.7.5.1. Marketing Strategy 18.1.8. Hewlett Packard Enterprise 18.1.8.1. Overview 18.1.8.2. Product Portfolio 18.1.8.3. Profitability by Market Segments 18.1.8.4. Sales Footprint 18.1.8.5. Strategy Overview 18.1.8.5.1. Marketing Strategy 18.1.9. Citrix 18.1.9.1. Overview 18.1.9.2. Product Portfolio 18.1.9.3. Profitability by Market Segments 18.1.9.4. Sales Footprint 18.1.9.5. Strategy Overview 18.1.9.5.1. Marketing Strategy 18.1.10. Huawei Technologies 18.1.10.1. Overview 18.1.10.2. Product Portfolio 18.1.10.3. Profitability by Market Segments 18.1.10.4. Sales Footprint 18.1.10.5. Strategy Overview 18.1.10.5.1. Marketing Strategy 18.1.11. Proxmox Server Solutions GmbH 18.1.11.1. Overview 18.1.11.2. Product Portfolio 18.1.11.3. Profitability by Market Segments 18.1.11.4. Sales Footprint 18.1.11.5. Strategy Overview 18.1.11.5.1. Marketing Strategy 18.1.12. Parallels Inc. 18.1.12.1. Overview 18.1.12.2. Product Portfolio 18.1.12.3. Profitability by Market Segments 18.1.12.4. Sales Footprint 18.1.12.5. Strategy Overview 18.1.12.5.1. Marketing Strategy 19. Assumptions & Acronyms Used 20. Research Methodology
Don't pay for what you don't need
Customize your report by selecting specific countries or regions and save 30%!
List of Tables
Table 1: Global Market Value (US$ Million) Forecast by Region, 2017 to 2033 Table 2: Global Market Value (US$ Million) Forecast by Type, 2017 to 2033 Table 3: Global Market Value (US$ Million) Forecast by Platform, 2017 to 2033 Table 4: Global Market Value (US$ Million) Forecast by Enterprise Size, 2017 to 2033 Table 5: Global Market Value (US$ Million) Forecast by By Industry, 2017 to 2033 Table 6: North America Market Value (US$ Million) Forecast by Country, 2017 to 2033 Table 7: North America Market Value (US$ Million) Forecast by Type, 2017 to 2033 Table 8: North America Market Value (US$ Million) Forecast by Platform, 2017 to 2033 Table 9: North America Market Value (US$ Million) Forecast by Enterprise Size, 2017 to 2033 Table 10: North America Market Value (US$ Million) Forecast by By Industry, 2017 to 2033 Table 11: Latin America Market Value (US$ Million) Forecast by Country, 2017 to 2033 Table 12: Latin America Market Value (US$ Million) Forecast by Type, 2017 to 2033 Table 13: Latin America Market Value (US$ Million) Forecast by Platform, 2017 to 2033 Table 14: Latin America Market Value (US$ Million) Forecast by Enterprise Size, 2017 to 2033 Table 15: Latin America Market Value (US$ Million) Forecast by By Industry, 2017 to 2033 Table 16: Europe Market Value (US$ Million) Forecast by Country, 2017 to 2033 Table 17: Europe Market Value (US$ Million) Forecast by Type, 2017 to 2033 Table 18: Europe Market Value (US$ Million) Forecast by Platform, 2017 to 2033 Table 19: Europe Market Value (US$ Million) Forecast by Enterprise Size, 2017 to 2033 Table 20: Europe Market Value (US$ Million) Forecast by By Industry, 2017 to 2033 Table 21: East Asia Market Value (US$ Million) Forecast by Country, 2017 to 2033 Table 22: East Asia Market Value (US$ Million) Forecast by Type, 2017 to 2033 Table 23: East Asia Market Value (US$ Million) Forecast by Platform, 2017 to 2033 Table 24: East Asia Market Value (US$ Million) Forecast by Enterprise Size, 2017 to 2033 Table 25: East Asia Market Value (US$ Million) Forecast by By Industry, 2017 to 2033 Table 26: South Asia Pacific Market Value (US$ Million) Forecast by Country, 2017 to 2033 Table 27: South Asia Pacific Market Value (US$ Million) Forecast by Type, 2017 to 2033 Table 28: South Asia Pacific Market Value (US$ Million) Forecast by Platform, 2017 to 2033 Table 29: South Asia Pacific Market Value (US$ Million) Forecast by Enterprise Size, 2017 to 2033 Table 30: South Asia Pacific Market Value (US$ Million) Forecast by By Industry, 2017 to 2033 Table 31: MEA Market Value (US$ Million) Forecast by Country, 2017 to 2033 Table 32: MEA Market Value (US$ Million) Forecast by Type, 2017 to 2033 Table 33: MEA Market Value (US$ Million) Forecast by Platform, 2017 to 2033 Table 34: MEA Market Value (US$ Million) Forecast by Enterprise Size, 2017 to 2033 Table 35: MEA Market Value (US$ Million) Forecast by By Industry, 2017 to 2033
List of Charts
Figure 1: Global Market Value (US$ Million) by Type, 2023 to 2033 Figure 2: Global Market Value (US$ Million) by Platform, 2023 to 2033 Figure 3: Global Market Value (US$ Million) by Enterprise Size , 2023 to 2033 Figure 4: Global Market Value (US$ Million) by By Industry, 2023 to 2033 Figure 5: Global Market Value (US$ Million) by Region, 2023 to 2033 Figure 6: Global Market Value (US$ Million) Analysis by Region, 2017 to 2033 Figure 7: Global Market Value Share (%) and BPS Analysis by Region, 2023 to 2033 Figure 8: Global Market Y-o-Y Growth (%) Projections by Region, 2023 to 2033 Figure 9: Global Market Value (US$ Million) Analysis by Type, 2017 to 2033 Figure 10: Global Market Value Share (%) and BPS Analysis by Type, 2023 to 2033 Figure 11: Global Market Y-o-Y Growth (%) Projections by Type, 2023 to 2033 Figure 12: Global Market Value (US$ Million) Analysis by Platform, 2017 to 2033 Figure 13: Global Market Value Share (%) and BPS Analysis by Platform, 2023 to 2033 Figure 14: Global Market Y-o-Y Growth (%) Projections by Platform, 2023 to 2033 Figure 15: Global Market Value (US$ Million) Analysis by Enterprise Size , 2017 to 2033 Figure 16: Global Market Value Share (%) and BPS Analysis by Enterprise Size , 2023 to 2033 Figure 17: Global Market Y-o-Y Growth (%) Projections by Enterprise Size , 2023 to 2033 Figure 18: Global Market Value (US$ Million) Analysis by By Industry, 2017 to 2033 Figure 19: Global Market Value Share (%) and BPS Analysis by By Industry, 2023 to 2033 Figure 20: Global Market Y-o-Y Growth (%) Projections by By Industry, 2023 to 2033 Figure 21: Global Market Attractiveness by Type, 2023 to 2033 Figure 22: Global Market Attractiveness by Platform, 2023 to 2033 Figure 23: Global Market Attractiveness by Enterprise Size , 2023 to 2033 Figure 24: Global Market Attractiveness by By Industry, 2023 to 2033 Figure 25: Global Market Attractiveness by Region, 2023 to 2033 Figure 26: North America Market Value (US$ Million) by Type, 2023 to 2033 Figure 27: North America Market Value (US$ Million) by Platform, 2023 to 2033 Figure 28: North America Market Value (US$ Million) by Enterprise Size , 2023 to 2033 Figure 29: North America Market Value (US$ Million) by By Industry, 2023 to 2033 Figure 30: North America Market Value (US$ Million) by Country, 2023 to 2033 Figure 31: North America Market Value (US$ Million) Analysis by Country, 2017 to 2033 Figure 32: North America Market Value Share (%) and BPS Analysis by Country, 2023 to 2033 Figure 33: North America Market Y-o-Y Growth (%) Projections by Country, 2023 to 2033 Figure 34: North America Market Value (US$ Million) Analysis by Type, 2017 to 2033 Figure 35: North America Market Value Share (%) and BPS Analysis by Type, 2023 to 2033 Figure 36: North America Market Y-o-Y Growth (%) Projections by Type, 2023 to 2033 Figure 37: North America Market Value (US$ Million) Analysis by Platform, 2017 to 2033 Figure 38: North America Market Value Share (%) and BPS Analysis by Platform, 2023 to 2033 Figure 39: North America Market Y-o-Y Growth (%) Projections by Platform, 2023 to 2033 Figure 40: North America Market Value (US$ Million) Analysis by Enterprise Size , 2017 to 2033 Figure 41: North America Market Value Share (%) and BPS Analysis by Enterprise Size , 2023 to 2033 Figure 42: North America Market Y-o-Y Growth (%) Projections by Enterprise Size , 2023 to 2033 Figure 43: North America Market Value (US$ Million) Analysis by By Industry, 2017 to 2033 Figure 44: North America Market Value Share (%) and BPS Analysis by By Industry, 2023 to 2033 Figure 45: North America Market Y-o-Y Growth (%) Projections by By Industry, 2023 to 2033 Figure 46: North America Market Attractiveness by Type, 2023 to 2033 Figure 47: North America Market Attractiveness by Platform, 2023 to 2033 Figure 48: North America Market Attractiveness by Enterprise Size , 2023 to 2033 Figure 49: North America Market Attractiveness by By Industry, 2023 to 2033 Figure 50: North America Market Attractiveness by Country, 2023 to 2033 Figure 51: Latin America Market Value (US$ Million) by Type, 2023 to 2033 Figure 52: Latin America Market Value (US$ Million) by Platform, 2023 to 2033 Figure 53: Latin America Market Value (US$ Million) by Enterprise Size , 2023 to 2033 Figure 54: Latin America Market Value (US$ Million) by By Industry, 2023 to 2033 Figure 55: Latin America Market Value (US$ Million) by Country, 2023 to 2033 Figure 56: Latin America Market Value (US$ Million) Analysis by Country, 2017 to 2033 Figure 57: Latin America Market Value Share (%) and BPS Analysis by Country, 2023 to 2033 Figure 58: Latin America Market Y-o-Y Growth (%) Projections by Country, 2023 to 2033 Figure 59: Latin America Market Value (US$ Million) Analysis by Type, 2017 to 2033 Figure 60: Latin America Market Value Share (%) and BPS Analysis by Type, 2023 to 2033 Figure 61: Latin America Market Y-o-Y Growth (%) Projections by Type, 2023 to 2033 Figure 62: Latin America Market Value (US$ Million) Analysis by Platform, 2017 to 2033 Figure 63: Latin America Market Value Share (%) and BPS Analysis by Platform, 2023 to 2033 Figure 64: Latin America Market Y-o-Y Growth (%) Projections by Platform, 2023 to 2033 Figure 65: Latin America Market Value (US$ Million) Analysis by Enterprise Size , 2017 to 2033 Figure 66: Latin America Market Value Share (%) and BPS Analysis by Enterprise Size , 2023 to 2033 Figure 67: Latin America Market Y-o-Y Growth (%) Projections by Enterprise Size , 2023 to 2033 Figure 68: Latin America Market Value (US$ Million) Analysis by By Industry, 2017 to 2033 Figure 69: Latin America Market Value Share (%) and BPS Analysis by By Industry, 2023 to 2033 Figure 70: Latin America Market Y-o-Y Growth (%) Projections by By Industry, 2023 to 2033 Figure 71: Latin America Market Attractiveness by Type, 2023 to 2033 Figure 72: Latin America Market Attractiveness by Platform, 2023 to 2033 Figure 73: Latin America Market Attractiveness by Enterprise Size , 2023 to 2033 Figure 74: Latin America Market Attractiveness by By Industry, 2023 to 2033 Figure 75: Latin America Market Attractiveness by Country, 2023 to 2033 Figure 76: Europe Market Value (US$ Million) by Type, 2023 to 2033 Figure 77: Europe Market Value (US$ Million) by Platform, 2023 to 2033 Figure 78: Europe Market Value (US$ Million) by Enterprise Size , 2023 to 2033 Figure 79: Europe Market Value (US$ Million) by By Industry, 2023 to 2033 Figure 80: Europe Market Value (US$ Million) by Country, 2023 to 2033 Figure 81: Europe Market Value (US$ Million) Analysis by Country, 2017 to 2033 Figure 82: Europe Market Value Share (%) and BPS Analysis by Country, 2023 to 2033 Figure 83: Europe Market Y-o-Y Growth (%) Projections by Country, 2023 to 2033 Figure 84: Europe Market Value (US$ Million) Analysis by Type, 2017 to 2033 Figure 85: Europe Market Value Share (%) and BPS Analysis by Type, 2023 to 2033 Figure 86: Europe Market Y-o-Y Growth (%) Projections by Type, 2023 to 2033 Figure 87: Europe Market Value (US$ Million) Analysis by Platform, 2017 to 2033 Figure 88: Europe Market Value Share (%) and BPS Analysis by Platform, 2023 to 2033 Figure 89: Europe Market Y-o-Y Growth (%) Projections by Platform, 2023 to 2033 Figure 90: Europe Market Value (US$ Million) Analysis by Enterprise Size , 2017 to 2033 Figure 91: Europe Market Value Share (%) and BPS Analysis by Enterprise Size , 2023 to 2033 Figure 92: Europe Market Y-o-Y Growth (%) Projections by Enterprise Size , 2023 to 2033 Figure 93: Europe Market Value (US$ Million) Analysis by By Industry, 2017 to 2033 Figure 94: Europe Market Value Share (%) and BPS Analysis by By Industry, 2023 to 2033 Figure 95: Europe Market Y-o-Y Growth (%) Projections by By Industry, 2023 to 2033 Figure 96: Europe Market Attractiveness by Type, 2023 to 2033 Figure 97: Europe Market Attractiveness by Platform, 2023 to 2033 Figure 98: Europe Market Attractiveness by Enterprise Size , 2023 to 2033 Figure 99: Europe Market Attractiveness by By Industry, 2023 to 2033 Figure 100: Europe Market Attractiveness by Country, 2023 to 2033 Figure 101: East Asia Market Value (US$ Million) by Type, 2023 to 2033 Figure 102: East Asia Market Value (US$ Million) by Platform, 2023 to 2033 Figure 103: East Asia Market Value (US$ Million) by Enterprise Size , 2023 to 2033 Figure 104: East Asia Market Value (US$ Million) by By Industry, 2023 to 2033 Figure 105: East Asia Market Value (US$ Million) by Country, 2023 to 2033 Figure 106: East Asia Market Value (US$ Million) Analysis by Country, 2017 to 2033 Figure 107: East Asia Market Value Share (%) and BPS Analysis by Country, 2023 to 2033 Figure 108: East Asia Market Y-o-Y Growth (%) Projections by Country, 2023 to 2033 Figure 109: East Asia Market Value (US$ Million) Analysis by Type, 2017 to 2033 Figure 110: East Asia Market Value Share (%) and BPS Analysis by Type, 2023 to 2033 Figure 111: East Asia Market Y-o-Y Growth (%) Projections by Type, 2023 to 2033 Figure 112: East Asia Market Value (US$ Million) Analysis by Platform, 2017 to 2033 Figure 113: East Asia Market Value Share (%) and BPS Analysis by Platform, 2023 to 2033 Figure 114: East Asia Market Y-o-Y Growth (%) Projections by Platform, 2023 to 2033 Figure 115: East Asia Market Value (US$ Million) Analysis by Enterprise Size , 2017 to 2033 Figure 116: East Asia Market Value Share (%) and BPS Analysis by Enterprise Size , 2023 to 2033 Figure 117: East Asia Market Y-o-Y Growth (%) Projections by Enterprise Size , 2023 to 2033 Figure 118: East Asia Market Value (US$ Million) Analysis by By Industry, 2017 to 2033 Figure 119: East Asia Market Value Share (%) and BPS Analysis by By Industry, 2023 to 2033 Figure 120: East Asia Market Y-o-Y Growth (%) Projections by By Industry, 2023 to 2033 Figure 121: East Asia Market Attractiveness by Type, 2023 to 2033 Figure 122: East Asia Market Attractiveness by Platform, 2023 to 2033 Figure 123: East Asia Market Attractiveness by Enterprise Size , 2023 to 2033 Figure 124: East Asia Market Attractiveness by By Industry, 2023 to 2033 Figure 125: East Asia Market Attractiveness by Country, 2023 to 2033 Figure 126: South Asia Pacific Market Value (US$ Million) by Type, 2023 to 2033 Figure 127: South Asia Pacific Market Value (US$ Million) by Platform, 2023 to 2033 Figure 128: South Asia Pacific Market Value (US$ Million) by Enterprise Size , 2023 to 2033 Figure 129: South Asia Pacific Market Value (US$ Million) by By Industry, 2023 to 2033 Figure 130: South Asia Pacific Market Value (US$ Million) by Country, 2023 to 2033 Figure 131: South Asia Pacific Market Value (US$ Million) Analysis by Country, 2017 to 2033 Figure 132: South Asia Pacific Market Value Share (%) and BPS Analysis by Country, 2023 to 2033 Figure 133: South Asia Pacific Market Y-o-Y Growth (%) Projections by Country, 2023 to 2033 Figure 134: South Asia Pacific Market Value (US$ Million) Analysis by Type, 2017 to 2033 Figure 135: South Asia Pacific Market Value Share (%) and BPS Analysis by Type, 2023 to 2033 Figure 136: South Asia Pacific Market Y-o-Y Growth (%) Projections by Type, 2023 to 2033 Figure 137: South Asia Pacific Market Value (US$ Million) Analysis by Platform, 2017 to 2033 Figure 138: South Asia Pacific Market Value Share (%) and BPS Analysis by Platform, 2023 to 2033 Figure 139: South Asia Pacific Market Y-o-Y Growth (%) Projections by Platform, 2023 to 2033 Figure 140: South Asia Pacific Market Value (US$ Million) Analysis by Enterprise Size , 2017 to 2033 Figure 141: South Asia Pacific Market Value Share (%) and BPS Analysis by Enterprise Size , 2023 to 2033 Figure 142: South Asia Pacific Market Y-o-Y Growth (%) Projections by Enterprise Size , 2023 to 2033 Figure 143: South Asia Pacific Market Value (US$ Million) Analysis by By Industry, 2017 to 2033 Figure 144: South Asia Pacific Market Value Share (%) and BPS Analysis by By Industry, 2023 to 2033 Figure 145: South Asia Pacific Market Y-o-Y Growth (%) Projections by By Industry, 2023 to 2033 Figure 146: South Asia Pacific Market Attractiveness by Type, 2023 to 2033 Figure 147: South Asia Pacific Market Attractiveness by Platform, 2023 to 2033 Figure 148: South Asia Pacific Market Attractiveness by Enterprise Size , 2023 to 2033 Figure 149: South Asia Pacific Market Attractiveness by By Industry, 2023 to 2033 Figure 150: South Asia Pacific Market Attractiveness by Country, 2023 to 2033 Figure 151: MEA Market Value (US$ Million) by Type, 2023 to 2033 Figure 152: MEA Market Value (US$ Million) by Platform, 2023 to 2033 Figure 153: MEA Market Value (US$ Million) by Enterprise Size , 2023 to 2033 Figure 154: MEA Market Value (US$ Million) by By Industry, 2023 to 2033 Figure 155: MEA Market Value (US$ Million) by Country, 2023 to 2033 Figure 156: MEA Market Value (US$ Million) Analysis by Country, 2017 to 2033 Figure 157: MEA Market Value Share (%) and BPS Analysis by Country, 2023 to 2033 Figure 158: MEA Market Y-o-Y Growth (%) Projections by Country, 2023 to 2033 Figure 159: MEA Market Value (US$ Million) Analysis by Type, 2017 to 2033 Figure 160: MEA Market Value Share (%) and BPS Analysis by Type, 2023 to 2033 Figure 161: MEA Market Y-o-Y Growth (%) Projections by Type, 2023 to 2033 Figure 162: MEA Market Value (US$ Million) Analysis by Platform, 2017 to 2033 Figure 163: MEA Market Value Share (%) and BPS Analysis by Platform, 2023 to 2033 Figure 164: MEA Market Y-o-Y Growth (%) Projections by Platform, 2023 to 2033 Figure 165: MEA Market Value (US$ Million) Analysis by Enterprise Size , 2017 to 2033 Figure 166: MEA Market Value Share (%) and BPS Analysis by Enterprise Size , 2023 to 2033 Figure 167: MEA Market Y-o-Y Growth (%) Projections by Enterprise Size , 2023 to 2033 Figure 168: MEA Market Value (US$ Million) Analysis by By Industry, 2017 to 2033 Figure 169: MEA Market Value Share (%) and BPS Analysis by By Industry, 2023 to 2033 Figure 170: MEA Market Y-o-Y Growth (%) Projections by By Industry, 2023 to 2033 Figure 171: MEA Market Attractiveness by Type, 2023 to 2033 Figure 172: MEA Market Attractiveness by Platform, 2023 to 2033 Figure 173: MEA Market Attractiveness by Enterprise Size , 2023 to 2033 Figure 174: MEA Market Attractiveness by By Industry, 2023 to 2033 Figure 175: MEA Market Attractiveness by Country, 2023 to 2033
Recommendations
Explore Technology Insights
View Reports