Virtual Infrastructure Manager Market Size and Share Forecast Outlook 2025 to 2035

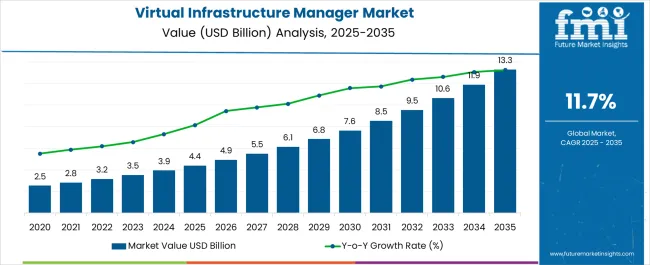
The Virtual Infrastructure Manager Market is estimated to be valued at USD 4.4 billion in 2025 and is projected to reach USD 13.3 billion by 2035, registering a compound annual growth rate (CAGR) of 11.7% over the forecast period.
Quick Stats for Virtual Infrastructure Manager Market

  • Virtual Infrastructure Manager Market Industry Value (2025): USD 4.4 billion
  • Virtual Infrastructure Manager Market Forecast Value (2035): USD 13.3 billion
  • Virtual Infrastructure Manager Market Forecast CAGR: 11.7%
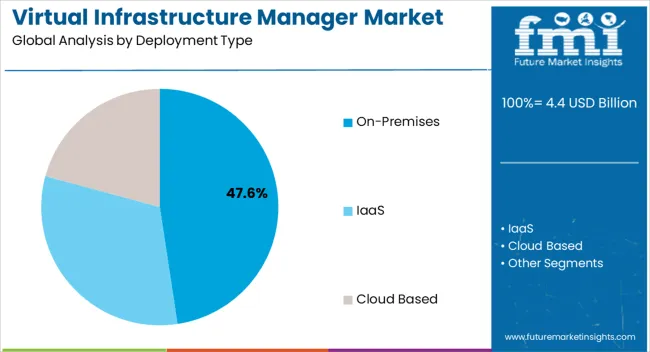
  • Leading Segment in Virtual Infrastructure Manager Market in 2025: On-Premises (47.6%)
  • Key Growth Region in Virtual Infrastructure Manager Market: North America, Asia-Pacific, Europe
  • Top Key Players in Virtual Infrastructure Manager Market: Ericson, Cisco, VMware View, IBM PowerVM, Netapp, Enterprise Management Associates Inc., CA Technologies, SevOne, Fujitsu Ltd., Avaya Inc.

Virtual Infrastructure Manager Market Market Value Analysis

Metric Value
Virtual Infrastructure Manager Market Estimated Value in (2025 E) USD 4.4 billion
Virtual Infrastructure Manager Market Forecast Value in (2035 F) USD 13.3 billion
Forecast CAGR (2025 to 2035) 11.7%

Rationale for Segmental Growth in the Virtual Infrastructure Manager Market

The virtual infrastructure manager market is expanding rapidly as enterprises accelerate digital transformation, cloud adoption, and the need for scalable infrastructure solutions. Increasing complexity in IT environments and the requirement for seamless integration across hybrid and multi cloud ecosystems are pushing organizations toward advanced infrastructure management platforms.

Demand is further supported by cost optimization initiatives and the growing importance of security, compliance, and real time monitoring across critical sectors. Continuous innovation in automation, AI driven analytics, and self service orchestration is enhancing operational efficiency and reducing downtime, strengthening the adoption trajectory.

The future outlook is favorable as both private and public sector organizations increasingly rely on virtual infrastructure managers to support workload consolidation, data center optimization, and business continuity.
Segmental Analysis

Insights into the On Premises Deployment Type Segment

Virtual Infrastructure Manager Market Analysis By Deployment Type

The on premises deployment type segment is expected to account for 47.60% of total revenue by 2025, establishing it as the leading deployment model. This is attributed to enterprises maintaining greater control over sensitive data, regulatory compliance, and security frameworks.

Industries operating under stringent governance prefer on premises solutions to safeguard mission critical operations and ensure uninterrupted access. Additionally, integration with legacy systems and reduced dependency on external cloud providers have reinforced the preference for this model.

Organizations with significant investment in existing data centers continue to leverage on premises infrastructure managers, ensuring reliability and customization tailored to specific enterprise requirements.
Insights into the Banking Financial Services And Insurance Sector Application Segment

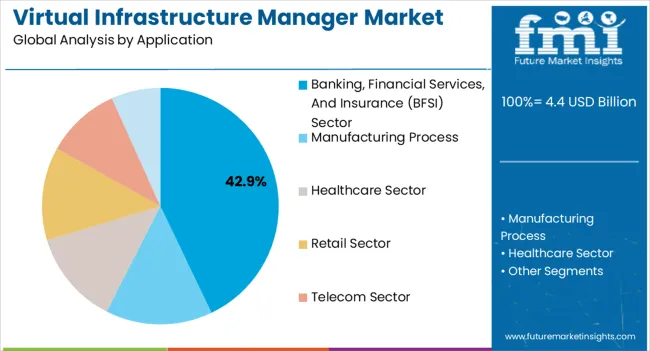
Virtual Infrastructure Manager Market Analysis By Application

The banking financial services and insurance sector is projected to represent 42.90% of total revenue by 2025 within the application category, making it the dominant vertical. This dominance is fueled by the sector’s need for secure, scalable, and compliant infrastructure to support high transaction volumes and sensitive financial data.

Regulatory obligations and data privacy laws have accelerated adoption of infrastructure management solutions that enhance transparency and operational oversight. The shift toward digital banking, fintech integration, and real time analytics is further driving reliance on robust virtual infrastructure managers.

Enhanced disaster recovery, fraud detection, and secure workload management have cemented the BFSI sector as the primary application domain.
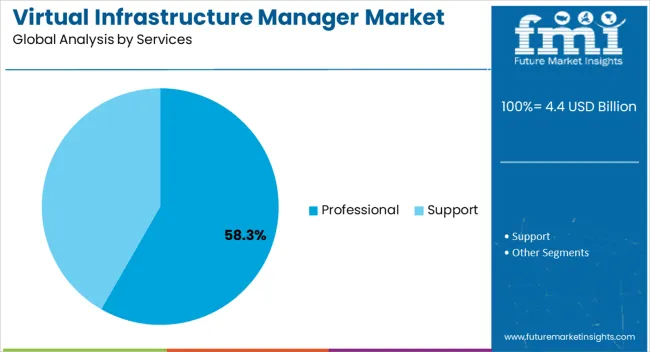
Insights into the Professional Services Segment

Virtual Infrastructure Manager Market Analysis By Services

The professional services segment is anticipated to hold 58.30% of market revenue by 2025, positioning it as the leading service category. Growth is supported by enterprises requiring expert consultation, integration, and customization to maximize value from infrastructure investments.

Professional services deliver tailored deployment strategies, training, and maintenance that help organizations align infrastructure management with business objectives. Increasing demand for managed services, automation, and optimization expertise has reinforced reliance on professional providers.

The ability to reduce complexity, ensure compliance, and deliver cost effective scalability has established professional services as the most influential contributor to market growth.

What are the Market Dynamics for Virtual Infrastructure Managers?

Drivers:

Virtual infrastructure manager market growth is attributed to several factors, such as:

  • Advanced Features: The increase in demand for the service due to its many advanced features such as optimized performance, highly customizable and virtualized infrastructure life cycle management.
  • Centralized Management: With the growing market for virtual infrastructure management to manage a wide range of virtual IT resources across multiple physical servers and provide centralized administration of virtual resources by creating, storing, and patching, the market for virtual infrastructure managers is expected to grow significantly.
  • Acceptance of Innovation: The growing demand for unified and virtual infrastructure monitoring and the rise in acceptance of innovative services and technologies among industries further influence the market.
  • Secure Data: In a virtual infrastructure, all the data and apps remain on the server, so it is easy for the organization to lock down its data and help protect it from unauthorized access.
  • Changing with the Trend: The market is positively impacted by industrialization and digitization, expansion of enterprises, investment growth, and rising concerns regarding worker efficiency.

Issues with the tracking of physical machines and virtual machines are expected to hinder the growth of the virtual infrastructure manager market. Also, the lack of qualified professionals is expected to present challenges to the market for virtual infrastructure managers.

Country-wise Insights

Regional Market Comparison Global Market Share in Percentage
North America 27.7%
Europe 24.3%

How is The United Sates Virtual Infrastructure Manager Market Evolving?

North America is expected to hold a significant share of the global market, accounting for 29.2% of the market share during the forecast period owing to the increasing demand for infrastructure monitoring in the region.

Market growth in North America region is mainly driven by high adoption of bringing your own device (BYOD) policies, cloud adoption among several end-user segments, and increasing workplace flexibility requirements. Furthermore, with the presence and availability of global brands, there are significant growth prospects for North America’s market.

Regional Market Comparison Global Market Share in Percentage
The United States 17.6%
Germany 10.5%
Japan 5.4%
Australia 3.9%

How is Europe Performing in the Virtual Infrastructure Manager Market?

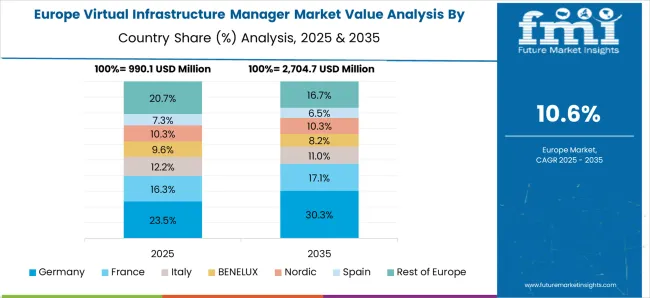
Virtual Infrastructure Manager Market Europe Country Market Share Analysis, 2025 & 2035

The market report explains that Europe is projected to hold a considerable share of 21.1% of the global market for virtual infrastructure managers during the forecast period. Within the European Union, continuous technological advancements are occurring throughout the region, such as in Norway, Finland, Sweden, Denmark, the Netherlands, Switzerland, and the United Kingdom, which holds a leading position in national technological strength.

A position in this area contributes to the development of advanced software and technology in the industrial sector. Also, virtual infrastructure manager is expected to be positively impacted by the trend of BYOD and remote working prevalent in Europe, fuelling the adoption of virtual infrastructure managers.

Regional Markets CAGR (2025 to 2035)
The United Kingdom 8.9%
China 10.5%
India 15.4%

Start-up Ecosystem

How is the Start-up Ecosystem in the Virtual Infrastructure Manager Market?

The market report explains that new business models are emerging all the time, sometimes due to market changes and technological advancements, culminating in new, exciting trends. To develop the right frameworks and architectures, start-ups are intensifying their focus on innovation and resorting to mergers and acquisitions.

  • Accedian is a start-up in Canada that provides cloud-based IT infrastructure monitoring solutions which analyze network performance for mobile networks as well as enterprise-to-data centre connectivity. An orchestration, testing, and monitoring solutions are included to accelerate deployment, deliver granular performance monitoring, and provide an interface for overall activity monitoring.
  • A USA-based start-up, LogicMonitor provides cloud-enabled IT infrastructure monitoring software. It offers cloud services for data center monitoring of virtual, physical and cloud computing IT infrastructures. The software provides performance monitoring, historical trending, reporting, and email and SMS alerting. Also, users can access the service via a subscription-based pricing module, fuelling the demand for virtual infrastructure managers.

Virtual Infrastructure Manager Market: Competitive Landscape

Several companies are focusing on organic growth strategies such as product launches, product approvals, patents, and events. Further, inorganic growth strategies observed in the market were acquisitions, collaborations and partnerships. These activities have paved the way for the expansion of business and the customer base of market players.

Key players in the market are expected to benefit from significant growth opportunities in the future. This is due to the increasing demand for filter products in the global market.

Category By Application
Top Segment Manufacturing Process
Market Share in Percentage 28.1%
Category By Services
Top Segment Support
Market Share in Percentage 52.1%

Recent Developments in the Virtual Infrastructure Manager Market

The market report explains that the players are investing significantly in research and development so that they can introduce new and innovative applications to offer traffic analysis details across LAN, WAN, and cloud environments. With the advent of new service provider functions, the market has become mainstream.

Cloud-based management is used mainly for mobile core services and virtual networking services and is deployed globally in telecommunications data centers mainly in the central and regional regions. Many competitors in the market adopted partnerships as a key strategy to expand their geographical footprint and upgrade their product technologies.

  • Cisco has deployed virtual packet cores (VPC), virtualized managed services, and virtualized infrastructure services in over 100 networks. Observers can identify the leading practice approach to NFV design and operation as the industry hits the hype cycle slope of enlightenment.

The leader in cloud data services, NetApp, announced on April 29, 2024, that it acquired CloudJumper, a leader in virtual desktop infrastructure (VDI) and remote desktop services (RDS). This acquisition may enable NetApp to deliver a comprehensive solution that combines virtual desktop management and application management. This also enables customers to deploy, manage, monitor, and optimize those environments from a single provider using any public cloud.
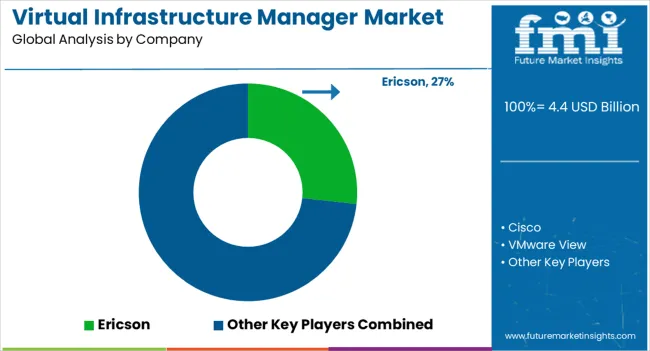
Who are the Key Players in the Virtual Infrastructure Manager Market?

Virtual Infrastructure Manager Market Analysis By Company

The leading players operating in this market include:

  • Ericson
  • Cisco
  • VMware View
  • IBM PowerVM
  • Netapp
  • Enterprise Management Associates Inc.
  • CA Technologies
  • SevOne
  • Fujitsu Ltd.
  • Avaya Inc.

Report Scope

Report Attribute Details
Growth Rate CAGR of 11.7% from 2025 to 2035
Base Year for Estimation 2025
Historical Data 2020 to 2025
Forecast Period 2025 to 2035
Report Coverage Revenue Forecast, Volume Forecast, Company Ranking, Competitive Landscape, Growth Factors, Trends and Pricing Analysis
Segments Covered By Deployment Type, By Application, By Services, By Region
Regions Covered North America Market; Latin America Market; Europe Market; East Asia Market; South Asia and Pacific Market; The Middle East & Africa (ME&A) Market
Key Countries Profiled The United States, Canada, Brazil, Argentina, Germany, The United Kingdom, France, Spain, Italy, Nordics, BENELUX, Australia & New Zealand, China, India, GCC, South Africa
Key Companies Profiled Ericson; Cisco; VMware View; IBM PowerVM; Netapp; Enterprise Management Associates Inc.; CA Technologies; SevOne; Fujitsu Ltd.; Avaya Inc.
Customization& Pricing Available Upon Request

Key Segments Profiled in the Virtual Infrastructure Manager Market Survey

By Deployment Type:

  • On-Premises
  • IaaS
  • Cloud Based

By Application:

  • Banking, Financial Services, and Insurance (BFSI) Sector
  • ManufacturingProcess
  • Healthcare Sector
  • Retail Sector
  • Telecom Sector
  • Other Applications

By Services:

  • Professional
  • Support

By Region:

  • North America Market
  • Europe Market
  • East Asia Market
  • South Asia and Pacific Market
  • Latin America Market
  • The Middle East & Africa Market

Frequently Asked Questions

How big is the virtual infrastructure manager market in 2025?

The global virtual infrastructure manager market is estimated to be valued at USD 4.4 billion in 2025.

What will be the size of virtual infrastructure manager market in 2035?

The market size for the virtual infrastructure manager market is projected to reach USD 13.3 billion by 2035.

How much will be the virtual infrastructure manager market growth between 2025 and 2035?

The virtual infrastructure manager market is expected to grow at a 11.7% CAGR between 2025 and 2035.

What are the key product types in the virtual infrastructure manager market?

The key product types in virtual infrastructure manager market are on-premises, iaas and cloud based.

Which application segment to contribute significant share in the virtual infrastructure manager market in 2025?

In terms of application, banking, financial services, and insurance (bfsi) sector segment to command 42.9% share in the virtual infrastructure manager market in 2025.

Table of Content

  1. Executive Summary
    • Global Market Outlook
    • Demand-side Trends
    • Supply-side Trends
    • Technology Roadmap Analysis
    • Analysis and Recommendations
  2. Market Overview
    • Market Coverage / Taxonomy
    • Market Definition / Scope / Limitations
  3. Market Background
    • Market Dynamics
      • Drivers
      • Restraints
      • Opportunity
      • Trends
    • Scenario Forecast
      • Demand in Optimistic Scenario
      • Demand in Likely Scenario
      • Demand in Conservative Scenario
    • Opportunity Map Analysis
    • Product Life Cycle Analysis
    • Supply Chain Analysis
    • Investment Feasibility Matrix
    • Value Chain Analysis
    • PESTLE and Porter’s Analysis
    • Regulatory Landscape
    • Regional Parent Market Outlook
    • Production and Consumption Statistics
    • Import and Export Statistics
  4. Global Market Analysis 2020 to 2024 and Forecast, 2025 to 2035
    • Historical Market Size Value (USD Million) Analysis, 2020 to 2024
    • Current and Future Market Size Value (USD Million) Projections, 2025 to 2035
      • Y-o-Y Growth Trend Analysis
      • Absolute $ Opportunity Analysis
  5. Global Market Pricing Analysis 2020 to 2024 and Forecast 2025 to 2035
  6. Global Market Analysis 2020 to 2024 and Forecast 2025 to 2035, By Deployment Type
    • Introduction / Key Findings
    • Historical Market Size Value (USD Million) Analysis By Deployment Type , 2020 to 2024
    • Current and Future Market Size Value (USD Million) Analysis and Forecast By Deployment Type , 2025 to 2035
      • On-Premises
      • IaaS
      • Cloud Based
    • Y-o-Y Growth Trend Analysis By Deployment Type , 2020 to 2024
    • Absolute $ Opportunity Analysis By Deployment Type , 2025 to 2035
  7. Global Market Analysis 2020 to 2024 and Forecast 2025 to 2035, By Application
    • Introduction / Key Findings
    • Historical Market Size Value (USD Million) Analysis By Application, 2020 to 2024
    • Current and Future Market Size Value (USD Million) Analysis and Forecast By Application, 2025 to 2035
      • Banking, Financial Services, And Insurance (BFSI) Sector
      • Manufacturing Process
      • Healthcare Sector
      • Retail Sector
      • Telecom Sector
      • Other Applications
    • Y-o-Y Growth Trend Analysis By Application, 2020 to 2024
    • Absolute $ Opportunity Analysis By Application, 2025 to 2035
  8. Global Market Analysis 2020 to 2024 and Forecast 2025 to 2035, By Services
    • Introduction / Key Findings
    • Historical Market Size Value (USD Million) Analysis By Services, 2020 to 2024
    • Current and Future Market Size Value (USD Million) Analysis and Forecast By Services, 2025 to 2035
      • Professional
      • Support
    • Y-o-Y Growth Trend Analysis By Services, 2020 to 2024
    • Absolute $ Opportunity Analysis By Services, 2025 to 2035
  9. Global Market Analysis 2020 to 2024 and Forecast 2025 to 2035, By Region
    • Introduction
    • Historical Market Size Value (USD Million) Analysis By Region, 2020 to 2024
    • Current Market Size Value (USD Million) Analysis and Forecast By Region, 2025 to 2035
      • North America
      • Latin America
      • Western Europe
      • Eastern Europe
      • East Asia
      • South Asia and Pacific
      • Middle East & Africa
    • Market Attractiveness Analysis By Region
  10. North America Market Analysis 2020 to 2024 and Forecast 2025 to 2035, By Country
    • Historical Market Size Value (USD Million) Trend Analysis By Market Taxonomy, 2020 to 2024
    • Market Size Value (USD Million) Forecast By Market Taxonomy, 2025 to 2035
      • By Country
        • USA
        • Canada
        • Mexico
      • By Deployment Type
      • By Application
      • By Services
    • Market Attractiveness Analysis
      • By Country
      • By Deployment Type
      • By Application
      • By Services
    • Key Takeaways
  11. Latin America Market Analysis 2020 to 2024 and Forecast 2025 to 2035, By Country
    • Historical Market Size Value (USD Million) Trend Analysis By Market Taxonomy, 2020 to 2024
    • Market Size Value (USD Million) Forecast By Market Taxonomy, 2025 to 2035
      • By Country
        • Brazil
        • Chile
        • Rest of Latin America
      • By Deployment Type
      • By Application
      • By Services
    • Market Attractiveness Analysis
      • By Country
      • By Deployment Type
      • By Application
      • By Services
    • Key Takeaways
  12. Western Europe Market Analysis 2020 to 2024 and Forecast 2025 to 2035, By Country
    • Historical Market Size Value (USD Million) Trend Analysis By Market Taxonomy, 2020 to 2024
    • Market Size Value (USD Million) Forecast By Market Taxonomy, 2025 to 2035
      • By Country
        • Germany
        • UK
        • Italy
        • Spain
        • France
        • Nordic
        • BENELUX
        • Rest of Western Europe
      • By Deployment Type
      • By Application
      • By Services
    • Market Attractiveness Analysis
      • By Country
      • By Deployment Type
      • By Application
      • By Services
    • Key Takeaways
  13. Eastern Europe Market Analysis 2020 to 2024 and Forecast 2025 to 2035, By Country
    • Historical Market Size Value (USD Million) Trend Analysis By Market Taxonomy, 2020 to 2024
    • Market Size Value (USD Million) Forecast By Market Taxonomy, 2025 to 2035
      • By Country
        • Russia
        • Poland
        • Hungary
        • Balkan & Baltic
        • Rest of Eastern Europe
      • By Deployment Type
      • By Application
      • By Services
    • Market Attractiveness Analysis
      • By Country
      • By Deployment Type
      • By Application
      • By Services
    • Key Takeaways
  14. East Asia Market Analysis 2020 to 2024 and Forecast 2025 to 2035, By Country
    • Historical Market Size Value (USD Million) Trend Analysis By Market Taxonomy, 2020 to 2024
    • Market Size Value (USD Million) Forecast By Market Taxonomy, 2025 to 2035
      • By Country
        • China
        • Japan
        • South Korea
      • By Deployment Type
      • By Application
      • By Services
    • Market Attractiveness Analysis
      • By Country
      • By Deployment Type
      • By Application
      • By Services
    • Key Takeaways
  15. South Asia and Pacific Market Analysis 2020 to 2024 and Forecast 2025 to 2035, By Country
    • Historical Market Size Value (USD Million) Trend Analysis By Market Taxonomy, 2020 to 2024
    • Market Size Value (USD Million) Forecast By Market Taxonomy, 2025 to 2035
      • By Country
        • India
        • ASEAN
        • Australia & New Zealand
        • Rest of South Asia and Pacific
      • By Deployment Type
      • By Application
      • By Services
    • Market Attractiveness Analysis
      • By Country
      • By Deployment Type
      • By Application
      • By Services
    • Key Takeaways
  16. Middle East & Africa Market Analysis 2020 to 2024 and Forecast 2025 to 2035, By Country
    • Historical Market Size Value (USD Million) Trend Analysis By Market Taxonomy, 2020 to 2024
    • Market Size Value (USD Million) Forecast By Market Taxonomy, 2025 to 2035
      • By Country
        • Kingdom of Saudi Arabia
        • Other GCC Countries
        • Turkiye
        • South Africa
        • Other African Union
        • Rest of Middle East & Africa
      • By Deployment Type
      • By Application
      • By Services
    • Market Attractiveness Analysis
      • By Country
      • By Deployment Type
      • By Application
      • By Services
    • Key Takeaways
  17. Key Countries Market Analysis
    • USA
      • Pricing Analysis
      • Market Share Analysis, 2024
        • By Deployment Type
        • By Application
        • By Services
    • Canada
      • Pricing Analysis
      • Market Share Analysis, 2024
        • By Deployment Type
        • By Application
        • By Services
    • Mexico
      • Pricing Analysis
      • Market Share Analysis, 2024
        • By Deployment Type
        • By Application
        • By Services
    • Brazil
      • Pricing Analysis
      • Market Share Analysis, 2024
        • By Deployment Type
        • By Application
        • By Services
    • Chile
      • Pricing Analysis
      • Market Share Analysis, 2024
        • By Deployment Type
        • By Application
        • By Services
    • Germany
      • Pricing Analysis
      • Market Share Analysis, 2024
        • By Deployment Type
        • By Application
        • By Services
    • UK
      • Pricing Analysis
      • Market Share Analysis, 2024
        • By Deployment Type
        • By Application
        • By Services
    • Italy
      • Pricing Analysis
      • Market Share Analysis, 2024
        • By Deployment Type
        • By Application
        • By Services
    • Spain
      • Pricing Analysis
      • Market Share Analysis, 2024
        • By Deployment Type
        • By Application
        • By Services
    • France
      • Pricing Analysis
      • Market Share Analysis, 2024
        • By Deployment Type
        • By Application
        • By Services
    • India
      • Pricing Analysis
      • Market Share Analysis, 2024
        • By Deployment Type
        • By Application
        • By Services
    • ASEAN
      • Pricing Analysis
      • Market Share Analysis, 2024
        • By Deployment Type
        • By Application
        • By Services
    • Australia & New Zealand
      • Pricing Analysis
      • Market Share Analysis, 2024
        • By Deployment Type
        • By Application
        • By Services
    • China
      • Pricing Analysis
      • Market Share Analysis, 2024
        • By Deployment Type
        • By Application
        • By Services
    • Japan
      • Pricing Analysis
      • Market Share Analysis, 2024
        • By Deployment Type
        • By Application
        • By Services
    • South Korea
      • Pricing Analysis
      • Market Share Analysis, 2024
        • By Deployment Type
        • By Application
        • By Services
    • Russia
      • Pricing Analysis
      • Market Share Analysis, 2024
        • By Deployment Type
        • By Application
        • By Services
    • Poland
      • Pricing Analysis
      • Market Share Analysis, 2024
        • By Deployment Type
        • By Application
        • By Services
    • Hungary
      • Pricing Analysis
      • Market Share Analysis, 2024
        • By Deployment Type
        • By Application
        • By Services
    • Kingdom of Saudi Arabia
      • Pricing Analysis
      • Market Share Analysis, 2024
        • By Deployment Type
        • By Application
        • By Services
    • Turkiye
      • Pricing Analysis
      • Market Share Analysis, 2024
        • By Deployment Type
        • By Application
        • By Services
    • South Africa
      • Pricing Analysis
      • Market Share Analysis, 2024
        • By Deployment Type
        • By Application
        • By Services
  18. Market Structure Analysis
    • Competition Dashboard
    • Competition Benchmarking
    • Market Share Analysis of Top Players
      • By Regional
      • By Deployment Type
      • By Application
      • By Services
  19. Competition Analysis
    • Competition Deep Dive
      • Ericson
        • Overview
        • Product Portfolio
        • Profitability by Market Segments (Product/Age /Sales Channel/Region)
        • Sales Footprint
        • Strategy Overview
          • Marketing Strategy
          • Product Strategy
          • Channel Strategy
      • Cisco
      • VMware View
      • IBM PowerVM
      • Netapp
      • Enterprise Management Associates Inc.
      • CA Technologies
      • SevOne
      • Fujitsu Ltd.
      • Avaya Inc.
  20. Assumptions & Acronyms Used
  21. Research Methodology

List of Tables

  • Table 1: Global Market Value (USD Million) Forecast by Region, 2020 to 2035
  • Table 2: Global Market Value (USD Million) Forecast by Deployment Type , 2020 to 2035
  • Table 3: Global Market Value (USD Million) Forecast by Application, 2020 to 2035
  • Table 4: Global Market Value (USD Million) Forecast by Services, 2020 to 2035
  • Table 5: North America Market Value (USD Million) Forecast by Country, 2020 to 2035
  • Table 6: North America Market Value (USD Million) Forecast by Deployment Type , 2020 to 2035
  • Table 7: North America Market Value (USD Million) Forecast by Application, 2020 to 2035
  • Table 8: North America Market Value (USD Million) Forecast by Services, 2020 to 2035
  • Table 9: Latin America Market Value (USD Million) Forecast by Country, 2020 to 2035
  • Table 10: Latin America Market Value (USD Million) Forecast by Deployment Type , 2020 to 2035
  • Table 11: Latin America Market Value (USD Million) Forecast by Application, 2020 to 2035
  • Table 12: Latin America Market Value (USD Million) Forecast by Services, 2020 to 2035
  • Table 13: Western Europe Market Value (USD Million) Forecast by Country, 2020 to 2035
  • Table 14: Western Europe Market Value (USD Million) Forecast by Deployment Type , 2020 to 2035
  • Table 15: Western Europe Market Value (USD Million) Forecast by Application, 2020 to 2035
  • Table 16: Western Europe Market Value (USD Million) Forecast by Services, 2020 to 2035
  • Table 17: Eastern Europe Market Value (USD Million) Forecast by Country, 2020 to 2035
  • Table 18: Eastern Europe Market Value (USD Million) Forecast by Deployment Type , 2020 to 2035
  • Table 19: Eastern Europe Market Value (USD Million) Forecast by Application, 2020 to 2035
  • Table 20: Eastern Europe Market Value (USD Million) Forecast by Services, 2020 to 2035
  • Table 21: East Asia Market Value (USD Million) Forecast by Country, 2020 to 2035
  • Table 22: East Asia Market Value (USD Million) Forecast by Deployment Type , 2020 to 2035
  • Table 23: East Asia Market Value (USD Million) Forecast by Application, 2020 to 2035
  • Table 24: East Asia Market Value (USD Million) Forecast by Services, 2020 to 2035
  • Table 25: South Asia and Pacific Market Value (USD Million) Forecast by Country, 2020 to 2035
  • Table 26: South Asia and Pacific Market Value (USD Million) Forecast by Deployment Type , 2020 to 2035
  • Table 27: South Asia and Pacific Market Value (USD Million) Forecast by Application, 2020 to 2035
  • Table 28: South Asia and Pacific Market Value (USD Million) Forecast by Services, 2020 to 2035
  • Table 29: Middle East & Africa Market Value (USD Million) Forecast by Country, 2020 to 2035
  • Table 30: Middle East & Africa Market Value (USD Million) Forecast by Deployment Type , 2020 to 2035
  • Table 31: Middle East & Africa Market Value (USD Million) Forecast by Application, 2020 to 2035
  • Table 32: Middle East & Africa Market Value (USD Million) Forecast by Services, 2020 to 2035

List of Figures

  • Figure 1: Global Market Pricing Analysis
  • Figure 2: Global Market Value (USD Million) Forecast 2020-2035
  • Figure 3: Global Market Value Share and BPS Analysis by Deployment Type , 2025 and 2035
  • Figure 4: Global Market Y-o-Y Growth Comparison by Deployment Type , 2025-2035
  • Figure 5: Global Market Attractiveness Analysis by Deployment Type
  • Figure 6: Global Market Value Share and BPS Analysis by Application, 2025 and 2035
  • Figure 7: Global Market Y-o-Y Growth Comparison by Application, 2025-2035
  • Figure 8: Global Market Attractiveness Analysis by Application
  • Figure 9: Global Market Value Share and BPS Analysis by Services, 2025 and 2035
  • Figure 10: Global Market Y-o-Y Growth Comparison by Services, 2025-2035
  • Figure 11: Global Market Attractiveness Analysis by Services
  • Figure 12: Global Market Value (USD Million) Share and BPS Analysis by Region, 2025 and 2035
  • Figure 13: Global Market Y-o-Y Growth Comparison by Region, 2025-2035
  • Figure 14: Global Market Attractiveness Analysis by Region
  • Figure 15: North America Market Incremental Dollar Opportunity, 2025-2035
  • Figure 16: Latin America Market Incremental Dollar Opportunity, 2025-2035
  • Figure 17: Western Europe Market Incremental Dollar Opportunity, 2025-2035
  • Figure 18: Eastern Europe Market Incremental Dollar Opportunity, 2025-2035
  • Figure 19: East Asia Market Incremental Dollar Opportunity, 2025-2035
  • Figure 20: South Asia and Pacific Market Incremental Dollar Opportunity, 2025-2035
  • Figure 21: Middle East & Africa Market Incremental Dollar Opportunity, 2025-2035
  • Figure 22: North America Market Value Share and BPS Analysis by Country, 2025 and 2035
  • Figure 23: North America Market Value Share and BPS Analysis by Deployment Type , 2025 and 2035
  • Figure 24: North America Market Y-o-Y Growth Comparison by Deployment Type , 2025-2035
  • Figure 25: North America Market Attractiveness Analysis by Deployment Type
  • Figure 26: North America Market Value Share and BPS Analysis by Application, 2025 and 2035
  • Figure 27: North America Market Y-o-Y Growth Comparison by Application, 2025-2035
  • Figure 28: North America Market Attractiveness Analysis by Application
  • Figure 29: North America Market Value Share and BPS Analysis by Services, 2025 and 2035
  • Figure 30: North America Market Y-o-Y Growth Comparison by Services, 2025-2035
  • Figure 31: North America Market Attractiveness Analysis by Services
  • Figure 32: Latin America Market Value Share and BPS Analysis by Country, 2025 and 2035
  • Figure 33: Latin America Market Value Share and BPS Analysis by Deployment Type , 2025 and 2035
  • Figure 34: Latin America Market Y-o-Y Growth Comparison by Deployment Type , 2025-2035
  • Figure 35: Latin America Market Attractiveness Analysis by Deployment Type
  • Figure 36: Latin America Market Value Share and BPS Analysis by Application, 2025 and 2035
  • Figure 37: Latin America Market Y-o-Y Growth Comparison by Application, 2025-2035
  • Figure 38: Latin America Market Attractiveness Analysis by Application
  • Figure 39: Latin America Market Value Share and BPS Analysis by Services, 2025 and 2035
  • Figure 40: Latin America Market Y-o-Y Growth Comparison by Services, 2025-2035
  • Figure 41: Latin America Market Attractiveness Analysis by Services
  • Figure 42: Western Europe Market Value Share and BPS Analysis by Country, 2025 and 2035
  • Figure 43: Western Europe Market Value Share and BPS Analysis by Deployment Type , 2025 and 2035
  • Figure 44: Western Europe Market Y-o-Y Growth Comparison by Deployment Type , 2025-2035
  • Figure 45: Western Europe Market Attractiveness Analysis by Deployment Type
  • Figure 46: Western Europe Market Value Share and BPS Analysis by Application, 2025 and 2035
  • Figure 47: Western Europe Market Y-o-Y Growth Comparison by Application, 2025-2035
  • Figure 48: Western Europe Market Attractiveness Analysis by Application
  • Figure 49: Western Europe Market Value Share and BPS Analysis by Services, 2025 and 2035
  • Figure 50: Western Europe Market Y-o-Y Growth Comparison by Services, 2025-2035
  • Figure 51: Western Europe Market Attractiveness Analysis by Services
  • Figure 52: Eastern Europe Market Value Share and BPS Analysis by Country, 2025 and 2035
  • Figure 53: Eastern Europe Market Value Share and BPS Analysis by Deployment Type , 2025 and 2035
  • Figure 54: Eastern Europe Market Y-o-Y Growth Comparison by Deployment Type , 2025-2035
  • Figure 55: Eastern Europe Market Attractiveness Analysis by Deployment Type
  • Figure 56: Eastern Europe Market Value Share and BPS Analysis by Application, 2025 and 2035
  • Figure 57: Eastern Europe Market Y-o-Y Growth Comparison by Application, 2025-2035
  • Figure 58: Eastern Europe Market Attractiveness Analysis by Application
  • Figure 59: Eastern Europe Market Value Share and BPS Analysis by Services, 2025 and 2035
  • Figure 60: Eastern Europe Market Y-o-Y Growth Comparison by Services, 2025-2035
  • Figure 61: Eastern Europe Market Attractiveness Analysis by Services
  • Figure 62: East Asia Market Value Share and BPS Analysis by Country, 2025 and 2035
  • Figure 63: East Asia Market Value Share and BPS Analysis by Deployment Type , 2025 and 2035
  • Figure 64: East Asia Market Y-o-Y Growth Comparison by Deployment Type , 2025-2035
  • Figure 65: East Asia Market Attractiveness Analysis by Deployment Type
  • Figure 66: East Asia Market Value Share and BPS Analysis by Application, 2025 and 2035
  • Figure 67: East Asia Market Y-o-Y Growth Comparison by Application, 2025-2035
  • Figure 68: East Asia Market Attractiveness Analysis by Application
  • Figure 69: East Asia Market Value Share and BPS Analysis by Services, 2025 and 2035
  • Figure 70: East Asia Market Y-o-Y Growth Comparison by Services, 2025-2035
  • Figure 71: East Asia Market Attractiveness Analysis by Services
  • Figure 72: South Asia and Pacific Market Value Share and BPS Analysis by Country, 2025 and 2035
  • Figure 73: South Asia and Pacific Market Value Share and BPS Analysis by Deployment Type , 2025 and 2035
  • Figure 74: South Asia and Pacific Market Y-o-Y Growth Comparison by Deployment Type , 2025-2035
  • Figure 75: South Asia and Pacific Market Attractiveness Analysis by Deployment Type
  • Figure 76: South Asia and Pacific Market Value Share and BPS Analysis by Application, 2025 and 2035
  • Figure 77: South Asia and Pacific Market Y-o-Y Growth Comparison by Application, 2025-2035
  • Figure 78: South Asia and Pacific Market Attractiveness Analysis by Application
  • Figure 79: South Asia and Pacific Market Value Share and BPS Analysis by Services, 2025 and 2035
  • Figure 80: South Asia and Pacific Market Y-o-Y Growth Comparison by Services, 2025-2035
  • Figure 81: South Asia and Pacific Market Attractiveness Analysis by Services
  • Figure 82: Middle East & Africa Market Value Share and BPS Analysis by Country, 2025 and 2035
  • Figure 83: Middle East & Africa Market Value Share and BPS Analysis by Deployment Type , 2025 and 2035
  • Figure 84: Middle East & Africa Market Y-o-Y Growth Comparison by Deployment Type , 2025-2035
  • Figure 85: Middle East & Africa Market Attractiveness Analysis by Deployment Type
  • Figure 86: Middle East & Africa Market Value Share and BPS Analysis by Application, 2025 and 2035
  • Figure 87: Middle East & Africa Market Y-o-Y Growth Comparison by Application, 2025-2035
  • Figure 88: Middle East & Africa Market Attractiveness Analysis by Application
  • Figure 89: Middle East & Africa Market Value Share and BPS Analysis by Services, 2025 and 2035
  • Figure 90: Middle East & Africa Market Y-o-Y Growth Comparison by Services, 2025-2035
  • Figure 91: Middle East & Africa Market Attractiveness Analysis by Services
  • Figure 92: Global Market - Tier Structure Analysis
  • Figure 93: Global Market - Company Share Analysis
Dashboard
Dashboard
Dashboard
Dashboard
Dashboard
Dashboard

Full Research Suite comprises of:

Market outlook & trends analysis

Market outlook & trends analysis

Interviews & case studies

Interviews & case studies

Strategic recommendations

Strategic recommendations

Vendor profiles & capabilities analysis

Vendor profiles & capabilities analysis

5-year forecasts

5-year forecasts

8 regions and 60+ country-level data splits

8 regions and 60+ country-level data splits

Market segment data splits

Market segment data splits

12 months of continuous data updates

12 months of continuous data updates

DELIVERED AS:

PDF EXCEL ONLINE

Full Research Suite


$5000

$7500

$10000

Buy Report Now
Similar Industry Reports

Similar Industry Reports

Virtual Pipeline Market

Virtual Pipeline Market Size and Share Forecast Outlook 2025 to 2035

Virtual Customer Premises Equipment Market

Virtual Customer Premises Equipment Market Size and Share Forecast Outlook 2025 to 2035

Virtual Companion Care Market

Virtual Companion Care Market Size and Share Forecast Outlook 2025 to 2035

Virtualized Radio Access Network Market

Virtualized Radio Access Network Market Size and Share Forecast Outlook 2025 to 2035

Virtual Workspace Solutions Market

Virtual Workspace Solutions Market Size and Share Forecast Outlook 2025 to 2035

Virtual Prototype Market

Virtual Prototype Market Size and Share Forecast Outlook 2025 to 2035

Virtual Assistant Services Market

Virtual Assistant Services Market Size and Share Forecast Outlook 2025 to 2035

Virtual Power Plant (VPP) and V2G Orchestration Market

Virtual Power Plant (VPP) and V2G Orchestration Market Analysis - Size, Share, and Forecast Outlook 2025 to 2035

Virtual Power Plant Market

Virtual Power Plant Market Size and Share Forecast Outlook 2025 to 2035

Virtual Machines Market

Virtual Machines Market by Type, by Enterprise Size, by Industry & Region Forecast till 2035

Virtual Extensible LAN (VXLAN) Market

Virtual Extensible LAN (VXLAN) Market Size and Share Forecast Outlook 2025 to 2035

Virtual Private Cloud Market

Virtual Private Cloud Market Size and Share Forecast Outlook 2025 to 2035

Virtual PLC and Soft PLC Market

Virtual PLC and Soft PLC Market Size and Share Forecast Outlook 2025 to 2035

Virtual Private Network VPN Market

Virtual Private Network VPN Market Size and Share Forecast Outlook 2025 to 2035

Virtualized Evolved Packet Core (vEPC) Market

Virtualized Evolved Packet Core (vEPC) Market Size and Share Forecast Outlook 2025 to 2035

Virtual Cards Market

Virtual Cards Market Size and Share Forecast Outlook 2025 to 2035

Virtual Try-On Platform Market

Virtual Try-On Platform Market Analysis Size and Share Forecast Outlook 2025 to 2035

Virtual Private Server Market

Virtual Private Server Market Size and Share Forecast Outlook 2025 to 2035

Virtual Client Computing Market

Virtual Client Computing Market Size and Share Forecast Outlook 2025 to 2035

Virtual Event Platforms Market

Virtual Event Platforms Market Trends - Growth & Forecast 2025 to 2035

Future Market Insights

Virtual Infrastructure Manager Market

Chat With MaRIA

Chat With

MaRIA

Hi There, I am MaRIA, Your Market Research Intelligence Assistant. How may I help you?