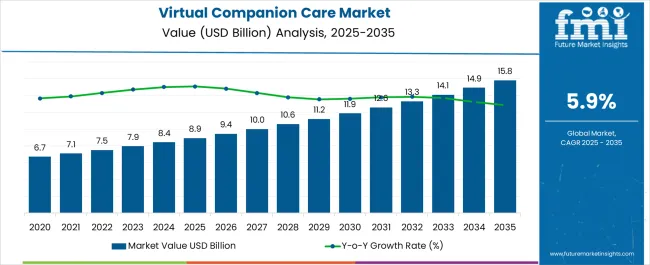
The Virtual Companion Care Market is estimated to be valued at USD 8.9 billion in 2025 and is projected to reach USD 15.8 billion by 2035, registering a compound annual growth rate (CAGR) of 5.9% over the forecast period.
| Metric | Value |
|---|---|
| Virtual Companion Care Market Estimated Value in (2025 E) | USD 8.9 billion |
| Virtual Companion Care Market Forecast Value in (2035 F) | USD 15.8 billion |
| Forecast CAGR (2025 to 2035) | 5.9% |
The virtual companion care market is experiencing rapid adoption due to the rising need for accessible and affordable elder care solutions, coupled with growing investments in digital health infrastructure. Increasing aging populations and shortages of professional caregivers have accelerated demand for technology-enabled companionship and monitoring services.
Video-based platforms are enabling real-time interaction, emotional support, and health tracking, thereby bridging the gap between patients and caregivers in both home-based and institutional settings. Integration of artificial intelligence and remote monitoring technologies is enhancing the personalization and efficiency of these services.
Regulatory support for telehealth reimbursement and wider acceptance of digital caregiving solutions are further contributing to expansion. The future outlook remains favorable as healthcare providers, insurers, and families increasingly recognize the role of virtual companion care in improving quality of life, reducing isolation, and supporting sustainable care delivery models.
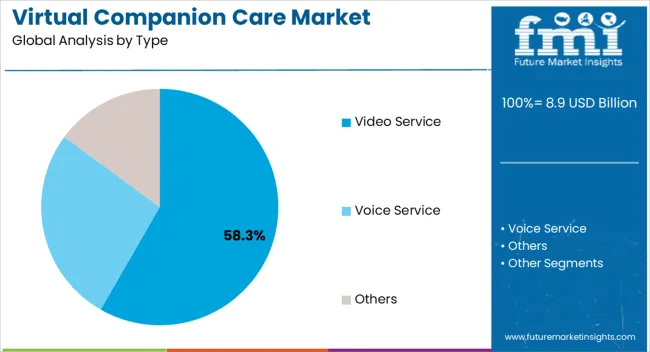
The video service segment is projected to account for 58.30% of total revenue by 2025 within the type category, making it the most dominant offering. Its leadership is attributed to the ability to deliver real-time visual interaction, improved emotional engagement, and higher trust levels compared to audio-only services.
Video platforms enable caregivers to observe patient behavior, environment, and potential risks, thus enhancing safety and responsiveness. Additionally, the integration of features such as virtual health monitoring, personalized reminders, and interactive sessions has strengthened adoption.
With the rising focus on reducing loneliness and providing continuous emotional support, video services have become the preferred solution for families and institutions, reinforcing their prominence in the market.
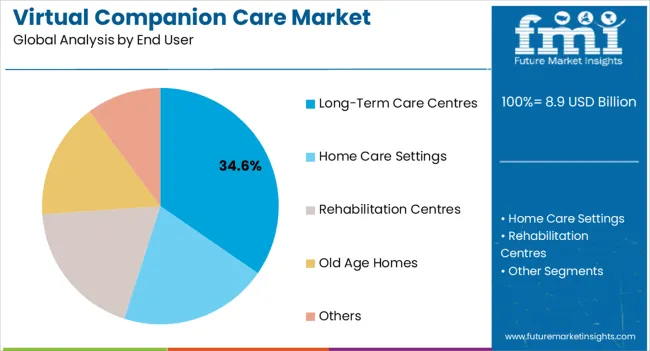
The long term care centres segment is expected to contribute 34.60% of total market revenue by 2025, positioning it as the leading end user category. This dominance is driven by the growing need for structured companionship services in facilities housing elderly individuals with limited mobility or chronic health conditions.
Virtual companion platforms in these centers support staff efficiency by supplementing in-person care with continuous digital monitoring and engagement. The ability to deliver tailored companionship programs, reduce social isolation, and provide timely health reminders has made adoption highly beneficial in institutional settings.
As long term care centres face rising patient volumes and staffing challenges, virtual companion care solutions are being increasingly integrated to improve resident well-being and operational effectiveness, cementing this segment’s leading position in the market.
Virtual companion care services in the United States cost approximately USD 200 per month. Virtual companion care services have made caring for seniors very easy and feasible. According to the USA Department of Health and Human Services and the National Ambulatory Medical Care Survey, the population over 65 in the United States is estimated to likely be doubled by 2035.
The primary factors driving the demand for virtual companion care are:
Some existing challenges for the global market growth:
These technologies can provide only companionship as much as busy family members can.
Virtual companion care provides an alternative that can substitute for in-person human contact and alleviate loneliness. The concept of virtual caregiving, however, cannot replace human companionship, although it can be viewed as a way to decrease the time for companion sessions and thus is cost-saving.
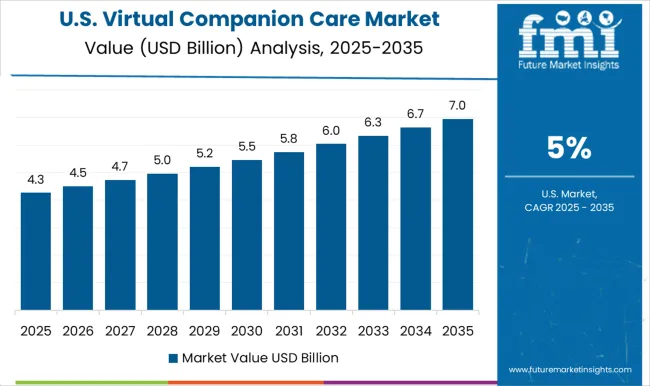
| Attributes | Details |
|---|---|
| Market CAGR (2025 to 2035) | 6.2% |
| Market Valuation (2025) | USD 7.9 million |
| Market Valuation (2035) | USD 14.4 million |
| Countries | Forecast Share Between 2025 to 2035 |
|---|---|
| United States | 28.6% |
| Germany | 9.5% |
| Japan | 4.4% |
| Countries | Forecast CAGR Between 2025 to 2035 |
|---|---|
| China | 7.4% |
| India | 6.3% |
| United Kingdom | 4.8% |
| Australia | 5.1% |
As per the global market by FMI, 30.3% share of the global market belongs to North America.
High penetration of technology and the internet among the elderly population might surge the virtual companion market share in the region. Moreover, the busy lifestyle of people who are aged between 25 to 45 years is something that might further drive the market. Additionally, an increase in the geriatric population might further the growth of the global market.
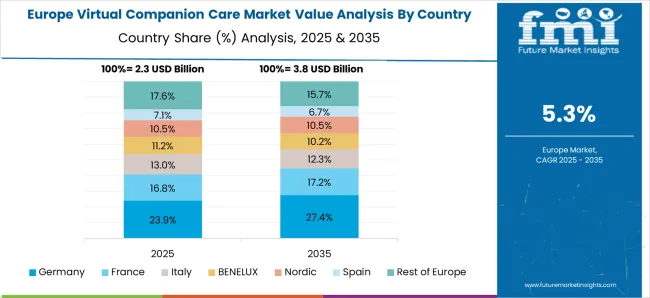
According to the global market report, the Europe region is contributing 33.5% of the market.
Europe has become the large market due to government initiatives for providing companion care to older people. Also, the higher adoption of telecommunication and internet connections by aged people has helped them comfortably use virtual care management services. All this is anticipated to impact the virtual companion care adoption trends.
Moreover, a genuine is estimated toingness to have someone who would talk to them when these people are alone is also expected to drive the global market.
Even in developed countries such as the United States and Europe, the concept of virtual companionship has yet to be readily adopted by the general population. Government support has been remarkable in this direction and has resulted in the emergence of new virtual care service providers in several regions.
For instance, under its Eurostatrs Program, European Union is developing the Naviga platform, which allows older people and persons with disability to access the internet and support groups. The platform also provides home rehabilitation physiotherapy through virtual reality applications.
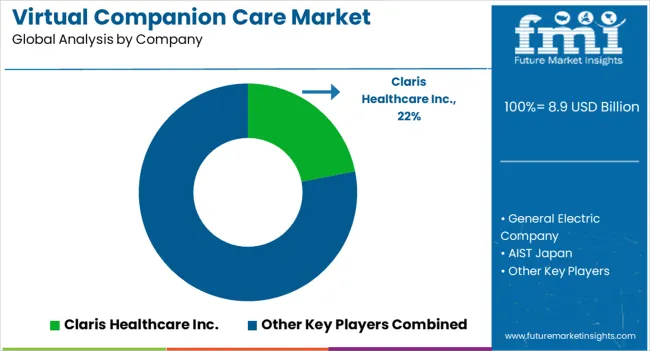
The market for virtual companion care is in the early stage of development, and the majority of the population in developing countries is yet to get a first-hand experience with such a service. Typically, a majority of the platforms are developed by universities and educational institutions as a part of the curriculum. However, the rising demand for virtual companion care services nationwide has led to the entry of private players with full-fledged support services.
Recent Developments in the Global Market:
| Attributes | Details |
|---|---|
| Forecast Period | 2025 to 2035 |
| Historical Data Available for | 2020 to 2025 |
| Market Analysis | USD billion for Value |
| Key Countries Covered | United States, United Kingdom, Japan, India, China, Australia, Germany |
| Key Segments Covered | Type, End Use industry, Region |
| Key Companies Profiled | Claris Healthcare Inc.; General Electric Company; AIST Japan; GeriJoy Limited; Living Assistance Services Inc. |
| Report Coverage | Market Forecast, Company Share Analysis, Competition Intelligence, DROT Analysis, Market Dynamics and Challenges, and Strategic Growth Initiatives |
| Customization & Pricing | Available upon Request |
The global virtual companion care market is estimated to be valued at USD 8.9 billion in 2025.
The market size for the virtual companion care market is projected to reach USD 15.8 billion by 2035.
The virtual companion care market is expected to grow at a 5.9% CAGR between 2025 and 2035.
The key product types in virtual companion care market are video service, voice service and others.
In terms of end user, long-term care centres segment to command 34.6% share in the virtual companion care market in 2025.


Our Research Products

The "Full Research Suite" delivers actionable market intel, deep dives on markets or technologies, so clients act faster, cut risk, and unlock growth.

The Leaderboard benchmarks and ranks top vendors, classifying them as Established Leaders, Leading Challengers, or Disruptors & Challengers.

Locates where complements amplify value and substitutes erode it, forecasting net impact by horizon

We deliver granular, decision-grade intel: market sizing, 5-year forecasts, pricing, adoption, usage, revenue, and operational KPIs—plus competitor tracking, regulation, and value chains—across 60 countries broadly.

Spot the shifts before they hit your P&L. We track inflection points, adoption curves, pricing moves, and ecosystem plays to show where demand is heading, why it is changing, and what to do next across high-growth markets and disruptive tech

Real-time reads of user behavior. We track shifting priorities, perceptions of today’s and next-gen services, and provider experience, then pace how fast tech moves from trial to adoption, blending buyer, consumer, and channel inputs with social signals (#WhySwitch, #UX).

Partner with our analyst team to build a custom report designed around your business priorities. From analysing market trends to assessing competitors or crafting bespoke datasets, we tailor insights to your needs.
Supplier Intelligence
Discovery & Profiling
Capacity & Footprint
Performance & Risk
Compliance & Governance
Commercial Readiness
Who Supplies Whom
Scorecards & Shortlists
Playbooks & Docs
Category Intelligence
Definition & Scope
Demand & Use Cases
Cost Drivers
Market Structure
Supply Chain Map
Trade & Policy
Operating Norms
Deliverables
Buyer Intelligence
Account Basics
Spend & Scope
Procurement Model
Vendor Requirements
Terms & Policies
Entry Strategy
Pain Points & Triggers
Outputs
Pricing Analysis
Benchmarks
Trends
Should-Cost
Indexation
Landed Cost
Commercial Terms
Deliverables
Brand Analysis
Positioning & Value Prop
Share & Presence
Customer Evidence
Go-to-Market
Digital & Reputation
Compliance & Trust
KPIs & Gaps
Outputs
Full Research Suite comprises of:
Market outlook & trends analysis
Interviews & case studies
Strategic recommendations
Vendor profiles & capabilities analysis
5-year forecasts
8 regions and 60+ country-level data splits
Market segment data splits
12 months of continuous data updates
DELIVERED AS:
PDF EXCEL ONLINE
Healthcare Companion Robots Market Size and Share Forecast Outlook 2025 to 2035
Healthcare Virtual Assistants Market Analysis by Product, End User and Region Through 2035
Companion Animal Healthcare Market Size and Share Forecast Outlook 2025 to 2035
Virtual Land NFT Market Size and Share Forecast Outlook 2025 to 2035
Virtual Pipeline Market Size and Share Forecast Outlook 2025 to 2035
Virtual Customer Premises Equipment Market Size and Share Forecast Outlook 2025 to 2035
Virtual Infrastructure Manager Market Size and Share Forecast Outlook 2025 to 2035
Companion Animal Genetics Market Size and Share Forecast Outlook 2025 to 2035
Companion Animal Cardiac Drugs Market Size and Share Forecast Outlook 2025 to 2035
Virtualized Radio Access Network Market Size and Share Forecast Outlook 2025 to 2035
Virtual Workspace Solutions Market Size and Share Forecast Outlook 2025 to 2035
Virtual Prototype Market Size and Share Forecast Outlook 2025 to 2035
Virtual Assistant Services Market Size and Share Forecast Outlook 2025 to 2035
Virtual Power Plant (VPP) and V2G Orchestration Market Analysis - Size, Share, and Forecast Outlook 2025 to 2035
Virtual Power Plant Market Size and Share Forecast Outlook 2025 to 2035
Virtual Machines Market by Type, by Enterprise Size, by Industry & Region Forecast till 2035
Virtual Extensible LAN (VXLAN) Market Size and Share Forecast Outlook 2025 to 2035
Virtual Private Cloud Market Size and Share Forecast Outlook 2025 to 2035
Virtual PLC and Soft PLC Market Size and Share Forecast Outlook 2025 to 2035
Virtual Private Network VPN Market Size and Share Forecast Outlook 2025 to 2035

Thank you!
You will receive an email from our Business Development Manager. Please be sure to check your SPAM/JUNK folder too.
Chat With
MaRIA