Virtual Private Cloud Market Outlook (2022 to 2032)

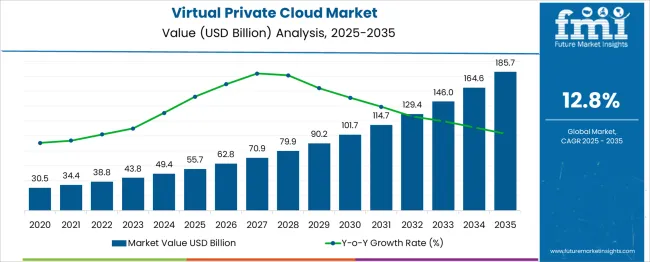
The Virtual Private Cloud Market is anticipated to have a steady CAGR of 12.8% during the period 2022 to 2032.The virtual private cloud market share is predicted to grow from USD 38.8 Billion in 2022 to USD 129.6 Billion in 2032.

Previously, the demand for virtual private cloud was thriving at a higher CAGR of 23.3% (2016 to 2021), resulting in a market size of USD 31.6 Billion in 2021.

The rising demand for simple installation and low-cost disaster recovery solutions, as well as the growing adoption of virtual private cloud among small and medium businesses, are driving the virtual private cloud market's growth over the forecast period.

However, in some countries, weak internet infrastructure may limit the demand for virtual private cloud business. Furthermore, the growing IoT market is expected to open up new prospects in the virtual private cloud market.

Attributes Details
Virtual Private Cloud Market CAGR (2022 to 2032) 12.8%
Virtual Private Cloud Market Size (2022) USD 38.8 Billion
Virtual Private Cloud Market Size (2032) USD 129.6 Billion

What is Propelling the Virtual Private Cloud Market?

The growing need for businesses to have a safe environment for cloud mobility has resulted in a surge in the adoption of virtual private cloud services. SMEs are also using a huge number of private clouds for the organization's security in order to boost income opportunities.

Many industries have begun to embrace the growing need for agility and automation. This is changing the virtual private cloud market outlook drastically.

The rapid increase in demand from small and medium enterprises, the increasing adoption of cloud-based services by large enterprises across various industry verticals, and the increased number of data breaches over a network, which is primarily due to unauthorized access by third parties, are some of the key factors driving the adoption of virtual private cloud.

Poor internet infrastructure in some nations may provide a hindrance to the growth of demand for virtual private clouds. The growth of the Internet of Things is likely to open up chances for the virtual private cloud business.

What are the Trends in the Virtual Private Cloud Market?

The virtual private cloud market has grown as the demand for security, IT modernization, agility, automation of manual processes, and rising cost reductions has increased. On the contrary, a scarcity of professionals is limiting the virtual private cloud market expansion.

Governments have been heavily investing in digitizing their operations in order to boost productivity and save costs through effective management methods, resulting in the widespread adoption of virtual private clouds among businesses. Furthermore, fast-evolving digitization business models such as as a service have considerably aided product innovation and development among virtual private cloud providers worldwide.

What is the Segmentation Outlook of the Virtual Private Cloud Market?

The virtual private cloud market is divided into banking, financial services and insurance, IT and telecom, government and defense, healthcare, media and entertainment, retail, manufacturing, and others, by vertical.

With the rise in real-time mobile payment services, the BFSI virtual private cloud industry is expected to witness the most widespread use of the virtual private cloud. Various customer-centric models have emerged as a result of the increased need for streamlined transactions.

The expanding presence of digitalization activities, as well as growing worries about data storage, recovery, and cybersecurity in BFSI businesses, is projected to boost the demand for virtual private clouds.

Which is the Leading Segment in the Virtual Private Cloud Market by Organisation Size?

The virtual private cloud market is divided into large and small enterprises as per the organization size. As per the virtual private cloud market analysis, because of the growing volume of data and the increased need for effective storage and management, major organizations are predicted to bring substantial recompense to the VPC sector, based on their size.

Large enterprises have led the way for enhanced flexibility by running many applications. Virtual private cloud solutions not only increase performance when implementing resource-intensive applications but also save money. The growing trend of organizational mobility is anticipated to help the virtual private cloud market grow even faster.

Which is the Leading Region in the Virtual Private Cloud Market?

During the projected period, North America is expected to have the biggest virtual private cloud market share.

The existence of multiple businesses supplying and the rising adoption of virtual private cloud has made the region an established market. The key reasons driving cloud computing usage in North America are organizations' shifts toward innovative technologies and the rising adoption of digital business strategies.

The market in North America is likely to be driven by enterprises' rising budget allocation for cloud services. The major North American countries likely to contribute to the virtual private cloud market are the USA and Canada.

The development in technological transformation projects and strong economic advancements in China and India are likely to produce significant revenue for the virtual private cloud business in the Asia Pacific due to the high rates of adoption of virtual private cloud in the region.

Regions CAGR (2022 to 2032)
United States 12.5%
United Kingdom 11.8%
China 12.1%
Japan 11.0%
South Korea 10.3%

How Competition Influences the Virtual Private Cloud Market?

In order to strengthen their competitive position and global presence, virtual private cloud market players are actively pursuing strategic collaborations, including mergers and acquisitions, as well as working on incorporating the latest technology into their services to come up with innovations. The virtual private cloud market is highly competitive.

Some of the recent developments in the virtual private cloud market are:

In February 2021, IBM and Vodafone partnered to launch Vodafone Virtual Private Cloud, a new private cloud platform designed to help Vodafone's Portuguese enterprise clients with scalability, efficiency, and security.

Dell Technologies unveiled Project Apex, a new private cloud service, in February 2021. Dell Technologies Cloud Platform is likely to enable clients to scale up or down their IT infrastructures as a result of the launch.

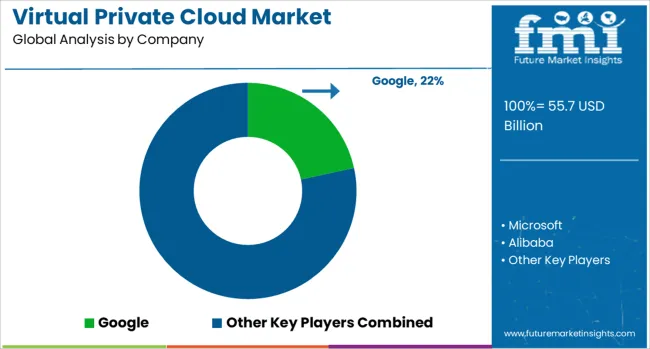
Key Players

  • Google
  • Microsoft
  • Alibaba
  • AWS
  • OVH
  • Huawei
  • Rackspace
  • CenturyLink
  • DXC
  • Atos

Key Segments

By Component:

  • Software
  • Services

By Organisation Size:

  • Small and Medium-Sized Enterprises
  • Large Enterprises

By Vertical:

  • Banking, Financial Services, and Insurance
  • IT and Telecom
  • Government and Defence
  • Healthcare
  • Media and Entertainment
  • Retail
  • Manufacturing
  • Others

By Region:

  • North America
  • Europe
  • Asia Pacific
  • Middle East and Africa
  • Latin America

Table of Content

  • 1. Executive Summary | Virtual Private Cloud Market
  • 2. Market Overview
  • 3. Market Risks and Trends Assessment
  • 4. Market Background
  • 5. Key Success Factors
  • 6. Global Market Demand Analysis 2015 to 2021 and Forecast, 2022 to 2032
  • 7. Global Market Value Analysis 2015 to 2021 and Forecast, 2022 to 2032
  • 8. Global Market Analysis 2015 to 2021 and Forecast 2022 to 2032, By Organization Size
    • 8.1. Small and Medium-Sized Enterprises
    • 8.2. Large Enterprises
  • 9. Global Market Analysis 2015 to 2021 and Forecast 2022 to 2032, By Vertical
    • 9.1. Banking, Financial Services, and Insurance
    • 9.2. IT and Telecom
    • 9.3. Government and Defense
    • 9.4. Healthcare
    • 9.5. Media and Entertainment
    • 9.6. Retail
    • 9.7. Manufacturing
    • 9.8. Others
  • 10. Global Market Analysis 2015 to 2021 and Forecast 2022 to 2032, By Component
    • 10.1. Software
    • 10.2. Services
      • 10.2.1. Training and Consulting
      • 10.2.2. Integration and Deployment
      • 10.2.3. Support and Maintenance
      • 10.2.4. Managed Services
  • 11. Global Market Analysis 2015 to 2021 and Forecast 2022 to 2032, By Region
    • 11.1. North America
    • 11.2. Latin America
    • 11.3. Europe
    • 11.4. Asia Pacific
    • 11.5. Middle East and Africa (MEA)
  • 12. North America Market Analysis 2015 to 2021 and Forecast 2022 to 2032
  • 13. Latin America Market Analysis 2015 to 2021 and Forecast 2022 to 2032
  • 14. Europe Market Analysis 2015 to 2021 and Forecast 2022 to 2032
  • 15. Asia Pacific Market Analysis 2015 to 2021 and Forecast 2022 to 2032
  • 16. Middle East and Africa Market Analysis 2015 to 2021 and Forecast 2022 to 2032
  • 17. Key Countries Market Analysis 2015 to 2021 and Forecast 2022 to 2032
  • 18. Market Structure Analysis
  • 19. Competition Analysis
    • 19.1. Google
    • 19.2. Microsoft
    • 19.3. Alibaba
    • 19.4. OVH
    • 19.5. Huawei
    • 19.6. Rackspace
    • 19.7. AWS
    • 19.8. CenturyLink
    • 19.9. DXC
    • 19.10. Atos
  • 20. Assumptions and Acronyms Used
  • 21. Research Methodology

List of Tables

Table 1: Global Market Value (US$ Million), By Organization Size, 2015 to 2021

Table 2: Global Market Value (US$ Million), By Organization Size, 2022 to 2032

Table 3: Global Market Value (US$ Million), By Component, 2015 to 2021

Table 4: Global Market Value (US$ Million), By Component, 2022 to 2032

Table 5: Global Market Value (US$ Million), By Vertical, 2015 to 2021

Table 6: Global Market Value (US$ Million), By Vertical, 2022 to 2032

Table 7: Global Market, By Region, 2015 to 2021

Table 8: Global Market, By Region, 2022 to 2032

Table 9: North America Market Value (US$ Million), By Organization Size, 2015 to 2021

Table 10: North America Market Value (US$ Million), By Organization Size, 2022 to 2032

Table 11: North America Market Value (US$ Million), By Component, 2015 to 2021

Table 12: North America Market Value (US$ Million), By Component, 2022 to 2032

Table 13: North America Market Value (US$ Million), By Vertical, 2015 to 2021

Table 14: North America Market Value (US$ Million), By Vertical, 2022 to 2032

Table 15: North America Market, By Country, 2015 to 2021

Table 16: North America Market, By Country, 2022 to 2032

Table 17: Latin America Market Value (US$ Million), By Organization Size, 2015 to 2021

Table 18: Latin America Market Value (US$ Million), By Organization Size, 2022 to 2032

Table 19: Latin America Market Value (US$ Million), By Component, 2015 to 2021

Table 20: Latin America Market Value (US$ Million), By Component, 2022 to 2032

Table 21: Latin America Market Value (US$ Million), By Vertical, 2015 to 2021

Table 22: Latin America Market Value (US$ Million), By Vertical, 2022 to 2032

Table 23: Latin America Market, By Country, 2015 to 2021

Table 24: Latin America Market, By Country, 2022 to 2032

Table 25: Europe Market Value (US$ Million), By Organization Size, 2015 to 2021

Table 26: Europe Market Value (US$ Million), By Organization Size, 2022 to 2032

Table 27: Europe Market Value (US$ Million), By Component, 2015 to 2021

Table 28: Europe Market Value (US$ Million), By Component, 2022 to 2032

Table 29: Europe Market Value (US$ Million), By Vertical, 2015 to 2021

Table 30: Europe Market Value (US$ Million), By Vertical, 2022 to 2032

Table 31: Europe Market, By Country, 2015 to 2021

Table 32: Europe Market, By Country, 2022 to 2032

Table 33: Asia Pacific Market Value (US$ Million), By Organization Size, 2015 to 2021

Table 34: Asia Pacific Market Value (US$ Million), By Organization Size, 2022 to 2032

Table 35: Asia Pacific Market Value (US$ Million), By Component, 2015 to 2021

Table 36: Asia Pacific Market Value (US$ Million), By Component, 2022 to 2032

Table 37: Asia Pacific Market Value (US$ Million), By Vertical, 2015 to 2021

Table 38: Asia Pacific Market Value (US$ Million), By Vertical, 2022 to 2032

Table 39: Asia Pacific Market, By Country, 2015 to 2021

Table 40: Asia Pacific Market, By Country, 2022 to 2032

Table 41: MEA Market Value (US$ Million), By Organization Size, 2015 to 2021

Table 42: MEA Market Value (US$ Million), By Organization Size, 2022 to 2032

Table 43: MEA Market Value (US$ Million), By Component, 2015 to 2021

Table 44: MEA Market Value (US$ Million), By Component, 2022 to 2032

Table 45: MEA Market Value (US$ Million), By Vertical, 2015 to 2021

Table 46: MEA Market Value (US$ Million), By Vertical, 2022 to 2032

Table 47: MEA Market, By Country, 2015 to 2021

Table 48: MEA Market, By Country, 2022 to 2032

Table 49: Global Market Incremental $ Opportunity, By Organization Size, 2015 to 2021

Table 50: Global Market Incremental $ Opportunity, By Component, 2022 to 2032

Table 51: Global Market Incremental $ Opportunity, By Vertical, 2015 to 2021

Table 52: Global Market Incremental $ Opportunity, By Region, 2022 to 2032

Table 53: North America Market Incremental $ Opportunity, By Organization Size, 2015 to 2021

Table 54: North America Market Incremental $ Opportunity, By Component, 2022 to 2032

Table 55: North America Market Incremental $ Opportunity, By Vertical, 2015 to 2021

Table 56: North America Market Incremental $ Opportunity, By Country, 2022 to 2032

Table 57: Latin America Market Incremental $ Opportunity, By Organization Size, 2015 to 2021

Table 58: Latin America Market Incremental $ Opportunity, By Component, 2022 to 2032

Table 59: Latin America Market Incremental $ Opportunity, By Vertical, 2015 to 2021

Table 60: Latin America Market Incremental $ Opportunity, By Country, 2022 to 2032

Table 61: Europe Market Incremental $ Opportunity, By Organization Size, 2015 to 2021

Table 62: Europe Market Incremental $ Opportunity, By Component, 2022 to 2032

Table 63: Europe Market Incremental $ Opportunity, By Vertical, 2015 to 2021

Table 64: Europe Market Incremental $ Opportunity, By Country, 2022 to 2032

Table 65: Asia Pacific Market Incremental $ Opportunity, By Organization Size, 2015 to 2021

Table 66: Asia Pacific Market Incremental $ Opportunity, By Component, 2022 to 2032

Table 67: Asia Pacific Market Incremental $ Opportunity, By Vertical, 2015 to 2021

Table 68: Asia Pacific Market Incremental $ Opportunity, By Country, 2022 to 2032

Table 69: MEA Market Incremental $ Opportunity, By Organization Size, 2015 to 2021

Table 70: MEA Market Incremental $ Opportunity, By Component, 2022 to 2032

Table 71: MEA Market Incremental $ Opportunity, By Vertical, 2015 to 2021

Table 72: MEA Market Incremental $ Opportunity, By Country, 2022 to 2032

List of Figures

Figure 1: Global Market Value (US$ Million) and Year-on-Year Growth, 2015 to 2032

Figure 2: Global Market Absolute $ Historical Gain (2015 to 2021) and Opportunity (2022 to 2032), US$ Million

Figure 3: Global Market Share, By Organization Size, 2022 & 2032

Figure 4: Global Market Y-o-Y Growth Projections, By Organization Size - 2022 to 2032

Figure 5: Global Market Attractiveness Index, By Organization Size - 2022 to 2032

Figure 6: Global Market Share, By Component, 2022 & 2032

Figure 7: Global Market Y-o-Y Growth Projections, By Component - 2022 to 2032

Figure 8: Global Market Attractiveness Index, By Component - 2022 to 2032

Figure 9: Global Market Share, By Vertical, 2022 & 2032

Figure 10: Global Market Y-o-Y Growth Projections, By Vertical - 2022 to 2032

Figure 11: Global Market Attractiveness Index, By Vertical - 2022 to 2032

Figure 12: Global Market Share, By Region, 2022 & 2032

Figure 13: Global Market Y-o-Y Growth Projections, By Region - 2022 to 2032

Figure 14: Global Market Attractiveness Index, By Region - 2022 to 2032

Figure 15: North America Market Value (US$ Million) and Year-on-Year Growth, 2015 to 2032

Figure 16: North America Market Absolute $ Opportunity Historical (2015 to 2021) and Forecast Period (2022 to 2032), US$ Million

Figure 17: North America Market Share, By Organization Size, 2022 & 2032

Figure 18: North America Market Y-o-Y Growth Projections, By Organization Size - 2022 to 2032

Figure 19: North America Market Attractiveness Index, By Organization Size - 2022 to 2032

Figure 20: North America Market Share, By Component, 2022 & 2032

Figure 21: North America Market Y-o-Y Growth Projections, By Component - 2022 to 2032

Figure 22: North America Market Attractiveness Index, By Component - 2022 to 2032

Figure 23: North America Market Share, By Vertical, 2022 & 2032

Figure 24: North America Market Y-o-Y Growth Projections, By Vertical - 2022 to 2032

Figure 25: North America Market Attractiveness Index, By Vertical - 2022 to 2032

Figure 26: North America Market Share, By Country, 2022 & 2032

Figure 27: North America Market Y-o-Y Growth Projections, By Country - 2022 to 2032

Figure 28: North America Market Attractiveness Index, By Country - 2022 to 2032

Figure 29: Latin America Market Value (US$ Million) and Year-on-Year Growth, 2015 to 2032

Figure 30: Latin America Market Absolute $ Opportunity Historical (2015 to 2021) and Forecast Period (2022 to 2032), US$ Million

Figure 31: Latin America Market Share, By Organization Size, 2022 & 2032

Figure 32: Latin America Market Y-o-Y Growth Projections, By Organization Size - 2022 to 2032

Figure 33: Latin America Market Attractiveness Index, By Organization Size - 2022 to 2032

Figure 34: Latin America Market Share, By Component, 2022 & 2032

Figure 35: Latin America Market Y-o-Y Growth Projections, By Component - 2022 to 2032

Figure 36: Latin America Market Attractiveness Index, By Component - 2022 to 2032

Figure 37: Latin America Market Share, By Vertical, 2022 & 2032

Figure 38: Latin America Market Y-o-Y Growth Projections, By Vertical - 2022 to 2032

Figure 39: Latin America Market Attractiveness Index, By Vertical - 2022 to 2032

Figure 40: Latin America Market Share, By Country, 2022 & 2032

Figure 41: Latin America Market Y-o-Y Growth Projections, By Country - 2022 to 2032

Figure 42: Latin America Market Attractiveness Index, By Country - 2022 to 2032

Figure 43: Europe Market Value (US$ Million) and Year-on-Year Growth, 2015 to 2032

Figure 44: Europe Market Absolute $ Opportunity Historical (2015 to 2021) and Forecast Period (2022 to 2032), US$ Million

Figure 45: Europe Market Share, By Organization Size, 2022 & 2032

Figure 46: Europe Market Y-o-Y Growth Projections, By Organization Size - 2022 to 2032

Figure 47: Europe Market Attractiveness Index, By Organization Size - 2022 to 2032

Figure 48: Europe Market Share, By Component, 2022 & 2032

Figure 49: Europe Market Y-o-Y Growth Projections, By Component - 2022 to 2032

Figure 50: Europe Market Attractiveness Index, By Component - 2022 to 2032

Figure 51: Europe Market Share, By Vertical, 2022 & 2032

Figure 52: Europe Market Y-o-Y Growth Projections, By Vertical - 2022 to 2032

Figure 53: Europe Market Attractiveness Index, By Vertical - 2022 to 2032

Figure 54: Europe Market Share, By Country, 2022 & 2032

Figure 55: Europe Market Y-o-Y Growth Projections, By Country - 2022 to 2032

Figure 56: Europe Market Attractiveness Index, By Country - 2022 to 2032

Figure 57: MEA Market Value (US$ Million) and Year-on-Year Growth, 2015 to 2032

Figure 58: MEA Market Absolute $ Opportunity Historical (2015 to 2021) and Forecast Period (2022 to 2032), US$ Million

Figure 59: MEA Market Share, By Organization Size, 2022 & 2032

Figure 60: MEA Market Y-o-Y Growth Projections, By Organization Size - 2022 to 2032

Figure 61: MEA Market Attractiveness Index, By Organization Size - 2022 to 2032

Figure 62: MEA Market Share, By Component, 2022 & 2032

Figure 63: MEA Market Y-o-Y Growth Projections, By Component - 2022 to 2032

Figure 64: MEA Market Attractiveness Index, By Component - 2022 to 2032

Figure 65: MEA Market Share, By Vertical, 2022 & 2032

Figure 66: MEA Market Y-o-Y Growth Projections, By Vertical - 2022 to 2032

Figure 67: MEA Market Attractiveness Index, By Vertical - 2022 to 2032

Figure 68: MEA Market Share, By Country, 2022 & 2032

Figure 69: MEA Market Y-o-Y Growth Projections, By Country - 2022 to 2032

Figure 70: MEA Market Attractiveness Index, By Country - 2022 to 2032

Figure 71: Asia Pacific Market Value (US$ Million) and Year-on-Year Growth, 2015 to 2032

Figure 72: Asia Pacific Market Absolute $ Opportunity Historical (2015 to 2021) and Forecast Period (2022 to 2032), US$ Million

Figure 73: Asia Pacific Market Share, By Organization Size, 2022 & 2032

Figure 74: Asia Pacific Market Y-o-Y Growth Projections, By Organization Size - 2022 to 2032

Figure 75: Asia Pacific Market Attractiveness Index, By Organization Size - 2022 to 2032

Figure 76: Asia Pacific Market Share, By Component, 2022 & 2032

Figure 77: Asia Pacific Market Y-o-Y Growth Projections, By Component - 2022 to 2032

Figure 78: Asia Pacific Market Attractiveness Index, By Component - 2022 to 2032

Figure 79: Asia Pacific Market Share, By Vertical, 2022 & 2032

Figure 80: Asia Pacific Market Y-o-Y Growth Projections, By Vertical - 2022 to 2032

Figure 81: Asia Pacific Market Attractiveness Index, By Vertical - 2022 to 2032

Figure 82: Asia Pacific Market Share, By Country, 2022 & 2032

Figure 83: Asia Pacific Market Y-o-Y Growth Projections, By Country - 2022 to 2032

Figure 84: Asia Pacific Market Attractiveness Index, By Country - 2022 to 2032

Figure 85: USA Market Value (US$ Million) and Forecast, 2022 to 2032

Figure 86: USA Market Share, By Organization Size, 2021

Figure 87: USA Market Share, By Component, 2021

Figure 88: USA Market Share, By Vertical, 2021

Figure 89: Canada Market Value (US$ Million) and Forecast, 2022 to 2032

Figure 90: Canada Market Share, By Organization Size, 2021

Figure 91: Canada Market Share, By Component, 2021

Figure 92: Canada Market Share, By Vertical, 2021

Figure 93: Brazil Market Value (US$ Million) and Forecast, 2022 to 2032

Figure 94: Brazil Market Share, By Organization Size, 2021

Figure 95: Brazil Market Share, By Component, 2021

Figure 96: Brazil Market Share, By Vertical, 2021

Figure 97: Mexico Market Value (US$ Million) and Forecast, 2022 to 2032

Figure 98: Mexico Market Share, By Organization Size, 2021

Figure 99: Mexico Market Share, By Component, 2021

Figure 100: Mexico Market Share, By Vertical, 2021

Figure 101: Germany Market Value (US$ Million) and Forecast, 2022 to 2032

Figure 102: Germany Market Share, By Organization Size, 2021

Figure 103: Germany Market Share, By Component, 2021

Figure 104: Germany Market Share, By Vertical, 2021

Figure 105: UK Market Value (US$ Million) and Forecast, 2022 to 2032

Figure 106: UK Market Share, By Organization Size, 2021

Figure 107: UK Market Share, By Component, 2021

Figure 108: UK Market Share, By Vertical, 2021

Figure 109: France Market Value (US$ Million) and Forecast, 2022 to 2032

Figure 110: France Market Share, By Organization Size, 2021

Figure 111: France Market Share, By Component, 2021

Figure 112: France Market Share, By Vertical, 2021

Figure 113: Italy Market Value (US$ Million) and Forecast, 2022 to 2032

Figure 114: Italy Market Share, By Organization Size, 2021

Figure 115: Italy Market Share, By Component, 2021

Figure 116: Italy Market Share, By Vertical, 2021

Figure 117: BENELUX Market Value (US$ Million) and Forecast, 2022 to 2032

Figure 118: BENELUX Market Share, By Organization Size, 2021

Figure 119: BENELUX Market Share, By Component, 2021

Figure 120: BENELUX Market Share, By Vertical, 2021

Figure 121: Nordic Countries Market Value (US$ Million) and Forecast, 2022 to 2032

Figure 122: Nordic Countries Market Share, By Organization Size, 2021

Figure 123: Nordic Countries Market Share, By Component, 2021

Figure 124: Nordic Countries Market Share, By Vertical, 2021

Figure 125: China Market Value (US$ Million) and Forecast, 2022 to 2032

Figure 126: China Market Share, By Organization Size, 2021

Figure 127: China Market Share, By Component, 2021

Figure 128: China Market Share, By Vertical, 2021

Figure 129: Japan Market Value (US$ Million) and Forecast, 2022 to 2032

Figure 130: Japan Market Share, By Organization Size, 2021

Figure 131: Japan Market Share, By Component, 2021

Figure 132: Japan Market Share, By Vertical, 2021

Figure 133: South Korea Market Value (US$ Million) and Forecast, 2022 to 2032

Figure 134: South Korea Market Share, By Organization Size, 2021

Figure 135: South Korea Market Share, By Component, 2021

Figure 136: South Korea Market Share, By Vertical, 2021

Figure 137: GCC Countries Market Value (US$ Million) and Forecast, 2022 to 2032

Figure 138: GCC Countries Market Share, By Organization Size, 2021

Figure 139: GCC Countries Market Share, By Component, 2021

Figure 140: GCC Countries Market Share, By Vertical, 2021

Figure 141: South Africa Market Value (US$ Million) and Forecast, 2022 to 2032

Figure 142: South Africa Market Share, By Organization Size, 2021

Figure 143: South Africa Market Share, By Component, 2021

Figure 144: South Africa Market Share, By Vertical, 2021

Figure 145: Turkey Market Value (US$ Million) and Forecast, 2022 to 2032

Figure 146: Turkey Market Share, By Organization Size, 2021

Figure 147: Turkey Market Share, By Component, 2021

Figure 148: Turkey Market Share, By Vertical, 2021

Frequently Asked Questions

What is the CAGR of the Virtual Private Cloud Market?

The virtual private cloud market is projected to have a CAGR of 12.8% in 2032.

Which is the Leading Region in the Virtual Private Cloud Market?

North America is the leading region, with an anticipated CAGR of 12.5% by 2032.

Which Segment Leads in the Virtual Private Cloud Market by Vertical Type?

Banking, financial services and insurance segment in the virtual private cloud market is projected to lead the market with a CAGR of 11.5% by 2032.

What is the Growth Estimated for the Virtual Private Cloud Market by 2032?

The virtual private cloud market is predicted to grow USD 129.6 Billion by 2032.

Which Segment Leads in the Virtual Private Cloud Market by Component?

Software segment leads the market with the projected CAGR of 11.8% by 2032.

Explore Similar Insights

Future Market Insights

Virtual Private Cloud Market