Third-Party Risk Management Market
Third-Party risk management Market by Component, Deployment Mode & Region - Forecast 2022 – 2032
Market Insights on Third-Party Risk Management covering sales outlook, demand forecast & up-to-date key trends
Third-Party Risk Management Market Outlook (2022-2032)
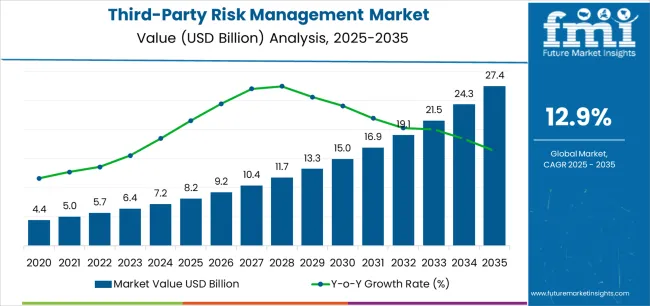
[306 Pages Report] The third-party risk management market is likely to expand its roots in the global market at a strong CAGR of 14.7% between 2022 and 2032.
The market is valued at US$ 5.0 Bn in 2022 and is likely to reach US$ 19.7 Bn by 2032. Previously, the market was thriving at a slightly higher CAGR of 16.5% (2015-2021), ensuing the market size of US$ 4.3 Billion in 2021.
“Preventing third party risks triggered through rising stringent compliance mandates and decreasing in-house competencies are fueling the growth of the market while pushing the corporate spaces to adopt third-party risk management solutions.”
Companies adopting new generation technology along with the rapidly changing market competition are shaping the trends for the third-party risk management market. Rising cyber-attacks and data theft, along with advanced data warfare, are forcing companies to add layers to their security by adopting advanced technologies like third-party risk management solutions.
The major driving factor is less hassle when it comes to managing the risk management for the company. Third-party vendors handle all the security management so that companies can work on their core competencies.
Attributes |
Details |
Third-Party Risk Management Market CAGR (2022-2032) |
14.7% |
Third-Party Risk Management Market Value (2022) |
US$ 5.0 Bn |
Third-Party Risk Management Market Value (2032) |
US$ 19.7 Bn |
Let us know your requirement to get
100% FREE customization
What is the COVID-19 Impact on the Third-Party Risk Management Market?
Third-Party risk management analysis explains that Covid-19 has impacted multiple global markets by disturbing the supply chains because of the market restrictions and logistics bans introduced by the governments around the world. However, there were a handful of markets that benefitted from the pandemic’s impact. Higher risk possibility coupled with new mobile working methods like BYOD and remote work has increased the traction for third-party risk management solutions.
The companies have introduced the work from home procedures because of the incorporate shutdown. This led the brands to overlook their security and compliance prospects, testing the resilience of new technologies in the market. Companies have adopted third-party risk management solutions as it helps in adding layers to the security level of the business and increase the in-house competencies to reach their optimum level.
What are the Key Dynamics Governing the Growth of the Third-Party Risk Management Market?
“High demand for enhanced economic management, regulatory compliance with strict policies along with consumption in healthcare and life science due to higher number of data breaches are helping the market thrive.”
Global study on the third-party risk management market is driven by rising cyber-attacks, data theft, and policy-driven compliance, along with cyber monitoring and better security management is leading the sales of third-party risk management software globally. As the competition increases with time, companies face more and more cyber-attacks every day.
Governments and their restriction policies prevent advanced cyber—attacks and help companies focus on their core competencies. The small and medium enterprises, along with large companies, work towards adding layers to the safety of the company’s data management.
The new advanced technologies integrating with third-party risk management like artificial intelligence, machine learning, and the internet of things (IoT) help the third-party risk management software in predicting the possible risks.
This prevents businesses from facing any compliance and data theft risk. It also analyses the risk type and eliminates or fixes it before it starts affecting the business at large. The competitive advantage, faster market time, decreased costs, and improved probabilities are pushing the demand for third-party risk management. These integration platforms work with risk management software and become a one-stop-shop for most businesses, enhancing the end-user experience while increasing productivity.
Compliance management of multiple businesses involves operational risks, financial risks, transaction risks, information security and strategic risks. It identifies, assesses and controls these risks and their implications on the company’s systems.
This involves vendor identification and information security along with awareness and dependence on this risk management software. It affects the company’s strategic decisions, geographic expansion and technical innovations while creating more secure and effective software that makes sure that the systems are safe. Multiple SMEs and large enterprises are adopting this software support so that the company can focus more on their core competencies.
The high capital investments and incompetent workforce has decreased the sales of third-party risk management. The new workforce joining the companies needs more and more training programs to understand the basics of risk management programs.
Covid-19 has impacted the capital fluidity of multiple businesses, limiting their annual valuation. This ended up in brands not throwing money on third-party risk management software.
Find your sweet spots for generating winning opportunities in this market.
Talk to AnalystComparative View of Adjacent Third-Party Risk Management Market
Third-Party Risk Management Market:
Attributes |
Third-Party Risk Management Market |
CAGR (2022-2032) |
14.5% |
Market Value (2026) |
US$ 8.65 Bn |
Growth Factor |
Rapid digitization and demand for better security outfits that prevents the businesses from risks are increasing the sales of third-party risk management software. |
Opportunity |
The market creates new opportunities for the vendors to analyse and research about the latest technologies and advanced security risks. |
Key Trends |
Platforms like artificial intelligence, machine learning and Internet of things (IOT) integrating with the Third-party risks management software is the latest trend in the market. |
Network Security and Cyber Risk Management Market:
Attributes |
Network Security and Cyber Risk Management Market |
CAGR (2022-2032) |
10.8% |
Market Value (2026) |
US$ 151.42 Bn |
Growth Factor |
Increasing government initiatives and rapid digitization in the corporate spaces are fuelling the sales of network security and cyber risk management solutions. |
Opportunity |
Network security and cyber risk management solutions create opportunities for critical infrastructure to expand their space in the core business spaces |
Key Trends |
Adoption of cloud computing, AI based tools and machine learning solutions used along with the network security and cyber risk management services create easy possibilities for the |
Global Cybersecurity Market:
Attributes |
Global Cybersecurity Market |
CAGR (2022-2032) |
13.1% |
Market Value (2026) |
US$ 305 Bn |
Growth Factor |
Rising advanced data breaches amongst SMEs and large enterprises have pushed the market and has increased the sales of cybersecurity solutions, increasing the productivity of the businesses. |
Opportunity |
Business intelligence AI based software are creating opportunities for cyber security market as they create demand for it with the growing cyber-attacks in the system. |
Key Trends |
Anti-Ransomware prospects with better delivery and industry specific platforms help the market gain traction and mark as a new trend in the market. |
The third-party risk management market involves multiple components involving the latest technological advances. Companies prefer third-party risk management software as it helps them rely on a one-stop shop that helps them in analyzing and eliminating the risks that are declining the supply chain or that can be used like that in the future. Components involve analyzing, scanning and fixing the damaged files. The increased traffic in the systems increases the risks for the systems. Though, new advancements in third-party risk management software are able to eliminate most of these risks.
What is the Segmentation Outlook for the Third-Party Risk Management Market?
The third-Party risk management market is categorized by component, deployment mode, organization size and vertical. These categories are further divided into small segments that expand their channels in multiple market spaces.
These segments perform differently in multiple markets as they have a stronghold in multiple regions. The component category is segmented into solution and services, where the solution segment is sub-segmented into financial control management, contract management, operational risk management, audit management and compliance management and services are divided into professional services and managed services.
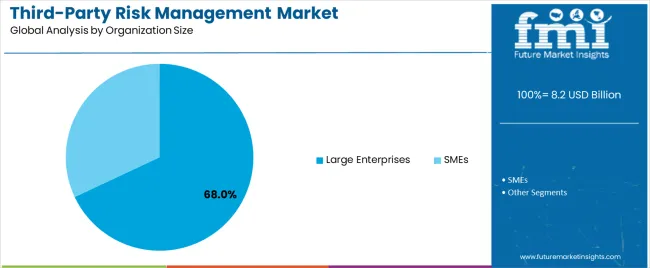
The deployment mode is divided into the cloud and on-premises, while organization size can be dissected into SMEs and Large Enterprises. The last vertical category is divided into BFSI, IT and Telecom, Healthcare and Life sciences, Retail and Consumer Goods, Manufacturing, Energy and Utilities.

An unified Market Research Subscription Platform, built for today’s disparate research needs.
Which Segment is likely to Lead the Third-Party Risk Management Market by Component?
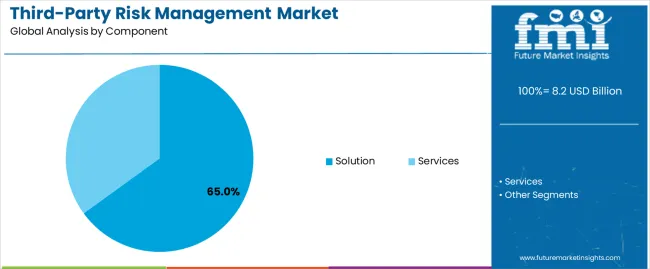
By component, the Solution segment is the largest segment and will hold the biggest portion of the market in the forecast period. The analysis shows that the solution type is set to thrive at 13.1% in the forecast period. Previously, the same segment was proliferating at a CAGR of 14.8%. The factors behind the growth of this segment are the easy implementation, aggressive price ranges and effective security policy coupled with new integrated technologies.
Which Segment is likely to Lead the Third-Party Risk Management Market by Deployment Type?
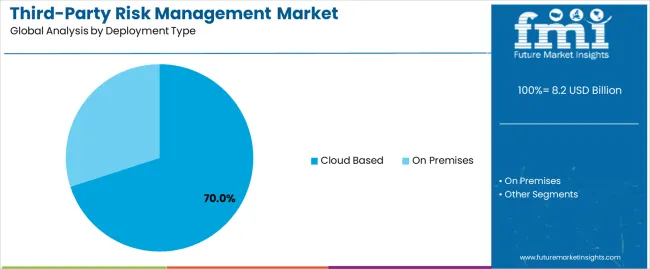
By deployment, Cloud is the biggest segment in the application category and will be the largest portion in the forecast period. It is growing at a CAGR of 12.4% between 2022 and 2032, which was previously recorded as 14.2% between 2015 and 2021. The factors behind the growth of large enterprises are the high-speed security transfer multi-layered software that enhances productivity and analyses the possible risks.
What is the Regional Analysis for the Third-Party Risk Management Market?
The third-Party risk management market is divided into regions; North America, Latin America, Asia Pacific, Middle East and Africa (MEA) and Europe. The biggest market is the United States, which is thriving at a CAGR of 14.3% between 2022-2032.
The region is likely to hold a market revenue of US$ 6.6 Bn by the end of 2032. Rapid digitization, increasing integration of the latest technology, and rising cyber-attacks with advanced data breaches are fueling the growth in this region.
Other regions like Asia pacific are the highest growing region for third-Party risk management market as developing countries like China are booming at a CAGR of 14.3%, and Japan is growing at a CAGR of 13.1% while their projected values are 1.3 Bn and 1.0 Bn respectively. UK will hold US$ 820.4 Mn by the end of 2032 as it thrives on a promising CAGR of 13.3% between 2022-2032.
Regions |
CAGR (2022-2032) |
United States |
14.3% |
United Kingdom |
13.3% |
China |
14.3% |
South Korea |
10.4% |
Japan |
13.1% |
- United States hold the biggest portion in the third-party risk management market.
- China is the highest growing market in the Asia-Pacific region, making the region the highest growing region.
- Covid-19 followed by remote work along with rising security concerns and BYOD are owing to the increased sales of third-Party risk management software.
How is the Competition in the Third-Party risk management Market?
The competitive landscape of third-party risk management is dynamic in nature and allows new competitors to thrive in the market and increase competitiveness. The companies in the market are a part of mergers and collaborations that result in increased distribution channels and market spaces. These companies focus on upgrading the software, making it accessible to use and increasing the security layers.
Recent Developments in the Third-Party Risk Management Market
- RSA Archer has introduced its risk assessment software (Third Party) that is going to strengthen the business security layers while using AI based tools to analyze the risk level. increases the demand for risk management software including third-party risk management software.
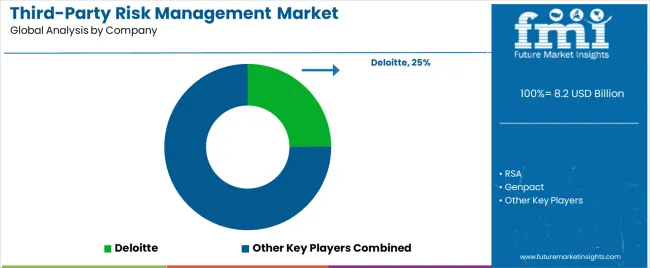
- Deloitte upgraded its third-Party risk management platform that includes screening and background checks, remote and on-site inspections and monitoring, fueling the demand for third-Party risk management software.
Key Players
- RSA
- Genpact
- MetricStream
- Deloitte
- KPMG
Key Segments
By Component:
- Solution
- Financial Control Management
- Contract Management
- Operational Risk Management
- Audit Management
- Compliance Management
Services:
- Professional Services
- Managed Services
By Vertical:
- BFSI
- IT and Telecom
- Healthcare and Life Sciences
- Government and Defense
- Retail and Consumer Goods
- Manufacturing
- Energy and Utilities
By Deployment Type:
- Cloud Based
- On-Premises
By Organization Size:
- Large Enterprises
- SMEs
By Region:
- North America
- Europe
- Asia Pacific
- Latin America
- Middle East and Africa
Frequently Asked Questions
The third-party risk management market is set to grow at a CAGR of 14.7% through 2032.
United States is the biggest region in third-party risk management market with a CAGR of 14.3% through 2032.
Cloud based deployment type is the leading segment in the third-Party risk management market by type, thriving at a CAGR of 12.4% through 2032.
The third-party risk management market is set to reach US$ 19.7 Bn by 2032.
Asia pacific has the highest growth potential in the third-party risk management market, where China and Japan thrive at CAGRs of 14.3% and 13.1% through 2032.
1. Executive Summary
1.1. Global Market Outlook
1.2. Summary of Statistics
1.3. Key Market Characteristics & Attributes
1.4. Analysis and Recommendations
2. Market Overview
2.1. Market Coverage
2.2. Market Definition
3. Market Risks and Trends Assessment
3.1. Risk Assessment
3.1.1. COVID-19 Crisis and Impact on Third-Party Risk Management
3.1.2. COVID-19 Impact Benchmark with Previous Crisis
3.1.3. Impact on Market Value (US$ Mn)
3.1.4. Assessment by Key Countries
3.1.5. Assessment by Key Market Segments
3.1.6. Action Points and Recommendation for Suppliers
3.2. Key Trends Impacting the Market
3.3. Formulation and Product Development Trends
4. Market Background
4.1. Third-Party Risk Management Market, by Key Countries
4.2. Third-Party Risk Management Market Opportunity Assessment (US$ Mn)
4.2.1. Total Available Market
4.2.2. Serviceable Addressable Market
4.2.3. Serviceable Obtainable Market
4.3. Market Scenario Forecast
4.3.1. Demand in optimistic Scenario
4.3.2. Demand in Likely Scenario
4.3.3. Demand in Conservative Scenario
4.4. Investment Feasibility Analysis
4.4.1. Investment in Established Markets
4.4.1.1. In Short Term
4.4.1.2. In Long Term
4.4.2. Investment in Emerging Markets
4.4.2.1. In Short Term
4.4.2.2. In Long Term
4.5. Forecast Factors - Relevance & Impact
4.5.1. Top Companies Historical Growth
4.5.2. Growth in Automation, By Country
4.5.3. Third-Party Risk Management Adoption Rate, By Country
4.6. Market Dynamics
4.6.1. Market Driving Factors and Impact Assessment
4.6.2. Prominent Market Challenges and Impact Assessment
4.6.3. Third-Party Risk Management Market Opportunities
4.6.4. Prominent Trends in the Global Market & Their Impact Assessment
5. Key Success Factors
5.1. Manufacturers’ Focus on Low Penetration High Growth Markets
5.2. Banking on with Segments High Incremental Opportunity
5.3. Peer Benchmarking
6. Global Third-Party Risk Management Market Demand Analysis 2015-2021 and Forecast, 2022-2032
6.1. Historical Market Analysis, 2015-2021
6.2. Current and Future Market Projections, 2022-2032
6.3. Y-o-Y Growth Trend Analysis
7. Global Third-Party Risk Management Market Value Analysis 2015-2021 and Forecast, 2022-2032
7.1. Historical Market Value (US$ Mn) Analysis, 2015-2021
7.2. Current and Future Market Value (US$ Mn) Projections, 2022-2032
7.2.1. Y-o-Y Growth Trend Analysis
7.2.2. Absolute $ Opportunity Analysis
8. Global Third-Party Risk Management Market Analysis 2015-2021 and Forecast 2022-2032, By Component
8.1. Introduction / Key Findings
8.2. Historical Market Size (US$ Mn) Analysis By Component , 2015-2021
8.3. Current and Future Market Size (US$ Mn) Analysis and Forecast By Component , 2022-2032
8.3.1. Solution
8.3.1.1. Financial Control Management
8.3.1.2. Contract Management
8.3.1.3. Operational Risk Management
8.3.1.4. Audit Management
8.3.1.5. Compliance Management
8.3.1.6. Others
8.3.2. Services
8.3.2.1. Professional Services
8.3.2.2. Managed Services
8.4. Market Attractiveness Analysis By Component
9. Global Third-Party Risk Management Market Analysis 2015-2021 and Forecast 2022-2032, By Vertical
9.1. Introduction / Key Findings
9.2. Historical Market Size (US$ Mn) Analysis By Vertical, 2015-2021
9.3. Current and Future Market Size (US$ Mn) Analysis and Forecast By Vertical, 2022-2032
9.3.1. BFSI
9.3.2. IT and Telecom
9.3.3. Healthcare and Life Sciences
9.3.4. Government, Defense, and Aerospace
9.3.5. Retail and Consumer Goods
9.3.6. Manufacturing
9.3.7. Energy and Utilities
9.3.8. Others
9.4. Market Attractiveness Analysis By Vertical
10. Global Third-Party Risk Management Market Analysis 2015-2021 and Forecast 2022-2032, By Deployment Mode
10.1. Introduction / Key Findings
10.2. Historical Market Size (US$ Mn) Analysis By Deployment Mode, 2015-2021
10.3. Current and Future Market Size (US$ Mn) Analysis and Forecast By Deployment Mode, 2022-2032
10.3.1. Cloud
10.3.2. On-Premises
10.4. Market Attractiveness Analysis By Deployment Mode
11. Global Third-Party Risk Management Market Analysis 2015-2021 and Forecast 2022-2032, By Organization Size
11.1. Introduction / Key Findings
11.2. Historical Market Size (US$ Mn) Analysis By Organization Size , 2015-2021
11.3. Current and Future Market Size (US$ Mn) Analysis and Forecast By Organization Size , 2022-2032
11.3.1. Small and Medium-sized Enterprises (SMEs)
11.3.2. Large Enterprises
11.4. Market Attractiveness Analysis By Organization Size
12. Global Third-Party Risk Management Market Analysis 2015-2021 and Forecast 2022-2032, By Region
12.1. Introduction
12.2. Historical Market Size (US$ Mn) Analysis By Region, 2015-2021
12.3. Current Market Size (US$ Mn) & Analysis and Forecast By Region, 2022-2032
12.3.1. North America
12.3.2. Latin America
12.3.3. Europe
12.3.4. Asia Pacific
12.3.5. Middle East and Africa (MEA)
12.4. Market Attractiveness Analysis By Region
13. North America Third-Party Risk Management Market Analysis 2015-2021 and Forecast 2022-2032
13.1. Introduction
13.2. Pricing Analysis
13.3. Historical Market Value (US$ Mn) Trend Analysis By Market Taxonomy, 2015-2021
13.4. Market Value (US$ Mn) & Forecast By Market Taxonomy, 2022-2032
13.4.1. By Country
13.4.1.1. U.S.
13.4.1.2. Canada
13.4.1.3. Rest of North America
13.4.2. By Component
13.4.3. By Vertical
13.4.4. By Organization Size
13.4.5. By Deployment Mode
13.5. Market Attractiveness Analysis
13.5.1. By Country
13.5.2. By Component
13.5.3. By Vertical
13.5.4. By Organization Size
13.5.5. By Deployment Mode
14. Latin America Third-Party Risk Management Market Analysis 2015-2021 and Forecast 2022-2032
14.1. Introduction
14.2. Pricing Analysis
14.3. Historical Market Value (US$ Mn) Trend Analysis By Market Taxonomy, 2015-2021
14.4. Market Value (US$ Mn) & Forecast By Market Taxonomy, 2022-2032
14.4.1. By Country
14.4.1.1. Brazil
14.4.1.2. Mexico
14.4.1.3. Rest of Latin America
14.4.2. By Component
14.4.3. By Vertical
14.4.4. By Organization Size
14.4.5. By Deployment Mode
14.5. Market Attractiveness Analysis
14.5.1. By Country
14.5.2. By Component
14.5.3. By Vertical
14.5.4. By Organization Size
14.5.5. By Deployment Mode
15. Europe Third-Party Risk Management Market Analysis 2015-2021 and Forecast 2022-2032
15.1. Introduction
15.2. Pricing Analysis
15.3. Historical Market Value (US$ Mn) Trend Analysis By Market Taxonomy, 2015-2021
15.4. Market Value (US$ Mn) & Forecast By Market Taxonomy, 2022-2032
15.4.1. By Country
15.4.1.1. Germany
15.4.1.2. France
15.4.1.3. U.K.
15.4.1.4. Italy
15.4.1.5. Benelux
15.4.1.6. Nordic Countries
15.4.1.7. Rest of Europe
15.4.2. By Component
15.4.3. By Vertical
15.4.4. By Organization Size
15.4.5. By Deployment Mode
15.5. Market Attractiveness Analysis
15.5.1. By Country
15.5.2. By Component
15.5.3. By Vertical
15.5.4. By Organization Size
15.5.5. By Deployment Mode
16. Asia Pacific Third-Party Risk Management Market Analysis 2015-2021 and Forecast 2022-2032
16.1. Introduction
16.2. Pricing Analysis
16.3. Historical Market Value (US$ Mn) Trend Analysis By Market Taxonomy, 2015-2021
16.4. Market Value (US$ Mn) & Forecast By Market Taxonomy, 2022-2032
16.4.1. By Country
16.4.1.1. China
16.4.1.2. Japan
16.4.1.3. South Korea
16.4.1.4. Rest of Asia Pacific
16.4.2. By Component
16.4.3. By Vertical
16.4.4. By Organization Size
16.4.5. By Deployment Mode
16.5. Market Attractiveness Analysis
16.5.1. By Country
16.5.2. By Component
16.5.3. By Vertical
16.5.4. By Organization Size
16.5.5. By Deployment Mode
17. Middle East and Africa Third-Party Risk Management Market Analysis 2015-2021 and Forecast 2022-2032
17.1. Introduction
17.2. Pricing Analysis
17.3. Historical Market Value (US$ Mn) Trend Analysis By Market Taxonomy, 2015-2021
17.4. Market Value (US$ Mn) & Forecast By Market Taxonomy, 2022-2032
17.4.1. By Country
17.4.1.1. GCC Countries
17.4.1.2. South Africa
17.4.1.3. Turkey
17.4.1.4. Rest of Middle East and Africa
17.4.2. By Component
17.4.3. By Vertical
17.4.4. By Organization Size
17.4.5. By Deployment Mode
17.5. Market Attractiveness Analysis
17.5.1. By Country
17.5.2. By Component
17.5.3. By Vertical
17.5.4. By Organization Size
17.5.5. By Deployment Mode
18. Key Countries Third-Party Risk Management Market Analysis 2015-2021 and Forecast 2022-2032
18.1. Introduction
18.1.1. Market Value Proportion Analysis, By Key Countries
18.1.2. Global Vs. Country Growth Comparison
18.2. US Third-Party Risk Management Market Analysis
18.2.1. Value Proportion Analysis by Market Taxonomy
18.2.2. Value Analysis and Forecast by Market Taxonomy, 2015-2032
18.2.2.1. By Component
18.2.2.2. By Vertical
18.2.2.3. By Organization Size
18.2.2.4. By Deployment Mode
18.3. Canada Third-Party Risk Management Market Analysis
18.3.1. Value Proportion Analysis by Market Taxonomy
18.3.2. Value Analysis and Forecast by Market Taxonomy, 2015-2032
18.3.2.1. By Component
18.3.2.2. By Vertical
18.3.2.3. By Organization Size
18.3.2.4. By Deployment Mode
18.4. Mexico Third-Party Risk Management Market Analysis
18.4.1. Value Proportion Analysis by Market Taxonomy
18.4.2. Value Analysis and Forecast by Market Taxonomy, 2015-2032
18.4.2.1. By Component
18.4.2.2. By Vertical
18.4.2.3. By Organization Size
18.4.2.4. By Deployment Mode
18.5. Brazil Third-Party Risk Management Market Analysis
18.5.1. Value Proportion Analysis by Market Taxonomy
18.5.2. Value Analysis and Forecast by Market Taxonomy, 2015-2032
18.5.2.1. By Component
18.5.2.2. By Vertical
18.5.2.3. By Organization Size
18.5.2.4. By Deployment Mode
18.6. Germany Third-Party Risk Management Market Analysis
18.6.1. Value Proportion Analysis by Market Taxonomy
18.6.2. Value Analysis and Forecast by Market Taxonomy, 2015-2032
18.6.2.1. By Component
18.6.2.2. By Vertical
18.6.2.3. By Organization Size
18.6.2.4. By Deployment Mode
18.7. France Third-Party Risk Management Market Analysis
18.7.1. Value Proportion Analysis by Market Taxonomy
18.7.2. Value Analysis and Forecast by Market Taxonomy, 2015-2032
18.7.2.1. By Component
18.7.2.2. By Vertical
18.7.2.3. By Organization Size
18.7.2.4. By Deployment Mode
18.8. Italy Third-Party Risk Management Market Analysis
18.8.1. Value Proportion Analysis by Market Taxonomy
18.8.2. Value Analysis and Forecast by Market Taxonomy, 2015-2032
18.8.2.1. By Component
18.8.2.2. By Vertical
18.8.2.3. By Organization Size
18.8.2.4. By Deployment Mode
18.9. BENELUX Third-Party Risk Management Market Analysis
18.9.1. Value Proportion Analysis by Market Taxonomy
18.9.2. Value Analysis and Forecast by Market Taxonomy, 2015-2032
18.9.2.1. By Component
18.9.2.2. By Vertical
18.9.2.3. By Organization Size
18.9.2.4. By Deployment Mode
18.10. UK Third-Party Risk Management Market Analysis
18.10.1. Value Proportion Analysis by Market Taxonomy
18.10.2. Value Analysis and Forecast by Market Taxonomy, 2015-2032
18.10.2.1. By Component
18.10.2.2. By Vertical
18.10.2.3. By Organization Size
18.10.2.4. By Deployment Mode
18.11. Nordic Countries Third-Party Risk Management Market Analysis
18.11.1. Value Proportion Analysis by Market Taxonomy
18.11.2. Value Analysis and Forecast by Market Taxonomy, 2015-2032
18.11.2.1. By Component
18.11.2.2. By Vertical
18.11.2.3. By Organization Size
18.11.2.4. By Deployment Mode
18.12. China Third-Party Risk Management Market Analysis
18.12.1. Value Proportion Analysis by Market Taxonomy
18.12.2. Value Analysis and Forecast by Market Taxonomy, 2015-2032
18.12.2.1. By Component
18.12.2.2. By Vertical
18.12.2.3. By Organization Size
18.12.2.4. By Deployment Mode
18.13. Japan Third-Party Risk Management Market Analysis
18.13.1. Value Proportion Analysis by Market Taxonomy
18.13.2. Value Analysis and Forecast by Market Taxonomy, 2015-2032
18.13.2.1. By Component
18.13.2.2. By Vertical
18.13.2.3. By Organization Size
18.13.2.4. By Deployment Mode
18.14. South Korea Third-Party Risk Management Market Analysis
18.14.1. Value Proportion Analysis by Market Taxonomy
18.14.2. Value Analysis and Forecast by Market Taxonomy, 2015-2032
18.14.2.1. By Component
18.14.2.2. By Vertical
18.14.2.3. By Organization Size
18.14.2.4. By Deployment Mode
18.15. GCC Countries Third-Party Risk Management Market Analysis
18.15.1. Value Proportion Analysis by Market Taxonomy
18.15.2. Value Analysis and Forecast by Market Taxonomy, 2015-2032
18.15.2.1. By Component
18.15.2.2. By Vertical
18.15.2.3. By Organization Size
18.15.2.4. By Deployment Mode
18.16. South Africa Third-Party Risk Management Market Analysis
18.16.1. Value Proportion Analysis by Market Taxonomy
18.16.2. Value Analysis and Forecast by Market Taxonomy, 2015-2032
18.16.2.1. By Component
18.16.2.2. By Vertical
18.16.2.3. By Organization Size
18.16.2.4. By Deployment Mode
18.17. Turkey Third-Party Risk Management Market Analysis
18.17.1. Value Proportion Analysis by Market Taxonomy
18.17.2. Value Analysis and Forecast by Market Taxonomy, 2015-2032
18.17.2.1. By Component
18.17.2.2. By Vertical
18.17.2.3. By Organization Size
18.17.2.4. By Deployment Mode
18.17.3. Competition Landscape and Player Concentration in the Country
19. Market Structure Analysis
19.1. Market Analysis by Tier of Companies
19.2. Market Concentration
19.3. Market Share Analysis of Top Players
19.4. Market Presence Analysis
19.4.1. By Regional footprint of Players
19.4.2. Product footprint by Players
20. Competition Analysis
20.1. Competition Dashboard
20.2. Competition Benchmarking
20.3. Competition Deep Dive
20.3.1. RSA
20.3.1.1. Overview
20.3.1.2. Product Portfolio
20.3.1.3. Sales Footprint
20.3.1.4. Strategy Overview
20.3.2. Genpact
20.3.2.1. Overview
20.3.2.2. Product Portfolio
20.3.2.3. Sales Footprint
20.3.2.4. Strategy Overview
20.3.3. MetricStream
20.3.3.1. Overview
20.3.3.2. Product Portfolio
20.3.3.3. Sales Footprint
20.3.3.4. Strategy Overview
20.3.4. Deloitte
20.3.4.1. Overview
20.3.4.2. Product Portfolio
20.3.4.3. Sales Footprint
20.3.4.4. Strategy Overview
20.3.5. KPMG
20.3.5.1. Overview
20.3.5.2. Product Portfolio
20.3.5.3. Sales Footprint
20.3.5.4. Strategy Overview
20.3.6. Venminder
20.3.6.1. Overview
20.3.6.2. Product Portfolio
20.3.6.3. Sales Footprint
20.3.6.4. Strategy Overview
20.3.7. Riskpro
20.3.7.1. Overview
20.3.7.2. Product Portfolio
20.3.7.3. Sales Footprint
20.3.7.4. Strategy Overview
20.3.8. RapidRatings
20.3.8.1. Overview
20.3.8.2. Product Portfolio
20.3.8.3. Sales Footprint
20.3.8.4. Strategy Overview
20.3.9. Aravo
20.3.9.1. Overview
20.3.9.2. Product Portfolio
20.3.9.3. Sales Footprint
20.3.9.4. Strategy Overview
20.3.10. Galvanize
20.3.10.1. Overview
20.3.10.2. Product Portfolio
20.3.10.3. Sales Footprint
20.3.10.4. Strategy Overview
21. Assumptions and Acronyms Used
22. Research Methodology
Let us know your requirement to get
100% FREE customization
Table 1: Global Third-Party Risk Management Market Value (US$ Mn), By Component , 2015 – 2021
Table 2: Global Third-Party Risk Management Market Value (US$ Mn), By Component , 2022 – 2032
Table 3: Global Third-Party Risk Management Market Value (US$ Mn), By Vertical, 2015 – 2021
Table 4: Global Third-Party Risk Management Market Value (US$ Mn), By Vertical, 2022 – 2032
Table 5: Global Third-Party Risk Management Market Value (US$ Mn), By Deployment Mode, 2015 – 2021
Table 6: Global Third-Party Risk Management Market Value (US$ Mn), By Deployment Mode, 2022 – 2032
Table 7: Global Third-Party Risk Management Market Value (US$ Mn), By Organization Size , 2015 – 2021
Table 8: Global Third-Party Risk Management Market Value (US$ Mn), By Organization Size , 2022 – 2032
Table 9: Global Third-Party Risk Management Market, By Region, 2015 – 2021
Table 10: Global Third-Party Risk Management Market, By Region, 2022 – 2032
Table 11: North America Third-Party Risk Management Market Value (US$ Mn), By Component , 2015 – 2021
Table 12: North America Third-Party Risk Management Market Value (US$ Mn), By Component , 2022 – 2032
Table 13: North America Third-Party Risk Management Market Value (US$ Mn), By Vertical, 2015 – 2021
Table 14: North America Third-Party Risk Management Market Value (US$ Mn), By Vertical, 2022 – 2032
Table 15: North America Third-Party Risk Management Market Value (US$ Mn), By Deployment Mode, 2015 – 2021
Table 16: North America Third-Party Risk Management Market Value (US$ Mn), By Deployment Mode, 2022 – 2032
Table 17: North America Third-Party Risk Management Market Value (US$ Mn), By Organization Size , 2015 – 2021
Table 18: North America Third-Party Risk Management Market Value (US$ Mn), By Organization Size , 2022 – 2032
Table 19: North America Third-Party Risk Management Market, By Country, 2015 – 2021
Table 20: North America Third-Party Risk Management Market, By Country, 2022 – 2032
Table 21: Latin America Third-Party Risk Management Market Value (US$ Mn), By Component , 2015 – 2021
Table 22: Latin America Third-Party Risk Management Market Value (US$ Mn), By Component , 2022 – 2032
Table 23: Latin America Third-Party Risk Management Market Value (US$ Mn), By Vertical, 2015 – 2021
Table 24: Latin America Third-Party Risk Management Market Value (US$ Mn), By Vertical, 2022 – 2032
Table 25: Latin America Third-Party Risk Management Market Value (US$ Mn), By Deployment Mode, 2015 – 2021
Table 26: Latin America Third-Party Risk Management Market Value (US$ Mn), By Deployment Mode, 2022 – 2032
Table 27: Latin America Third-Party Risk Management Market Value (US$ Mn), By Organization Size , 2015 – 2021
Table 28: Latin America Third-Party Risk Management Market Value (US$ Mn), By Organization Size , 2022 – 2032
Table 29: Latin America Third-Party Risk Management Market, By Country, 2015 – 2021
Table 30: Latin America Third-Party Risk Management Market, By Country, 2022 – 2032
Table 31: Europe Third-Party Risk Management Market Value (US$ Mn), By Component , 2015 – 2021
Table 32: Europe Third-Party Risk Management Market Value (US$ Mn), By Component , 2022 – 2032
Table 33: Europe Third-Party Risk Management Market Value (US$ Mn), By Vertical, 2015 – 2021
Table 34: Europe Third-Party Risk Management Market Value (US$ Mn), By Vertical, 2022 – 2032
Table 35: Europe Third-Party Risk Management Market Value (US$ Mn), By Deployment Mode, 2015 – 2021
Table 36: Europe Third-Party Risk Management Market Value (US$ Mn), By Deployment Mode, 2022 – 2032
Table 37: Europe Third-Party Risk Management Market Value (US$ Mn), By Organization Size , 2015 – 2021
Table 38: Europe Third-Party Risk Management Market Value (US$ Mn), By Organization Size , 2022 – 2032
Table 39: Europe Third-Party Risk Management Market, By Country, 2015 – 2021
Table 40: Europe Third-Party Risk Management Market, By Country, 2022 – 2032
Table 41: Asia Pacific Third-Party Risk Management Market Value (US$ Mn), By Component , 2015 – 2021
Table 42: Asia Pacific Third-Party Risk Management Market Value (US$ Mn), By Component , 2022 – 2032
Table 43: Asia Pacific Third-Party Risk Management Market Value (US$ Mn), By Vertical, 2015 – 2021
Table 44: Asia Pacific Third-Party Risk Management Market Value (US$ Mn), By Vertical, 2022 – 2032
Table 45: Asia Pacific Third-Party Risk Management Market Value (US$ Mn), By Deployment Mode, 2015 – 2021
Table 46: Asia Pacific Third-Party Risk Management Market Value (US$ Mn), By Deployment Mode, 2022 – 2032
Table 47: Asia Pacific Third-Party Risk Management Market Value (US$ Mn), By Organization Size , 2015 – 2021
Table 48: Asia Pacific Third-Party Risk Management Market Value (US$ Mn), By Organization Size , 2022 – 2032
Table 49: Asia Pacific Third-Party Risk Management Market, By Country, 2015 – 2021
Table 50: Asia Pacific Third-Party Risk Management Market, By Country, 2022 – 2032
Table 51: MEA Third-Party Risk Management Market Value (US$ Mn), By Component , 2015 – 2021
Table 52: MEA Third-Party Risk Management Market Value (US$ Mn), By Component , 2022 – 2032
Table 53: MEA Third-Party Risk Management Market Value (US$ Mn), By Vertical, 2015 – 2021
Table 54: MEA Third-Party Risk Management Market Value (US$ Mn), By Vertical, 2022 – 2032
Table 55: MEA Third-Party Risk Management Market Value (US$ Mn), By Deployment Mode, 2015 – 2021
Table 56: MEA Third-Party Risk Management Market Value (US$ Mn), By Deployment Mode, 2022 – 2032
Table 57: MEA Third-Party Risk Management Market Value (US$ Mn), By Organization Size , 2015 – 2021
Table 58: MEA Third-Party Risk Management Market Value (US$ Mn), By Organization Size , 2022 – 2032
Table 59: MEA Third-Party Risk Management Market, By Country, 2015 – 2021
Table 60: MEA Third-Party Risk Management Market, By Country, 2022 – 2032
Find your sweet spots for generating winning opportunities in this market.
Talk to AnalystFigure 1: Global Third-Party Risk Management Market Value (US$ Mn) and Year-on-Year Growth, 2015-2032
Figure 2: Global Third-Party Risk Management Market Absolute $ Historical Gain (2015 - 2021) and Opportunity (2022 – 2032), US$ Mn
Figure 3: Global Third-Party Risk Management Market Share, By Component , 2022 & 2032
Figure 4: Global Third-Party Risk Management Market Y-o-Y Growth Projections, Component – 2022-2032
Figure 5: Global Third-Party Risk Management Market Attractiveness Index, Component – 2022-2032
Figure 6: Global Third-Party Risk Management Market Share, By Vertical, 2022 & 2032
Figure 7: Global Third-Party Risk Management Market Y-o-Y Growth Projections, By Vertical – 2022-2032
Figure 8: Global Third-Party Risk Management Market Attractiveness Index, By Vertical – 2022-2032
Figure 9: Global Third-Party Risk Management Market Share, By Organization Size , 2022 & 2032
Figure 10: Global Third-Party Risk Management Market Y-o-Y Growth Projections, By Organization Size – 2022-2032
Figure 11: Global Third-Party Risk Management Market Attractiveness Index, By Organization Size – 2022-2032
Figure 12: Global Third-Party Risk Management Market Share, By Deployment Mode, 2022 & 2032
Figure 13: Global Third-Party Risk Management Market Y-o-Y Growth Projections, By Deployment Mode – 2022-2032
Figure 14: Global Third-Party Risk Management Market Attractiveness Index, By Deployment Mode – 2022-2032
Figure 15: Global Third-Party Risk Management Market Share, By Region, 2022 & 2032
Figure 16: Global Third-Party Risk Management Market Y-o-Y Growth Projections, By Region – 2022-2032
Figure 17: Global Third-Party Risk Management Market Attractiveness Index, By Region – 2022-2032
Figure 18: North America Third-Party Risk Management Market Value (US$ Mn) and Year-on-Year Growth, 2015-2032
Figure 19: North America Third-Party Risk Management Market Absolute $ Opportunity Historical (2015 - 2021) and Forecast Period (2022 – 2032), US$ Mn
Figure 20: North America Third-Party Risk Management Market Share, Component, 2022 & 2032
Figure 21: North America Third-Party Risk Management Market Y-o-Y Growth Projections, Component – 2022-2032
Figure 22: North America Third-Party Risk Management Market Attractiveness Index, Component– 2022-2032
Figure 23: North America Third-Party Risk Management Market Share, By Vertical, 2022 & 2032
Figure 24: North America Third-Party Risk Management Market Y-o-Y Growth Projections, By Vertical – 2022-2032
Figure 25: North America Third-Party Risk Management Market Attractiveness Index, By Vertical – 2022-2032
Figure 26: North America Third-Party Risk Management Market Share, By Organization Size , 2022 & 2032
Figure 27: North America Third-Party Risk Management Market Y-o-Y Growth Projections, By Organization Size – 2022-2032
Figure 28: North America Third-Party Risk Management Market Attractiveness Index, By Organization Size – 2022-2032
Figure 29: North America Third-Party Risk Management Market Share, By Deployment Mode, 2022 & 2032
Figure 30: North America Third-Party Risk Management Market Y-o-Y Growth Projections, By Deployment Mode – 2022-2032
Figure 31: North America Third-Party Risk Management Market Attractiveness Index, By Deployment Mode – 2022-2032
Figure 32: North America Third-Party Risk Management Market Share, By Country, 2022 & 2032
Figure 33: North America Market Y-o-Y Growth Projections, By Country – 2022-2032
Figure 34: North America Market Attractiveness Index, By Country – 2022-2032
Figure 35: Latin America Third-Party Risk Management Market Value (US$ Mn) and Year-on-Year Growth, 2015-2032
Figure 36: Latin America Third-Party Risk Management Market Absolute $ Opportunity Historical (2015 - 2021) and Forecast Period (2022 – 2032), US$ Mn
Figure 37: Latin America Third-Party Risk Management Market Share, By Component, 2022 & 2032
Figure 38: Latin America Third-Party Risk Management Market Y-o-Y Growth Projections, By Component – 2022-2032
Figure 39: Latin America Third-Party Risk Management Market Attractiveness Index,By Component – 2022-2032
Figure 40: Latin America Third-Party Risk Management Market Share, By Vertical, 2022 & 2032
Figure 41: Latin America Third-Party Risk Management Market Y-o-Y Growth Projections, By Vertical – 2022-2032
Figure 42: Latin America Third-Party Risk Management Market Attractiveness Index, By Vertical – 2022-2032
Figure 43: Latin America Third-Party Risk Management Market Share, By Organization Size , 2022 & 2032
Figure 44: Latin America Third-Party Risk Management Market Y-o-Y Growth Projections, By Organization Size – 2022-2032
Figure 45: Latin America Third-Party Risk Management Market Attractiveness Index, By Organization Size – 2022-2032
Figure 46: Latin America Third-Party Risk Management Market Share, By Deployment Mode, 2022 & 2032
Figure 47: Latin America Third-Party Risk Management Market Y-o-Y Growth Projections, By Deployment Mode – 2022-2032
Figure 48: Latin America Third-Party Risk Management Market Attractiveness Index, By Deployment Mode – 2022-2032
Figure 49: Latin America Third-Party Risk Management Market Share, By Country, 2022 & 2032
Figure 50: Latin America Third-Party Risk Management Market Y-o-Y Growth Projections, By Country – 2022-2032
Figure 51: Latin America Third-Party Risk Management Market Attractiveness Index, By Country – 2022-2032
Figure 52: Europe Third-Party Risk Management Market Value (US$ Mn) and Year-on-Year Growth, 2015-2032
Figure 53: Europe Third-Party Risk Management Market Absolute $ Opportunity Historical (2015 - 2021) and Forecast Period (2022 – 2032), US$ Mn
Figure 54: Europe Third-Party Risk Management Market Share, By Component, 2022 & 2032
Figure 55: Europe Third-Party Risk Management Market Y-o-Y Growth Projections, By Component – 2022-2032
Figure 56: Europe Third-Party Risk Management Market Attractiveness Index, By Component – 2022-2032
Figure 57: Europe Third-Party Risk Management Market Share, By Vertical, 2022 & 2032
Figure 58: Europe Third-Party Risk Management Market Y-o-Y Growth Projections, By Vertical – 2022-2032
Figure 59: Europe Third-Party Risk Management Market Attractiveness Index, By Vertical – 2022-2032
Figure 60: Europe Third-Party Risk Management Market Share, By Organization Size , 2022 & 2032
Figure 61: Europe Third-Party Risk Management Market Y-o-Y Growth Projections, By Organization Size – 2022-2032
Figure 62: Europe Third-Party Risk Management Market Attractiveness Index, By Organization Size – 2022-2032
Figure 63: Europe Third-Party Risk Management Market Share, By Deployment Mode, 2022 & 2032
Figure 64: Europe Third-Party Risk Management Market Y-o-Y Growth Projections, By Deployment Mode – 2022-2032
Figure 65: Europe Third-Party Risk Management Market Attractiveness Index, By Deployment Mode – 2022-2032
Figure 66: Europe Third-Party Risk Management Market Share, By Country, 2022 & 2032
Figure 67: Europe Third-Party Risk Management Market Y-o-Y Growth Projections, By Country – 2022-2032
Figure 68: Europe Third-Party Risk Management Market Attractiveness Index, By Country – 2022-2032
Figure 69: MEA Third-Party Risk Management Market Value (US$ Mn) and Year-on-Year Growth, 2015-2032
Figure 70: MEA Third-Party Risk Management Market Absolute $ Opportunity Historical (2015 - 2021) and Forecast Period (2022 – 2032), US$ Mn
Figure 71: MEA Third-Party Risk Management Market Share,By Component, 2022 & 2032
Figure 72: MEA Third-Party Risk Management Market Y-o-Y Growth Projections, By Component – 2022-2032
Figure 73: MEA Third-Party Risk Management Market Attractiveness Index, By Component – 2022-2032
Figure 74: MEA Third-Party Risk Management Market Share, By Vertical, 2022 & 2032
Figure 75: MEA Third-Party Risk Management Market Y-o-Y Growth Projections, By Vertical – 2022-2032
Figure 76: MEA Third-Party Risk Management Market Attractiveness Index, By Vertical – 2022-2032
Figure 77: MEA Third-Party Risk Management Market Share, By Organization Size , 2022 & 2032
Figure 78: MEA Third-Party Risk Management Market Y-o-Y Growth Projections, By Organization Size – 2022-2032
Figure 79: MEA Third-Party Risk Management Market Attractiveness Index, By Organization Size – 2022-2032
Figure 80: MEA Third-Party Risk Management Market Share, By Deployment Mode, 2022 & 2032
Figure 81: MEA Third-Party Risk Management Market Y-o-Y Growth Projections, By Deployment Mode – 2022-2032
Figure 82: MEA Third-Party Risk Management Market Attractiveness Index, By Deployment Mode – 2022-2032
Figure 83: MEA Third-Party Risk Management Market Share, By Country, 2022 & 2032
Figure 84: MEA Third-Party Risk Management Market Y-o-Y Growth Projections, By Country – 2022-2032
Figure 85: MEA Third-Party Risk Management Market Attractiveness Index, By Country – 2022-2032
Figure 86: Asia Pacific Third-Party Risk Management Market Value (US$ Mn) and Year-on-Year Growth, 2015-2032
Figure 87: Asia Pacific Third-Party Risk Management Market Absolute $ Opportunity Historical (2015 - 2021) and Forecast Period (2022 – 2032), US$ Mn
Figure 88: Asia Pacific Third-Party Risk Management Market Share, By Component , 2022 & 2032
Figure 89: Asia Pacific Third-Party Risk Management Market Y-o-Y Growth Projections,By Component – 2022-2032
Figure 90: Asia Pacific Third-Party Risk Management Market Attractiveness Index,By Component – 2022-2032
Figure 91: Asia Pacific Third-Party Risk Management Market Share, By Vertical, 2022 & 2032
Figure 92: Asia Pacific Third-Party Risk Management Market Y-o-Y Growth Projections, By Vertical – 2022-2032
Figure 93: Asia Pacific Third-Party Risk Management Market Attractiveness Index, By Vertical – 2022-2032
Figure 94: Asia Pacific Third-Party Risk Management Market Share, By Organization Size , 2022 & 2032
Figure 95: Asia Pacific Third-Party Risk Management Market Y-o-Y Growth Projections, By Organization Size – 2022-2032
Figure 96: Asia Pacific Third-Party Risk Management Market Attractiveness Index, By Organization Size – 2022-2032
Figure 97: Asia Pacific Third-Party Risk Management Market Share, By Deployment Mode, 2022 & 2032
Figure 98: Asia Pacific Third-Party Risk Management Market Y-o-Y Growth Projections, By Deployment Mode – 2022-2032
Figure 99: Asia Pacific Third-Party Risk Management Market Attractiveness Index, By Deployment Mode – 2022-2032
Figure 100: Asia Pacific Third-Party Risk Management Market Share, By Country, 2022 & 2032
Figure 101: Asia Pacific Third-Party Risk Management Market Y-o-Y Growth Projections, By Country – 2022-2032
Figure 102: Asia Pacific Third-Party Risk Management Market Attractiveness Index, By Country – 2022-2032
Need specific information?
Request CustomizationExplore Technology Insights
View Reports