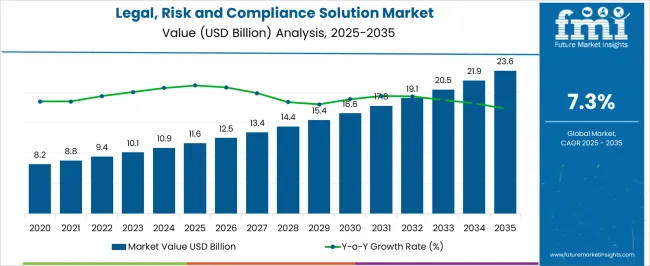
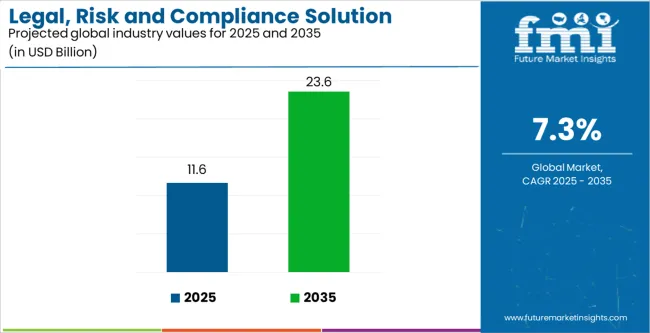
The legal, risk, and compliance solution market is valued at USD 11.6 billion in 2025 and is projected to reach USD 23.6 billion by 2035, expanding at a CAGR of 7.3%. Demand growth shows the increasing complexity of global business operations, heightened regulatory scrutiny, and the pressing need for organizations to adopt integrated governance frameworks. Companies across industries are facing greater accountability for risk management and compliance adherence, creating sustained demand for digital solutions that enhance oversight, streamline processes, and ensure transparent reporting. The rise in regulatory requirements across banking, financial services, healthcare, and manufacturing has been a key driver, as governments and regulatory bodies have tightened enforcement to reduce fraud, corruption, and systemic risks.
A significant trend shaping the market is the accelerated adoption of artificial intelligence, machine learning, and robotic process automation in compliance and risk solutions. These technologies are enabling predictive analytics, real-time monitoring, and automated compliance workflows, reducing reliance on manual audits and improving efficiency. The growing sophistication of financial crime, cybersecurity threats, and data breaches has also amplified the need for proactive compliance systems that combine regulatory intelligence with risk detection. Vendors are increasingly offering modular and cloud-based platforms, allowing enterprises to scale compliance infrastructure in line with evolving requirements, particularly in data privacy and cross-border transactions.
Another defining trend is the shift toward centralized compliance dashboards that provide enterprise-wide visibility. Organizations are seeking solutions that unify disparate functions such as legal case management, third-party risk assessment, environmental compliance, and financial auditing into a single system. This trend is particularly prominent among multinational corporations navigating diverse regulatory landscapes. With ESG (environmental, social, and governance) compliance emerging as a central component of corporate accountability, legal and risk management platforms are being upgraded to track sustainability metrics alongside financial and operational risks.
The increasing role of digital transformation in legal operations is also driving adoption. Contract lifecycle management, e-discovery tools, and digital case management systems are gaining traction as enterprises look to minimize legal costs while ensuring compliance efficiency. Cloud-based solutions and SaaS models are becoming standard, offering scalability, real-time updates, and integration with other enterprise software ecosystems. The combination of advanced analytics and natural language processing is improving contract analysis, regulatory mapping, and compliance monitoring at a granular level.
The future outlook remains highly positive as organizations continue to face regulatory challenges in an interconnected global economy. Growing demand for transparency, stakeholder accountability, and proactive governance frameworks will further accelerate investments in risk and compliance platforms. As enterprises evolve toward digital-first operations, the market for legal, risk, and compliance solutions will remain central to ensuring regulatory alignment, operational resilience, and corporate integrity.
| Metric | Value |
|---|---|
| Legal, Risk and Compliance Solution Market Estimated Value in (2025 E) | USD 11.6 billion |
| Legal, Risk and Compliance Solution Market Forecast Value in (2035 F) | USD 23.6 billion |
| Forecast CAGR (2025 to 2035) | 7.3% |
The market is segmented by Component and End-Use Industry and region. By Component, the market is divided into Software and Services. In terms of End-Use Industry, the market is classified into BFSI (Banking, Financial Services, Insurance Sectors), Healthcare Industry, Energy And Utilities, Manufacturing Industry, Retail And Consumer Goods, Telecom And IT, Mining And Natural Resources, Transportation And Logistics, and Others (Education, Construction). Regionally, the market is classified into North America, Latin America, Western Europe, Eastern Europe, Balkan & Baltic Countries, Russia & Belarus, Central Asia, East Asia, South Asia & Pacific, and the Middle East & Africa.
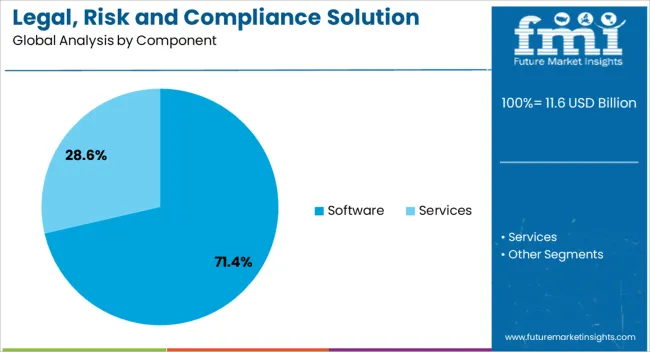
The software component segment is projected to hold 71.4% of the market revenue in 2025, establishing it as the leading component type. Its dominance is being driven by the demand for scalable, automated, and integrated solutions that manage legal, risk, and compliance processes efficiently. Software platforms enable organizations to centralize data, monitor regulatory changes, automate reporting, and generate actionable insights for decision-making, significantly reducing manual workloads.
Advanced analytics and AI-driven modules enhance predictive risk assessment, early detection of compliance breaches, and real-time monitoring, providing both operational and strategic benefits. Cloud-enabled deployments allow for seamless updates, remote accessibility, and integration with enterprise systems, further strengthening adoption.
Organizations are increasingly favoring software-based solutions over services due to lower costs, faster implementation, and the ability to adapt to evolving regulatory landscapes The software segment is expected to maintain leadership as enterprises continue to prioritize digital compliance tools and risk management automation.
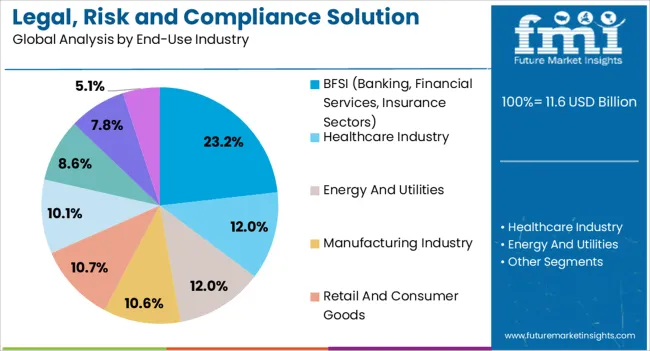
The BFSI sector is anticipated to account for 23.2% of the market revenue in 2025, making it the leading end-use industry. Growth is being driven by the highly regulated nature of banking, insurance, and financial services, where compliance requirements are stringent and penalties for violations are substantial. Legal, risk, and compliance solutions are increasingly being deployed to monitor transactions, detect fraud, manage regulatory reporting, and ensure adherence to industry standards.
The sector is also leveraging predictive analytics, AI, and automated reporting to identify potential risks, mitigate operational inefficiencies, and enhance decision-making. Rising cyber threats, financial crime risks, and cross-border regulations are reinforcing the need for proactive compliance strategies.
Integration of risk and compliance platforms with enterprise systems allows for real-time monitoring and improved operational control As financial institutions seek to maintain trust, reduce regulatory penalties, and strengthen governance frameworks, the BFSI segment is expected to remain a primary driver of market growth, supported by continuous innovation in software capabilities and risk intelligence.
The demand for legal, risk, and compliance solutions is presumed to develop at a moderate pace. The historical CAGR of 5.10% was recorded for the market and a 7.30% CAGR is calculated up to 2035.
| Attributes | Details |
|---|---|
| Legal, Risk and Compliance Solution Market Historical CAGR for 2020 to 2025 | 5.10% |
The legal, risk, and compliance solutions market faces obstructions such as improved awareness of compliance risks, lack of skilled personnel, high compliance costs, integration issues, and lack of standardization.
Acute aspects that are anticipated to influence the demand for legal, risk, and compliance solutions through 2035.
Market players are going to desire to be prudent and flexible over the anticipated period since these challenging attributes position the industry for accomplishment in subsequent decades.
Artificial Intelligence and Machine Learning Offer Fertile Ground to the Legal, Risk, and Compliance Solution Industry
The Legal, Risk and Compliance Solution Industry is Enormously Deploying Blockchain Solutions
Adoption of eGRC Boost up the Demand for Legal, Risk and Compliance Solutions
An in-depth analysis of different segments of the legal, risk, and compliance solution market has been conducted. Based on the outcome, it stands to reason that the demand for software is significant whereas the demand from the BFSI (Banking, Financial Services, and Insurance) sector is augmenting as of 2025.
| Attributes | Details |
|---|---|
| Top Component | Software |
| Market share in 2025 | 71.40% |
The legal, risk, and compliance solution software acquired a market share of 71.4% in 2025. The following aspects generate demand for legal, risk, and compliance solution software:
| Attributes | Details |
|---|---|
| Top End Use Industry | Banking, Financial Services, Insurance |
| Market share in 2025 | 23.20% |
The BFSI sector utilizes legal, risk and compliance solutions significantly, which is anticipated to acquire almost 23.20% market share in 2025. Factors creating demand in the BFSI sector include:
Based on the statistical data, the industries in Germany and Japan could potentially develop at a better speed relatively in the upcoming decade. Simultaneously, the legal, risk, and compliance solutions industry in the United States and China is hitting the roof. Australia's legal, risk, and compliance solutions sector is anticipated to skyrocket in the upcoming decade.
| Countries | CAGR from 2025 to 2035 |
|---|---|
| United States | 4.10% |
| Germany | 2.70% |
| China | 7.80% |
| Japan | 2.00% |
| Australia | 10.80% |
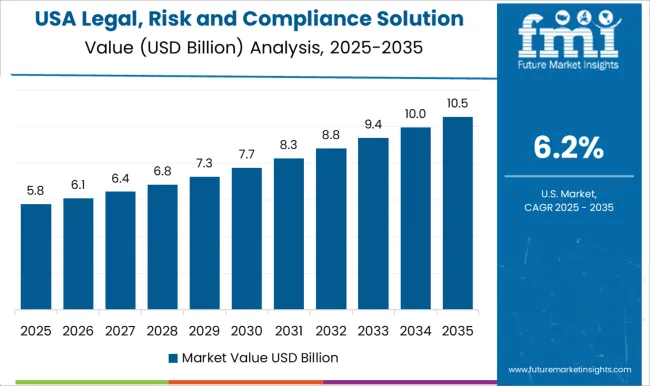
The legal risk and compliance solution industry in the United States to experience a CAGR of 4.10% through 2035. Here are a few of the major trends:
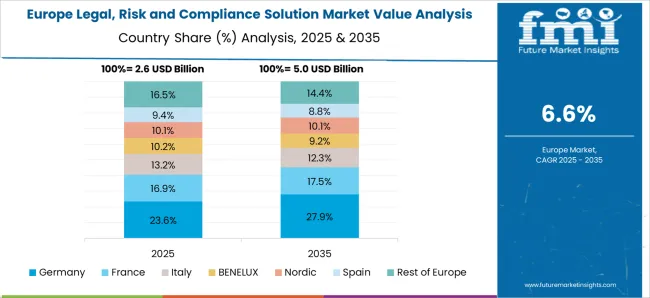
Demand for legal, risk and compliance solutions in Germany to develop at a CAGR of 2.70%. The following factors are propelling the adoption of legal, risk and compliance solutions in Germany:
Demand for legal, risk and compliance solutions in China to showcase a CAGR of 7.80% between 2025 and 2035. Some of the primary trends in the industry are:
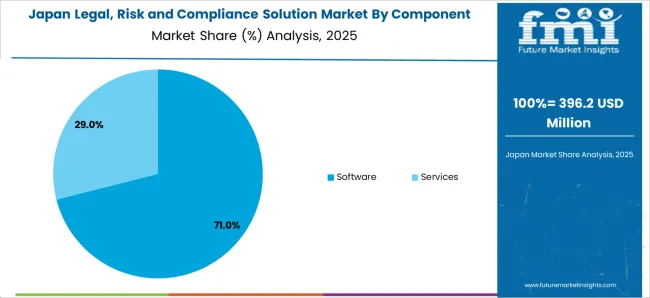
Adoption of legal, risk and compliance solutions in Japan to report a CAGR of 2.00% from 2025 to 2035. Some of the primary trends are:
The legal, risk and compliance solution industry in Australia to display a CAGR of 10.80% by 2035. Among the primary drivers of the market are:
The legal, risk, and compliance solution market is extending rapidly due to the advancing need for regulatory solutions and management. Governments and regulatory bodies all over the globe frequently develop pristine legal, risk, and compliance solutions to keep speed with the ever-changing industry topography. This has created a demand for automated legal, risk, and compliance solutions anticipated to aid global enterprises.
Triumphant alliances, mergers, and acquisitions depend laboriously on tense legal, risk, and compliance infrastructures. Companies must capitulate with stringent regulatory requirements to ensure smooth operations. This has led to designing sophisticated legal, risk, and compliance solutions that streamline business operations, encouraging organizations to focus on their substance competencies.
As the legal, risk, and compliance solution market matures, industries seek more state-of-the-art technologies and solutions to handle their regulatory conditions. This has led to the emergence of innovative solutions such as artificial intelligence (AI) and machine learning (ML) to assist organizations in staying ahead of regulatory shifts and ensuring compliance.
The legal, risk, and compliance solution market is desired to boost as businesses seek reliable and scalable solutions to manage their regulatory needs.
Recent Developments in the Legal, Risk and Compliance Solution Market
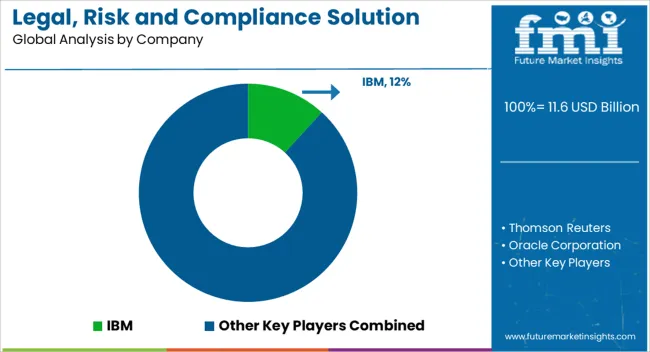
The global legal, risk and compliance solution market is estimated to be valued at USD 11.6 billion in 2025.
The market size for the legal, risk and compliance solution market is projected to reach USD 23.6 billion by 2035.
The legal, risk and compliance solution market is expected to grow at a 7.3% CAGR between 2025 and 2035.
The key product types in legal, risk and compliance solution market are software, _audit management, _compliance management, _risk management, _policy management, _incident management, _enterprise legal management, _legal document management, _others (analytics management, business continuity management, financial control management, issue management, it egrc), services, _compliance management services, _governance and risk management services and _data privacy services.
In terms of end-use industry, bfsi (banking, financial services, insurance sectors) segment to command 23.2% share in the legal, risk and compliance solution market in 2025.


Full Research Suite comprises of:
Market outlook & trends analysis
Interviews & case studies
Strategic recommendations
Vendor profiles & capabilities analysis
5-year forecasts
8 regions and 60+ country-level data splits
Market segment data splits
12 months of continuous data updates
DELIVERED AS:
PDF EXCEL ONLINE
Risk Management Market Size and Share Forecast Outlook 2025 to 2035
Risk-based Authentication (RBA) Market
Frisket Masking Film Market
Insider Risk Management Market Size and Share Forecast Outlook 2025 to 2035
Digital Risk Protection Platform Market Analysis by Solution, Enterprise Size, Industry and Region Through 2035
Global Clinical Risk Grouping Solution Market Insights – Trends & Forecast 2024-2034
Third-Party Risk Management Market Trends - Growth & Forecast through 2034
Construction Risk Assessment Software Market Size and Share Forecast Outlook 2025 to 2035
AI-Driven Treasury & Risk Management – Future-Proofing Finance
Financial Services Operational Risk Management Solution Market
North America, Europe & Asia Pacific Legal Cannabis Market Size and Share Forecast Outlook 2025 to 2035
The AI Legal Services Market Analysis - Size and Share Forecast Outlook 2025 to 2035
Legal AI Market Size and Share Forecast Outlook 2025 to 2035
Legal Process Outsourcing LPO Size Market Size and Share Forecast Outlook 2025 to 2035
Legal Services Market Size and Share Forecast Outlook 2025 to 2035
Australia Legal Cannabis Market - Size, Share, and Forecast 2025 to 2035
LegalTech Market Analysis - Size, Share, and Forecast 2025 to 2035
AI-Driven Legal Transcription – Automating Legal Documentation
Solution Styrene Butadiene Rubber (S-SBR) Market Size and Share Forecast Outlook 2025 to 2035
NGS Solution for Early Cancer Screening Market Size and Share Forecast Outlook 2025 to 2035

Thank you!
You will receive an email from our Business Development Manager. Please be sure to check your SPAM/JUNK folder too.
Chat With
MaRIA