North America, Europe & Asia Pacific Legal Cannabis Market Size and Share Forecast Outlook 2025 to 2035

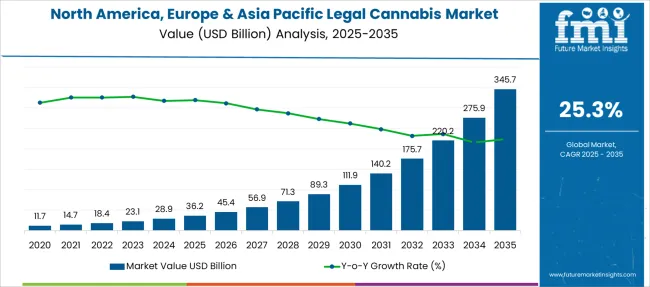
The North America, Europe & Asia Pacific Legal Cannabis Market is estimated to be valued at USD 36.2 billion in 2025 and is projected to reach USD 345.7 billion by 2035, registering a compound annual growth rate (CAGR) of 25.3% over the forecast period.
Quick Stats for North America, Europe & Asia Pacific Legal Cannabis Market

  • North America, Europe & Asia Pacific Legal Cannabis Market Industry Value (2025): USD 36.2 billion
  • North America, Europe & Asia Pacific Legal Cannabis Market Forecast Value (2035): USD 345.7 billion
  • North America, Europe & Asia Pacific Legal Cannabis Market Forecast CAGR: 25.3%
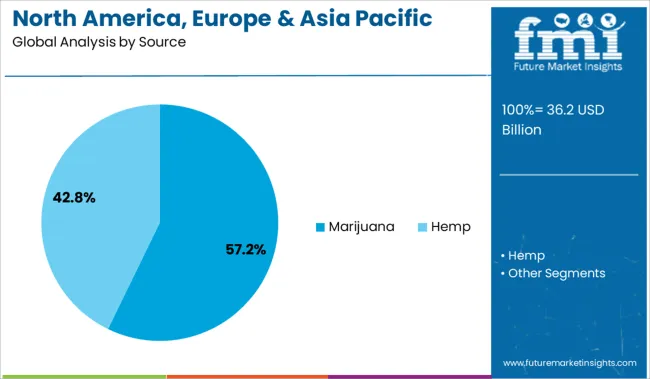
  • Leading Segment in North America, Europe & Asia Pacific Legal Cannabis Market in 2025: Marijuana (57.2%)
  • Key Growth Region in North America, Europe & Asia Pacific Legal Cannabis Market: North America, Asia-Pacific, Europe
  • Top Key Players in North America, Europe & Asia Pacific Legal Cannabis Market: Aurora Cannabis, Tilray, GW Pharmaceuticals, Canopy Growth Corporation, Lexaria Bioscience Corp., Organigram Holdings Inc., VIVO Cannabis Inc., The Cronos Group, AusCann Group Holdings Ltd., Cann Group Limited, Bod Australia, Zelira Therapeutics, Althea Group, Epsilon Healthcare, MGC Pharma, ECOFIBRE

North America, Europe & Asia Pacific Legal Cannabis Market Market Value Analysis

Metric Value
North America, Europe & Asia Pacific Legal Cannabis Market Estimated Value in (2025 E) USD 36.2 billion
North America, Europe & Asia Pacific Legal Cannabis Market Forecast Value in (2035 F) USD 345.7 billion
Forecast CAGR (2025 to 2035) 25.3%

Rationale for Segmental Growth in the North America, Europe & Asia Pacific Legal Cannabis Market

The legal cannabis market across North America, Europe, and Asia Pacific is growing rapidly, driven by evolving regulations and expanding consumer acceptance. The medical use of cannabis is becoming increasingly recognized, prompting healthcare providers and policymakers to integrate cannabis-based treatments into standard care.

Regulatory reforms have facilitated access to cannabis products, supporting the expansion of cultivation, processing, and retail activities. The market is also influenced by increasing research into therapeutic benefits and a growing number of patients seeking alternative treatments.

Additionally, advancements in product quality and safety standards are improving consumer confidence. Rising public awareness and education about cannabis applications have further accelerated market growth. The combined impact of these factors is expected to continue driving expansion across the key regions.

Segmental Analysis

The market is segmented by Source, Derivates, and End-Use and region. By Source, the market is divided into Marijuana and Hemp. In terms of Derivates, the market is classified into CBD, THC, and Others. Based on End-Use, the market is segmented into Medical Use, Recreational Use, and Industrial Use. Regionally, the market is classified into North America, Latin America, Western Europe, Eastern Europe, Balkan & Baltic Countries, Russia & Belarus, Central Asia, East Asia, South Asia & Pacific, and the Middle East & Africa.
Insights into the Source Segment: Marijuana

North America, Europe & Asia Pacific Legal Cannabis Market Analysis By Source

The Marijuana segment is projected to hold 57.2% of the legal cannabis market revenue in 2025, maintaining its leading position among sources. This is attributed to marijuana’s higher concentrations of active cannabinoids, making it the preferred raw material for both medical and recreational products.

The cultivation and processing of marijuana have benefited from technological advances and improved agricultural practices. Regulatory frameworks continue to support its use in approved medical applications, fueling steady demand.

Furthermore, marijuana’s versatility allows for extraction into various derivative products, sustaining its dominance as the primary source.
Insights into the Derivates Segment: CBD

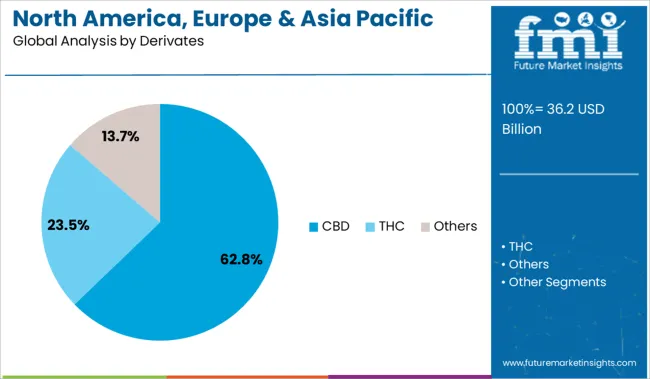
North America, Europe & Asia Pacific Legal Cannabis Market Analysis By Derivates

The CBD segment is expected to account for 62.8% of the market revenue in 2025, making it the dominant derivative product. CBD’s non-psychoactive properties have made it widely accepted for medical and wellness use. Clinical interest in CBD’s potential to manage conditions such as pain, inflammation, and anxiety has driven its incorporation into a variety of formulations.

Consumer preference for CBD products is bolstered by perceptions of safety and fewer regulatory restrictions compared to THC-rich products.

Its broad applicability in oils, tinctures, edibles, and topicals has expanded its market share significantly.

Insights into the End-Use Segment: Medical Use

The Medical Use segment is projected to contribute 48.9% of the legal cannabis market revenue in 2025, leading among end-use categories. Growth in this segment has been driven by increased acceptance of cannabis as a therapeutic option for a range of conditions including chronic pain, epilepsy, and multiple sclerosis.

Healthcare providers have increasingly prescribed cannabis-based products due to growing clinical evidence supporting their efficacy. Patient demand has also risen as medical cannabis becomes more accessible through pharmacies and specialized dispensaries.

Regulatory support and ongoing research into cannabis therapeutics are expected to sustain growth in medical use applications.

Key Drivers Fueling Growth in Legal Cannabis Across North America, Europe & Asia Pacific

In the upcoming years, the demand for medical marijuana is anticipated to increase due to the expanding number of states that have legalized the drug and the rising demand from both medical and recreational uses. This is expected to drive the demand for North America, Europe & Asia Pacific legal cannabis.

Demand for North America, Europe & Asia Pacific legal cannabis is anticipated to rise during the anticipated time frame as a result of more research and development being done.

Challenges Restraining the Legal Cannabis Market Across Key Regions

In several parts of North America, Africa, Australia, Europe, and South America, marijuana is nominally recognized as a drug and is permitted for medical usage. But the majority of Middle Eastern and Asian nations continue to forbid it. Consumption, possession, purchase, or sale of the commodity is illegal and is regarded as a crime in developing nations like Japan, India, and Korea. As a result, it is anticipated that the legal environment for these items will prevent the North America, Europe & Asia Pacific legal cannabis industry from reaching its full growth potential. Growth is also anticipated to be constrained by adverse effects including cognitive impairment linked to its usage as medicine.

The global pandemic has significantly hampered the North America, Europe & Asia Pacific legal cannabis market growth. The North America, Europe & Asia Pacific legal cannabis market has been hit by a number of major challenges, including trade restrictions, the adoption of a lockdown in several important nations, and supply chain interruptions.

Category-wise Insights for the Global Legal Cannabis Market

Which Type of North America, Europe & Asia Pacific Legal Cannabis Derivatives are Most Preferred in the Global Market?

The highest North America, Europe & Asia Pacific legal cannabis market share in 2024—more than 65.0 percent—went to CBD. Since legalization, there has been a considerable increase in the use of medical cannabis, and the majority of products used for therapeutic purposes contain CBD.

Demand for North America, Europe & Asia Pacific legal cannabis is also anticipated to increase throughout the forecasted period as hemp-derived cannabidiol (CBD) is increasingly used in skincare and cosmetics, gummies, beverages, pet food, capsules, and dog treats.

Which Segment of the North America, Europe & Asia Pacific Legal Cannabis Market on the Basis of End Use is Performing Better?

In 2024, the medical use segment's North America, Europe & Asia Pacific legal cannabis revenue share was above 65.0 percent, which was the highest. Cannabis use has increased dramatically as more places legalize it, particularly in North America where most states have approved medical use of the drug. This is related to the product's expanding use in the treatment of insomnia, anxiety disorders, and chronic pain. Furthermore, the expansion of the segment is being aided by rising practitioner knowledge.

Due to the relaxation of cannabis use legislation, the Asia Pacific region of the North America, Europe & Asia Pacific legal cannabis market is anticipated to see a large increase in the recreational use segment.
Regional Performance and Growth Trends in Legal Cannabis

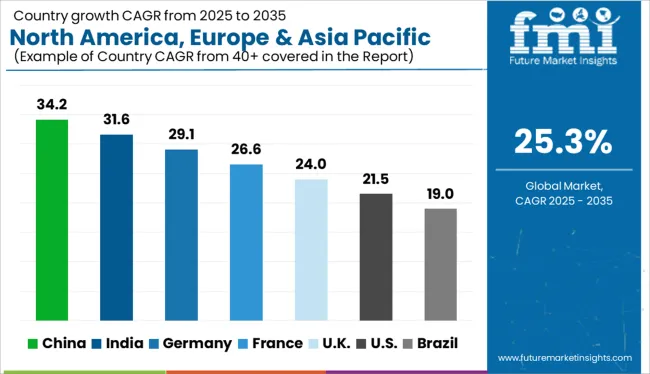
North America, Europe & Asia Pacific Legal Cannabis Market Cagr Analysis By Country

How North America, Europe & Asia Pacific Legal Cannabis Market Share is performing in Asia Pacific?

Asia-Pacific region of the North America, Europe & Asia Pacific legal cannabis market is anticipated to experience the fastest growth during the anticipated time. Growth is anticipated to be boosted by the increasing legalization and supportive laws for the use of cannabis and its derivative products in various nations. For instance, Thailand delisted marijuana from its list of prohibited substances in 2024. This is expected to lead to an increase in hemp and marijuana use across the nation.

What is the Performance of North America, Europe & Asia Pacific Legal Cannabis Market in the North American Region?

Highest North America, Europe & Asia Pacific legal cannabis market share in 2024 belonged to North America, which was worth USD 11.7 billion. As of July 2020, it was allowed for recreational use in eleven states and the District of Columbia. All state medical hemp legislation in the United States accepted it as a treatment or medication for ailments like cancer, Alzheimer's disease, anorexia, arthritis, chronic pain, epilepsy, and post-traumatic stress disorder. By taking the lead in the international legalization of marijuana, Canada has recently become recognized as a flag-bearer nation. Additionally, the number of its farmers in the U.S. has substantially expanded, supporting its use and consumption. This is expected to boost sales of North America, Europe & Asia Pacific legal cannabis and give local businesses access to new revenue streams.

How North America, Europe & Asia Pacific Legal Cannabis Market Share is performing in Europe?

Europe is the second-largest region in the North America, Europe & Asia Pacific legal cannabis market after the United States because of its progressive laws and rising medicinal marijuana use. Trials have shown that medicinal marijuana is helpful in some European nations, where it is being used lawfully in healthcare settings to treat everything from cancer to appetite stimulants for those with AIDS-related disease.

The demand for North America, Europe & Asia Pacific legal cannabis is also anticipated to rise quickly as a result of changes in government policies. The necessary legislation is very new in many nations; the Greek government legalised medical marijuana in 2020, the same year as the United Kingdom. As a result, it is anticipated that increased use of the product for medical purposes will increase regional sales.
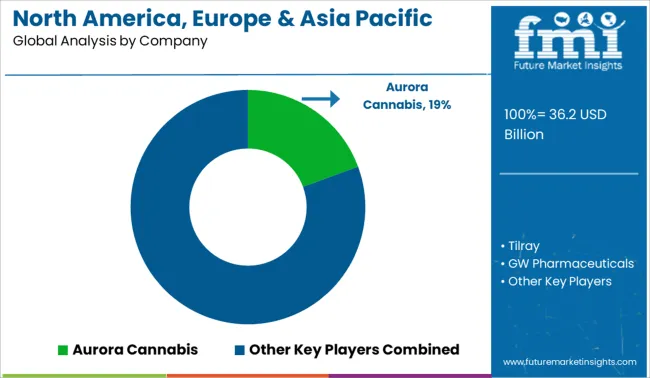
Competitive Landscape of the Legal Cannabis Market

North America, Europe & Asia Pacific Legal Cannabis Market Analysis By Company

As the tide of legalization slowly sweeps the world, the North America, Europe & Asia Pacific legal cannabis industry remains fiercely competitive and vibrantly dynamic. New collaborations and expansions are already under way. Younger consumers are predicted to develop more complex patterns of recreational consumption and take greater risks when experimenting with various product variants. Therefore, a change from flower/bud to more processed formats including edibles, oils, and topical applications is being caused by the rapidly growing popularity of recreational use, and this movement has been adequately reacted to by important North America, Europe & Asia Pacific legal cannabis market players.

Recent Developments in Global North America, Europe & Asia Pacific Legal Cannabis Market

The world's largest cannabis company will be formed through the combination of Aphria Inc. and Tilray, Inc. (Canada), according to a definitive agreement that was signed in December 2024. The combined company would have a full line of branded Cannabis 2.0 goods in Canada, supported by low-cost facilities for cultivation, processing, and manufacturing.

One of the biggest independent craft breweries, SW Brewing Company, LLC (US), was acquired by Aphria Inc. in November 2024. SweetWater provides complementing cannabis lifestyle brands, which would aid Aphria in broadening the scope of its product line.

Start-up Ecosystem and Emerging Innovators in Legal Cannabis

Olla, founded in 2020, which aspires to be the WordPress of online cannabis retailers, offers a completely configurable interface that enables businesses to create custom websites without having to give up important web space to another provider's branding. Olla aims to make the process of ordering cannabis online simpler for everyone. It was created with a mobile-first attitude and has open connections with cannabis POS and CRM systems like Flow Hub and Green Bits. Olla-using retailers report an order completion rate of 88 percent, a fivefold increase in order volume, and 92 percent of customers placing mobile orders.

Top Legal Cannabis Market Players in North America, Europe & Asia Pacific

  • Aurora Cannabis
  • Canopy Growth Corporation
  • Tilray
  • VIVO Cannabis Inc.
  • GW Pharmaceuticals
  • Lexaria Bioscience Corp.
  • Bod Australia
  • Organigram Holdings Inc.
  • The Cronos Group
  • AusCann Group Holdings Ltd.
  • Cann Group Limited
  • THC Global Group Limited
  • Althea Group
  • Zelira Therapeutics
  • MGC Pharma

Top Segments Studied in the Legal Cannabis Market by Region

By Source:

  • Marijuana
    • Flower
    • Oil & Tinctures
  • Hemp
    • Hemp CBD
    • Supplements
    • Industrial Hemp

By Derivates:

  • CBD
  • THC
  • Others

By End-Use:

  • Medical Use
    • Cancer
    • Chronic Pain
    • Depression and Anxiety
    • Arthritis
    • Diabetes
    • Glaucoma
    • Migraines
    • Epilepsy
    • Multiple Sclerosis
    • AIDS
    • Amyotrophic Lateral Sclerosis
    • Alzheimer’s
    • Post-Traumatic Stress Disorder (PTSD)
    • Parkinson's
    • Tourette’s
    • Others
  • Recreational Use
  • Industrial Use
    • Textile
    • Non-textile

By Region:

  • North America
  • Latin America
  • Europe
  • East Asia
  • South Asia
  • Oceania
  • Middle East and Africa

Table of Content

  1. Executive Summary
    • Global Market Outlook
    • Demand-side Trends
    • Supply-side Trends
    • Technology Roadmap Analysis
    • Analysis and Recommendations
  2. Market Overview
    • Market Coverage / Taxonomy
    • Market Definition / Scope / Limitations
  3. Market Background
    • Market Dynamics
      • Drivers
      • Restraints
      • Opportunity
      • Trends
    • Scenario Forecast
      • Demand in Optimistic Scenario
      • Demand in Likely Scenario
      • Demand in Conservative Scenario
    • Opportunity Map Analysis
    • Product Life Cycle Analysis
    • Supply Chain Analysis
    • Investment Feasibility Matrix
    • Value Chain Analysis
    • PESTLE and Porter’s Analysis
    • Regulatory Landscape
    • Regional Parent Market Outlook
    • Production and Consumption Statistics
    • Import and Export Statistics
  4. Global Market Analysis 2020 to 2024 and Forecast, 2025 to 2035
    • Historical Market Size Value (USD Million) Analysis, 2020 to 2024
    • Current and Future Market Size Value (USD Million) Projections, 2025 to 2035
      • Y-o-Y Growth Trend Analysis
      • Absolute $ Opportunity Analysis
  5. Global Market Pricing Analysis 2020 to 2024 and Forecast 2025 to 2035
  6. Global Market Analysis 2020 to 2024 and Forecast 2025 to 2035, By Source
    • Introduction / Key Findings
    • Historical Market Size Value (USD Million) Analysis By Source , 2020 to 2024
    • Current and Future Market Size Value (USD Million) Analysis and Forecast By Source , 2025 to 2035
      • Marijuana
        • Flower
        • Oil & Tinctures
      • Hemp
        • Hemp CBD
        • Supplements
        • Industrial Hemp
    • Y-o-Y Growth Trend Analysis By Source , 2020 to 2024
    • Absolute $ Opportunity Analysis By Source , 2025 to 2035
  7. Global Market Analysis 2020 to 2024 and Forecast 2025 to 2035, By Derivates
    • Introduction / Key Findings
    • Historical Market Size Value (USD Million) Analysis By Derivates, 2020 to 2024
    • Current and Future Market Size Value (USD Million) Analysis and Forecast By Derivates, 2025 to 2035
      • CBD
      • THC
      • Others
    • Y-o-Y Growth Trend Analysis By Derivates, 2020 to 2024
    • Absolute $ Opportunity Analysis By Derivates, 2025 to 2035
  8. Global Market Analysis 2020 to 2024 and Forecast 2025 to 2035, By End-Use
    • Introduction / Key Findings
    • Historical Market Size Value (USD Million) Analysis By End-Use, 2020 to 2024
    • Current and Future Market Size Value (USD Million) Analysis and Forecast By End-Use, 2025 to 2035
      • Medical Use
        • Cancer
        • Chronic Pain
        • Depression and Anxiety
        • Arthritis
        • Diabetes
        • Glaucoma
        • Migraines
        • Epilepsy
        • Multiple Sclerosis
        • AIDS
      • Recreational Use
      • Industrial Use
        • Textile
        • Non-textile
    • Y-o-Y Growth Trend Analysis By End-Use, 2020 to 2024
    • Absolute $ Opportunity Analysis By End-Use, 2025 to 2035
  9. Global Market Analysis 2020 to 2024 and Forecast 2025 to 2035, By Region
    • Introduction
    • Historical Market Size Value (USD Million) Analysis By Region, 2020 to 2024
    • Current Market Size Value (USD Million) Analysis and Forecast By Region, 2025 to 2035
      • North America
      • Latin America
      • Western Europe
      • Eastern Europe
      • East Asia
      • South Asia and Pacific
      • Middle East & Africa
    • Market Attractiveness Analysis By Region
  10. North America Market Analysis 2020 to 2024 and Forecast 2025 to 2035, By Country
    • Historical Market Size Value (USD Million) Trend Analysis By Market Taxonomy, 2020 to 2024
    • Market Size Value (USD Million) Forecast By Market Taxonomy, 2025 to 2035
      • By Country
        • USA
        • Canada
        • Mexico
      • By Source
      • By Derivates
      • By End-Use
    • Market Attractiveness Analysis
      • By Country
      • By Source
      • By Derivates
      • By End-Use
    • Key Takeaways
  11. Latin America Market Analysis 2020 to 2024 and Forecast 2025 to 2035, By Country
    • Historical Market Size Value (USD Million) Trend Analysis By Market Taxonomy, 2020 to 2024
    • Market Size Value (USD Million) Forecast By Market Taxonomy, 2025 to 2035
      • By Country
        • Brazil
        • Chile
        • Rest of Latin America
      • By Source
      • By Derivates
      • By End-Use
    • Market Attractiveness Analysis
      • By Country
      • By Source
      • By Derivates
      • By End-Use
    • Key Takeaways
  12. Western Europe Market Analysis 2020 to 2024 and Forecast 2025 to 2035, By Country
    • Historical Market Size Value (USD Million) Trend Analysis By Market Taxonomy, 2020 to 2024
    • Market Size Value (USD Million) Forecast By Market Taxonomy, 2025 to 2035
      • By Country
        • Germany
        • UK
        • Italy
        • Spain
        • France
        • Nordic
        • BENELUX
        • Rest of Western Europe
      • By Source
      • By Derivates
      • By End-Use
    • Market Attractiveness Analysis
      • By Country
      • By Source
      • By Derivates
      • By End-Use
    • Key Takeaways
  13. Eastern Europe Market Analysis 2020 to 2024 and Forecast 2025 to 2035, By Country
    • Historical Market Size Value (USD Million) Trend Analysis By Market Taxonomy, 2020 to 2024
    • Market Size Value (USD Million) Forecast By Market Taxonomy, 2025 to 2035
      • By Country
        • Russia
        • Poland
        • Hungary
        • Balkan & Baltic
        • Rest of Eastern Europe
      • By Source
      • By Derivates
      • By End-Use
    • Market Attractiveness Analysis
      • By Country
      • By Source
      • By Derivates
      • By End-Use
    • Key Takeaways
  14. East Asia Market Analysis 2020 to 2024 and Forecast 2025 to 2035, By Country
    • Historical Market Size Value (USD Million) Trend Analysis By Market Taxonomy, 2020 to 2024
    • Market Size Value (USD Million) Forecast By Market Taxonomy, 2025 to 2035
      • By Country
        • China
        • Japan
        • South Korea
      • By Source
      • By Derivates
      • By End-Use
    • Market Attractiveness Analysis
      • By Country
      • By Source
      • By Derivates
      • By End-Use
    • Key Takeaways
  15. South Asia and Pacific Market Analysis 2020 to 2024 and Forecast 2025 to 2035, By Country
    • Historical Market Size Value (USD Million) Trend Analysis By Market Taxonomy, 2020 to 2024
    • Market Size Value (USD Million) Forecast By Market Taxonomy, 2025 to 2035
      • By Country
        • India
        • ASEAN
        • Australia & New Zealand
        • Rest of South Asia and Pacific
      • By Source
      • By Derivates
      • By End-Use
    • Market Attractiveness Analysis
      • By Country
      • By Source
      • By Derivates
      • By End-Use
    • Key Takeaways
  16. Middle East & Africa Market Analysis 2020 to 2024 and Forecast 2025 to 2035, By Country
    • Historical Market Size Value (USD Million) Trend Analysis By Market Taxonomy, 2020 to 2024
    • Market Size Value (USD Million) Forecast By Market Taxonomy, 2025 to 2035
      • By Country
        • Kingdom of Saudi Arabia
        • Other GCC Countries
        • Turkiye
        • South Africa
        • Other African Union
        • Rest of Middle East & Africa
      • By Source
      • By Derivates
      • By End-Use
    • Market Attractiveness Analysis
      • By Country
      • By Source
      • By Derivates
      • By End-Use
    • Key Takeaways
  17. Key Countries Market Analysis
    • USA
      • Pricing Analysis
      • Market Share Analysis, 2024
        • By Source
        • By Derivates
        • By End-Use
    • Canada
      • Pricing Analysis
      • Market Share Analysis, 2024
        • By Source
        • By Derivates
        • By End-Use
    • Mexico
      • Pricing Analysis
      • Market Share Analysis, 2024
        • By Source
        • By Derivates
        • By End-Use
    • Brazil
      • Pricing Analysis
      • Market Share Analysis, 2024
        • By Source
        • By Derivates
        • By End-Use
    • Chile
      • Pricing Analysis
      • Market Share Analysis, 2024
        • By Source
        • By Derivates
        • By End-Use
    • Germany
      • Pricing Analysis
      • Market Share Analysis, 2024
        • By Source
        • By Derivates
        • By End-Use
    • UK
      • Pricing Analysis
      • Market Share Analysis, 2024
        • By Source
        • By Derivates
        • By End-Use
    • Italy
      • Pricing Analysis
      • Market Share Analysis, 2024
        • By Source
        • By Derivates
        • By End-Use
    • Spain
      • Pricing Analysis
      • Market Share Analysis, 2024
        • By Source
        • By Derivates
        • By End-Use
    • France
      • Pricing Analysis
      • Market Share Analysis, 2024
        • By Source
        • By Derivates
        • By End-Use
    • India
      • Pricing Analysis
      • Market Share Analysis, 2024
        • By Source
        • By Derivates
        • By End-Use
    • ASEAN
      • Pricing Analysis
      • Market Share Analysis, 2024
        • By Source
        • By Derivates
        • By End-Use
    • Australia & New Zealand
      • Pricing Analysis
      • Market Share Analysis, 2024
        • By Source
        • By Derivates
        • By End-Use
    • China
      • Pricing Analysis
      • Market Share Analysis, 2024
        • By Source
        • By Derivates
        • By End-Use
    • Japan
      • Pricing Analysis
      • Market Share Analysis, 2024
        • By Source
        • By Derivates
        • By End-Use
    • South Korea
      • Pricing Analysis
      • Market Share Analysis, 2024
        • By Source
        • By Derivates
        • By End-Use
    • Russia
      • Pricing Analysis
      • Market Share Analysis, 2024
        • By Source
        • By Derivates
        • By End-Use
    • Poland
      • Pricing Analysis
      • Market Share Analysis, 2024
        • By Source
        • By Derivates
        • By End-Use
    • Hungary
      • Pricing Analysis
      • Market Share Analysis, 2024
        • By Source
        • By Derivates
        • By End-Use
    • Kingdom of Saudi Arabia
      • Pricing Analysis
      • Market Share Analysis, 2024
        • By Source
        • By Derivates
        • By End-Use
    • Turkiye
      • Pricing Analysis
      • Market Share Analysis, 2024
        • By Source
        • By Derivates
        • By End-Use
    • South Africa
      • Pricing Analysis
      • Market Share Analysis, 2024
        • By Source
        • By Derivates
        • By End-Use
  18. Market Structure Analysis
    • Competition Dashboard
    • Competition Benchmarking
    • Market Share Analysis of Top Players
      • By Regional
      • By Source
      • By Derivates
      • By End-Use
  19. Competition Analysis
    • Competition Deep Dive
      • Aurora Cannabis
        • Overview
        • Product Portfolio
        • Profitability by Market Segments (Product/Age /Sales Channel/Region)
        • Sales Footprint
        • Strategy Overview
          • Marketing Strategy
          • Product Strategy
          • Channel Strategy
      • Tilray
      • GW Pharmaceuticals
      • Canopy Growth Corporation
      • Lexaria Bioscience Corp.
      • Organigram Holdings Inc.
      • VIVO Cannabis Inc.
      • The Cronos Group
      • AusCann Group Holdings Ltd.
      • Cann Group Limited
      • Bod Australia
      • Zelira Therapeutics
      • Althea Group
      • Epsilon Healthcare
      • MGC Pharma
      • ECOFIBRE
  20. Assumptions & Acronyms Used
  21. Research Methodology

List of Tables

  • Table 1: Global Market Value (USD Million) Forecast by Region, 2020-2035
  • Table 2: Global Market Value (USD Million) Forecast by Source , 2020-2035
  • Table 3: Global Market Value (USD Million) Forecast by Derivates, 2020-2035
  • Table 4: Global Market Value (USD Million) Forecast by End-Use, 2020-2035
  • Table 5: North America Market Value (USD Million) Forecast by Country, 2020-2035
  • Table 6: North America Market Value (USD Million) Forecast by Source , 2020-2035
  • Table 7: North America Market Value (USD Million) Forecast by Derivates, 2020-2035
  • Table 8: North America Market Value (USD Million) Forecast by End-Use, 2020-2035
  • Table 9: Latin America Market Value (USD Million) Forecast by Country, 2020-2035
  • Table 10: Latin America Market Value (USD Million) Forecast by Source , 2020-2035
  • Table 11: Latin America Market Value (USD Million) Forecast by Derivates, 2020-2035
  • Table 12: Latin America Market Value (USD Million) Forecast by End-Use, 2020-2035
  • Table 13: Western Europe Market Value (USD Million) Forecast by Country, 2020-2035
  • Table 14: Western Europe Market Value (USD Million) Forecast by Source , 2020-2035
  • Table 15: Western Europe Market Value (USD Million) Forecast by Derivates, 2020-2035
  • Table 16: Western Europe Market Value (USD Million) Forecast by End-Use, 2020-2035
  • Table 17: Eastern Europe Market Value (USD Million) Forecast by Country, 2020-2035
  • Table 18: Eastern Europe Market Value (USD Million) Forecast by Source , 2020-2035
  • Table 19: Eastern Europe Market Value (USD Million) Forecast by Derivates, 2020-2035
  • Table 20: Eastern Europe Market Value (USD Million) Forecast by End-Use, 2020-2035
  • Table 21: East Asia Market Value (USD Million) Forecast by Country, 2020-2035
  • Table 22: East Asia Market Value (USD Million) Forecast by Source , 2020-2035
  • Table 23: East Asia Market Value (USD Million) Forecast by Derivates, 2020-2035
  • Table 24: East Asia Market Value (USD Million) Forecast by End-Use, 2020-2035
  • Table 25: South Asia and Pacific Market Value (USD Million) Forecast by Country, 2020-2035
  • Table 26: South Asia and Pacific Market Value (USD Million) Forecast by Source , 2020-2035
  • Table 27: South Asia and Pacific Market Value (USD Million) Forecast by Derivates, 2020-2035
  • Table 28: South Asia and Pacific Market Value (USD Million) Forecast by End-Use, 2020-2035
  • Table 29: Middle East & Africa Market Value (USD Million) Forecast by Country, 2020-2035
  • Table 30: Middle East & Africa Market Value (USD Million) Forecast by Source , 2020-2035
  • Table 31: Middle East & Africa Market Value (USD Million) Forecast by Derivates, 2020-2035
  • Table 32: Middle East & Africa Market Value (USD Million) Forecast by End-Use, 2020-2035

List of Figures

  • Figure 1: Global Market Pricing Analysis
  • Figure 2: Global Market Value (USD Million) Forecast 2020-2035
  • Figure 3: Global Market Value (USD Million) Share and BPS Analysis by Region, 2025 and 2035
  • Figure 4: Global Market Y-o-Y Growth Comparison by Region, 2025-2035
  • Figure 5: Global Market Attractiveness Analysis by Region
  • Figure 6: North America Market Incremental Dollar Opportunity, 2025-2035
  • Figure 7: Latin America Market Incremental Dollar Opportunity, 2025-2035
  • Figure 8: Western Europe Market Incremental Dollar Opportunity, 2025-2035
  • Figure 9: Eastern Europe Market Incremental Dollar Opportunity, 2025-2035
  • Figure 10: East Asia Market Incremental Dollar Opportunity, 2025-2035
  • Figure 11: South Asia and Pacific Market Incremental Dollar Opportunity, 2025-2035
  • Figure 12: Middle East & Africa Market Incremental Dollar Opportunity, 2025-2035
  • Figure 13: North America Market Value Share and BPS Analysis by Country, 2025 and 2035
  • Figure 14: Latin America Market Value Share and BPS Analysis by Country, 2025 and 2035
  • Figure 15: Western Europe Market Value Share and BPS Analysis by Country, 2025 and 2035
  • Figure 16: Eastern Europe Market Value Share and BPS Analysis by Country, 2025 and 2035
  • Figure 17: East Asia Market Value Share and BPS Analysis by Country, 2025 and 2035
  • Figure 18: South Asia and Pacific Market Value Share and BPS Analysis by Country, 2025 and 2035
  • Figure 19: Middle East & Africa Market Value Share and BPS Analysis by Country, 2025 and 2035
  • Figure 20: Global Market - Tier Structure Analysis
  • Figure 21: Global Market - Company Share Analysis

Frequently Asked Questions

How big is the north america, europe & asia pacific legal cannabis market in 2025?

The global north america, europe & asia pacific legal cannabis market is estimated to be valued at USD 36.2 billion in 2025.

What will be the size of north america, europe & asia pacific legal cannabis market in 2035?

The market size for the north america, europe & asia pacific legal cannabis market is projected to reach USD 345.7 billion by 2035.

How much will be the north america, europe & asia pacific legal cannabis market growth between 2025 and 2035?

The north america, europe & asia pacific legal cannabis market is expected to grow at a 25.3% CAGR between 2025 and 2035.

What are the key product types in the north america, europe & asia pacific legal cannabis market?

The key product types in north america, europe & asia pacific legal cannabis market are marijuana, _flower, _oil & tinctures, hemp, _hemp cbd, _supplements and _industrial hemp.

Which derivates segment to contribute significant share in the north america, europe & asia pacific legal cannabis market in 2025?

In terms of derivates, CBD segment to command 62.8% share in the north america, europe & asia pacific legal cannabis market in 2025.

Explore Similar Insights

Future Market Insights

North America, Europe & Asia Pacific Legal Cannabis Market