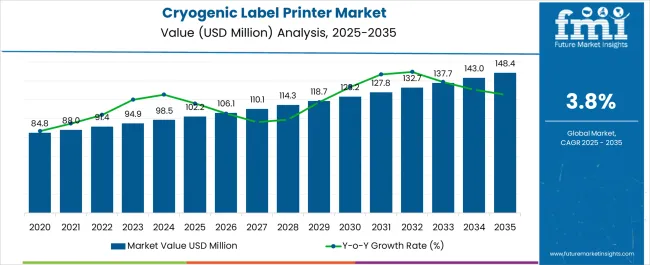
The North America Cryogenic Label Printer Market is estimated to be valued at USD 102.2 million in 2025 and is projected to reach USD 148.4 million by 2035, registering a compound annual growth rate (CAGR) of 3.8% over the forecast period.
| Metric | Value |
|---|---|
| North America Cryogenic Label Printer Market Estimated Value in (2025 E) | USD 102.2 million |
| North America Cryogenic Label Printer Market Forecast Value in (2035 F) | USD 148.4 million |
| Forecast CAGR (2025 to 2035) | 3.8% |
The North America cryogenic label printer market is experiencing steady expansion, fueled by the increasing demand for reliable labeling solutions in laboratories, biobanks, and pharmaceutical cold storage applications. The region’s strong focus on biotechnology, clinical research, and pharmaceutical manufacturing has accelerated the adoption of advanced cryogenic labeling systems capable of withstanding ultra-low temperature environments.
Industry announcements and laboratory equipment updates have emphasized the importance of precise identification of biological samples, ensuring traceability and compliance with regulatory standards. Investments in healthcare infrastructure, coupled with the growth of clinical trials and genetic research, have heightened the need for labeling technologies that ensure durability under cryogenic storage conditions.
Additionally, manufacturers are introducing printers with higher efficiency, user-friendly software integration, and compatibility with laboratory information management systems. Looking forward, the market is expected to benefit from continuous innovation in labeling materials, the expansion of biopharmaceutical pipelines, and the rising adoption of automated laboratory workflows across North America.
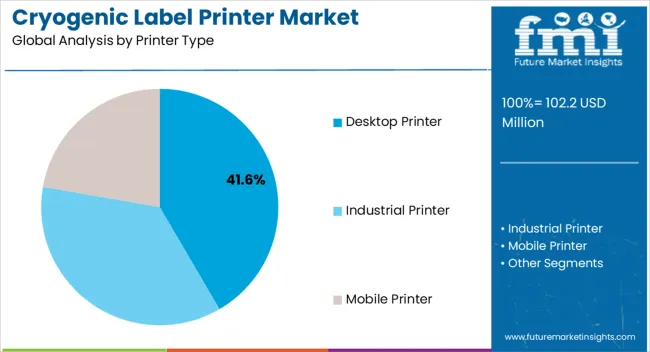
The Desktop Printer segment is projected to account for 41.60% of the North America cryogenic label printer market revenue in 2025, establishing itself as the leading printer type. Growth in this segment has been driven by the widespread preference for compact and cost-effective printers in laboratory and research settings.
Desktop printers have been valued for their ease of integration into laboratory benches, efficient printing speed, and ability to handle moderate-volume labeling needs. Laboratories and biobanks have increasingly favored desktop solutions due to their flexibility in producing high-resolution labels for cryogenic vials, tubes, and storage containers.
Furthermore, manufacturers have enhanced desktop printers with intuitive interfaces, wireless connectivity, and improved durability to meet the stringent requirements of cryogenic applications. As smaller labs and mid-sized research facilities continue to prioritize cost-effective yet reliable solutions, the Desktop Printer segment is expected to maintain its leading role.
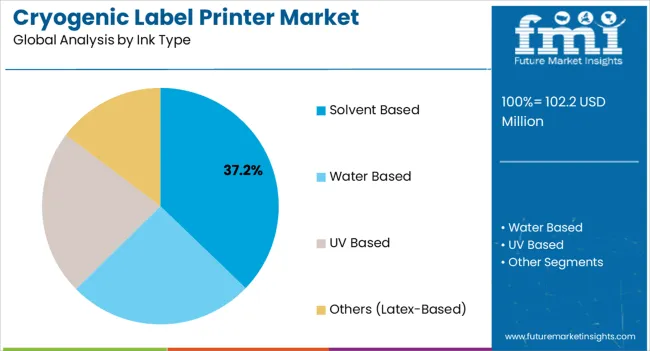
The Solvent Based segment is projected to contribute 37.20% of the North America cryogenic label printer market revenue in 2025, positioning it as the leading ink type. This growth has been underpinned by the superior adhesion and resistance properties of solvent-based inks, which ensure labels remain intact under extreme cryogenic conditions.
Industry reports have highlighted that solvent-based inks provide strong durability against smearing, moisture, and chemical exposure, which are critical factors for labels stored in liquid nitrogen environments. Their compatibility with a variety of label materials has further supported adoption across pharmaceutical and biotechnology laboratories.
In addition, solvent-based inks have been recognized for their ability to maintain print clarity over extended storage durations, thereby ensuring reliable sample identification. Despite growing interest in eco-friendly alternatives, solvent-based inks remain the preferred choice for critical cryogenic applications where performance consistency is paramount.
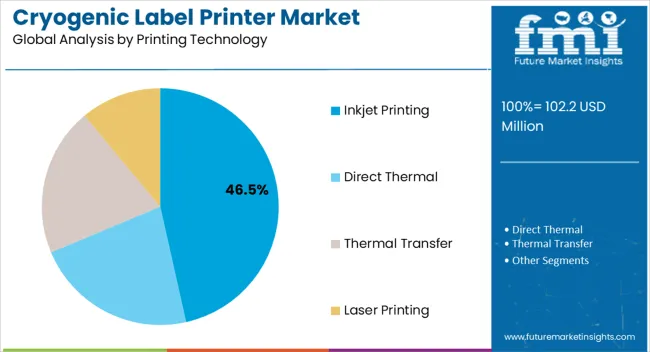
The Inkjet Printing segment is projected to hold 46.50% of the North America cryogenic label printer market revenue in 2025, sustaining its position as the dominant printing technology. Inkjet printers have been widely adopted due to their high-resolution printing capabilities, speed, and versatility in handling diverse label formats.
Laboratories and healthcare facilities have favored inkjet printing for its ability to produce durable, legible, and detailed labels required for cryogenic storage. Moreover, continuous technological advancements have improved inkjet printers with faster print speeds, higher accuracy, and greater cost efficiency. Inkjet printing has also been supported by its compatibility with solvent-based inks, reinforcing its suitability for demanding cryogenic conditions.
Market demand has further been stimulated by the adoption of automation in laboratories, where inkjet printers are integrated into larger workflows for seamless sample tracking. With innovation in printer heads and consumable efficiency, the Inkjet Printing segment is expected to remain the preferred technology in the region.
North America cryogenic label printer market expanded at a CAGR of 3.3% during the historical period from 2020 to 2025. It showcased a market value of USD 102.2 million in 2025, up from USD 84.8 million in 2020.
Ability of specialized cryogenic label printers to meet the needs of laboratories and research facilities is set to aid demand. They are designed to create high-quality labels for several lab applications.
Their use might surge for identifying specimen containers, tubes, and slides. Key companies will likely launch new printers with useful features, including barcode and QR code printing.
Such features are projected to help make sample tracking and data management more efficient. Cryogenic label printers must be integrated with laboratory information management systems (LIMS).
They also offer data integration and cloud connectivity options. This is set to help streamline the label-creation process and promote collaboration among lab personnel.
The healthcare sector plays a significant role in pushing cryogenic label printer sales. Labs are anticipated to use these printers for streamlining research and samples. At the same time, they might be utilized for tracking laboratory records.
Growth of North America’s healthcare sector would play a vital role in enabling research activities. As the healthcare sector grows and evolves, there is an increased demand for pharmaceutical and pathological laboratories.
Consistent increase in pharmaceutical expenditure by the government has positively impacted the North America cryogenic label printer market. Moreover, rapid growth and transformation of the healthcare sector are poised to drive the North America cryogenic label printer market.
| Attributes | Key Factors |
|---|---|
| Latest Trends |
|
| Growth Obstacles |
|
| Upcoming Opportunities |
|
The table below puts forward the market share of two significant countries in North America, namely, the United States and Canada. Out of these, the United States is anticipated to dominate the space of North America cryogenic label printer market in the evaluation period.
The United States is expected to witness a CAGR of 3.5% in the forecast period, generating an astonishing share of 76.4% in 2035. Conversely, Canada is set to follow the footprints of the former and register a 5.8% CAGR.
| Country | Market Share (2035) |
|---|---|
| United States | 76.4% |
| Canada | 23.6% |
According to United States Bureau of Labor Statistics data, demand for skilled professionals in medical laboratories will increase by over 7% between 2024 and 2035. Multiple laboratories report a shrinking workforce, especially in the clinical and diagnostic divisions.
Total number of active pathologists has also been falling consistently. Vacancies for personnel across clinical laboratories have been increasing in recent times. Moreover, the average workforce age is rising, which might hamper efficiency and flow.
Laboratory label printers can take up to 10 seconds to handwrite and apply a label to laboratory instruments such as test tubes. However, cryogenic label printers can print and apply a label in under 5 seconds. Growing shortage of laboratory staff is set to provide a lucrative opportunity for the United States in the North America cryogenic label printer market.
The United States is anticipated to account for 80.1% of the North America cryogenic label printer market share in 2025. It is projected to record a 3.5% CAGR during the forecast years.
| Country | CAGR (2025 to 2035) |
|---|---|
| United States | 3.5% |
| Canada | 5.8% |
Growth of the pharmaceutical sector in Canada is expected to drive cryogenic label printer sales. The incidence of chronic diseases and comorbidities associated with diseases will likely impact Canada's growth positively in the North America cryogenic label printer market.
According to Government of Canada, pharmaceutical sales in Canada gained a value of USD 29.9 billion, which accounted for a 35.3% increment. The pharmaceutical sector is dynamic and constantly evolving.
As new medications and treatments are developed, cryogenic label printers must be adaptable to accurately print new information and designs. Canada is expected to create a definite financial potential worth USD 148.4 million through 2035, expanding at a CAGR of 5.8%.
Below table shows thermal transfer to be the leading segment in printing technology in 2025, at 39.9% share. It is projected to surge at a CAGR of 3.3% through 2035. Based on end use, medical and clinical laboratories will likely be the dominant segment in the North America cryogenic label printer market, growing at an absolute USD opportunity of USD 148.4 million by 2035.
| Category | Market Share (2025) |
|---|---|
| Thermal Transfer (by Printing Technology) | 39.9% |
| Medical and Clinical Laboratories (by End-use) | 29.9% |
Based on printing technology, the thermal transfer segment will likely generate a share of more than 39.9% in 2025 in the North America cryogenic label printer market. It is expected to rise at a CAGR of 3.3% over the forecast period.
Thermal transfer printing technology is an ideal solution for long-term printing applications. It is primarily helpful for printing media that are exposed to harsh conditions. Thermal transfer printing is paramount for laboratory specimens, asset tracking, blood bags, and cold & freezer storage. This is projected to lead to increased demand for the same.
Demand for pharmaceutical products is increasing, which is driving growth of the North America cryogenic label printer market. Medical and clinical laboratories are an important part of the pharmaceutical sector. They require labels for diverse applications such as tracking and identification.
Based on end use, medical and clinical laboratories are expected to generate a more than 29.9% share in the North America cryogenic label printer market in 2025. They are projected to create a certain monetary opportunity worth USD 148.4 million through 2035.
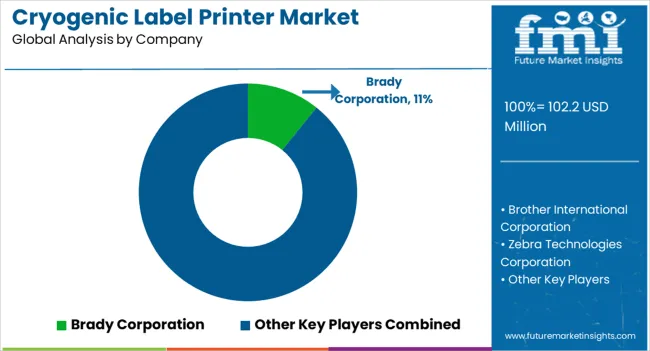
Leading companies in the North America cryogenic label printer market are focusing on investing huge sums in research & development activities. With these, they are set to develop technologically advanced printers for several requirements.
A handful of other companies focus on mergers, acquisitions, and joint ventures to co-develop innovative products. They are also collaborating with reputed healthcare facilities to develop novel devices for their use within the North America cryogenic label printer market.
For instance:
| Attribute | Details |
|---|---|
| Estimated North America Cryogenic Label Printer Market Size (2025) | USD 102.2 million |
| Projected North America Cryogenic Label Printer Market Valuation (2035) | USD 148.4 million |
| Value-based CAGR (2025 to 2035) | 3.8% |
| Historical Data | 2020 to 2025 |
| Forecast Period | 2025 to 2035 |
| Quantitative Units | Value (USD million) |
| Segments Covered | Printer Type, Printing Technology, Ink Type, Laboratory End Use, Country |
| Key Countries Covered | United States, Canada |
| Key Companies Profiled | Brady Corporation; Brother International Corporation; Zebra Technologies Corporation; Seiko Epson Corporation; Cab Produkttechnik GmbH & Co KG; Citizen Systems Europe GmbH OKI Group; Newell Brands Inc.; Sato Holdings Corp; Honeywell International Inc.; Canon Inc.; Primera Technology Inc.; Computype; TSC Auto ID Technology Co., Ltd |
The global North America cryogenic label printer market is estimated to be valued at USD 102.2 million in 2025.
The market size for the North America cryogenic label printer market is projected to reach USD 148.4 million by 2035.
The North America cryogenic label printer market is expected to grow at a 3.8% CAGR between 2025 and 2035.
The key product types in North America cryogenic label printer market are desktop printer, industrial printer and mobile printer.
In terms of ink type, solvent based segment to command 37.2% share in the North America cryogenic label printer market in 2025.


Full Research Suite comprises of:
Market outlook & trends analysis
Interviews & case studies
Strategic recommendations
Vendor profiles & capabilities analysis
5-year forecasts
8 regions and 60+ country-level data splits
Market segment data splits
12 months of continuous data updates
DELIVERED AS:
PDF EXCEL ONLINE
Northern Blotting Market Size and Share Forecast Outlook 2025 to 2035
Northern Europe Calcium Sulphate Market Size and Share Forecast Outlook 2025 to 2035
North America Boat Trailer Market Size and Share Forecast Outlook 2025 to 2035
North America Chitosan Market Size and Share Forecast Outlook 2025 to 2035
North America Underground Mining Vehicle Market Size and Share Forecast Outlook 2025 to 2035
North America Bulk Aseptic Packaging Market Size and Share Forecast Outlook 2025 to 2035
North America Licorice Extract Market Size and Share Forecast Outlook 2025 to 2035
North America Par Baked Bread Market Size and Share Forecast Outlook 2025 to 2035
North America Silo Bags Market Size and Share Forecast Outlook 2025 to 2035
North America Fresh Meat Packaging Market Size and Share Forecast Outlook 2025 to 2035
North America Ceramic Barbeque Grill Market Size and Share Forecast Outlook 2025 to 2035
North America Temperature Sensor Market Size and Share Forecast Outlook 2025 to 2035
North American Dietary Supplements Market Size and Share Forecast Outlook 2025 to 2035
North America Head-up Display Market Size and Share Forecast Outlook 2025 to 2035
North America, Europe & Asia Pacific Legal Cannabis Market Size and Share Forecast Outlook 2025 to 2035
North America Ceiling Cassette Market Size and Share Forecast Outlook 2025 to 2035
North America Pressure Regulating Valves Market Size and Share Forecast Outlook 2025 to 2035
North America Flame Retardant Thermoplastics Market Size and Share Forecast Outlook 2025 to 2035
Fire Pit Market Analysis in North America - Growth, Trends and Forecast from 2025 to 2035
North America Electrical Testing Services Market - Growth & Demand 2025 to 2035

Thank you!
You will receive an email from our Business Development Manager. Please be sure to check your SPAM/JUNK folder too.
Chat With
MaRIA