North America boat trailer demand is anticipated to reach from USD 857.1 million in 2025 to approximately USD 1,478 million by 2035, recording an absolute increase of USD 618.7 million over the forecast period. This translates into total growth of 72.2%, with demand forecast to expand at a CAGR of 5.6% between 2025 and 2035.
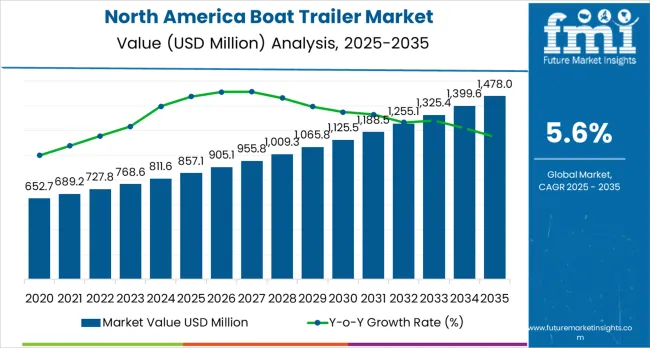
Total sales are expected to grow by nearly 1.72X during the same period, supported by rising recreational boating activities and increasing demand for lightweight, corrosion-resistant trailer solutions across coastal and inland waterway regions.
Between 2025 and 2030, North America boat trailer demand is projected to expand from USD 857.1 million to USD 1,115.3 million, resulting in a value increase of USD 258.2 million, which represents 41.7% of the total forecast growth for the decade. This phase of growth will be shaped by rising penetration of recreational boating across suburban and coastal communities, increasing boat ownership rates among middle-income households, and growing awareness about proper trailer maintenance and safety compliance. Service providers and manufacturers are expanding their distribution networks to address the growing complexity of modern boat transportation requirements.
From 2030 to 2035, demand is forecast to grow from USD 1,115.3 million to USD 1,478 million, adding another USD 360.5 million, which constitutes 58.3% of the ten-year expansion. This period is expected to be characterized by expansion of lightweight aluminum trailer adoption, integration of advanced braking and suspension systems, and development of standardized towing protocols across different boat categories.
The growing adoption of larger recreational vessels and multi-axle trailer configurations will drive demand for more sophisticated engineering solutions and specialized technical expertise.
Between 2020 and 2025, North America boat trailer demand experienced steady expansion, driven by increasing recreational boating participation rates and growing awareness of corrosion-resistant materials following exposure to saltwater and harsh environmental conditions. Sales developed as marine equipment retailers and boat dealerships recognized the need for durable, reliable trailer solutions to properly support diverse vessel types. Marine insurance providers and boat manufacturers began emphasizing proper trailer specifications to maintain vessel safety and warranty coverage.
| Metric | Value |
|---|---|
| North America Boat Trailer Sales Value (2025) | USD 857.1 million |
| North America Boat Trailer Forecast Value (2035) | USD 1,478 million |
| North America Boat Trailer Forecast CAGR (2025 to 2035) | 5.6% |
Sales expansion is being supported by the rapid increase in recreational boat ownership across North America and the corresponding need for specialized trailer solutions for transportation, storage, and launching activities. Modern boat owners rely on precise weight distribution and corrosion-resistant construction to ensure proper functioning of towing systems including surge brakes, leaf spring suspension, and adjustable bunks or rollers. Even minor upgrades or replacements can require comprehensive evaluation to maintain optimal performance and vessel safety.
The growing complexity of boat trailer technologies and increasing liability concerns are driving demand for professional-grade trailers from certified manufacturers with appropriate engineering and compliance expertise. Marine insurance companies are increasingly requiring proper trailer documentation and capacity ratings to maintain coverage and ensure vessel safety compliance. Regulatory requirements and boat manufacturer specifications are establishing standardized towing procedures that require specialized equipment and trained installation technicians.
Demand is segmented by material type, product type, boat size, distribution channel, and country. By material type, sales are divided into aluminum trailers, galvanized steel, and painted steel. Based on product type, demand is categorized into bunk trailers, roller trailers, and float-on trailers.
In terms of boat size, sales are segmented into small boats (under 20 feet), mid-size boats (20-30 feet), and large boats (over 30 feet). By distribution channel, demand is classified into marine dealerships, specialty trailer retailers, and online direct sales. By country, sales are divided into United States, Canada, and Mexico.
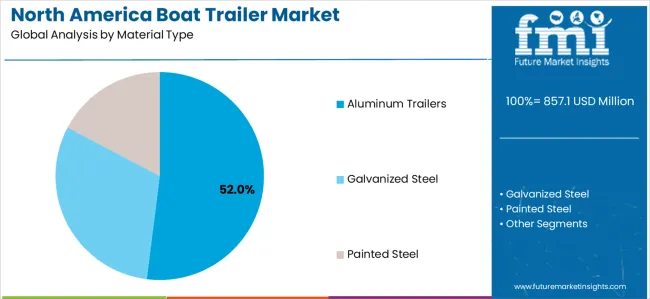
Aluminum trailers are projected to capture 52% of North America’s boat trailer demand in 2025, establishing themselves as the dominant material type. Aluminum is highly favored for both saltwater and freshwater boating due to its lightweight construction, corrosion resistance, and long service life, particularly in coastal regions where exposure to saltwater rapidly deteriorates steel alternatives.
The adoption of welded aluminum frames further enhances durability while reducing maintenance costs, making them attractive for both recreational and professional boat owners. The aluminum trailers provide a favorable balance between strength and fuel efficiency during towing, enabling better performance for long-distance transport.
The segment’s leadership is reinforced by well-established supply chains, multiple specialized manufacturers, and widespread consumer familiarity with aluminum solutions. This ensures availability across diverse boat sizes, from small personal watercraft to mid-size and large recreational vessels.
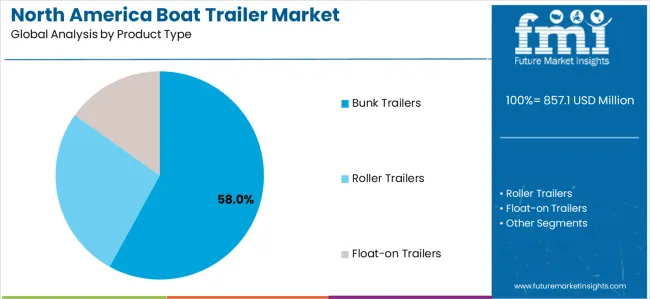
Bunk trailers are expected to represent 58% of North America’s boat trailer demand in 2025, reflecting their versatility and widespread use among recreational vessel owners. These trailers are especially popular due to their ease of use, cost-effectiveness, and strong compatibility with a wide range of boats. Modern bunk trailer designs now feature adjustable carpeted bunks that protect boat hulls while allowing for quick modifications when owners upgrade or replace their vessels. Their construction supports consistent hull alignment during launching and retrieval, reducing wear and enhancing long-term watercraft performance.
The segment’s continued leadership is also driven by rising awareness of proper hull support, as consumers prioritize solutions that minimize structural stress on their boats. Further, bunk trailers are widely compatible with standardized marina launch ramps, making them the go-to option for most recreational boating activities.
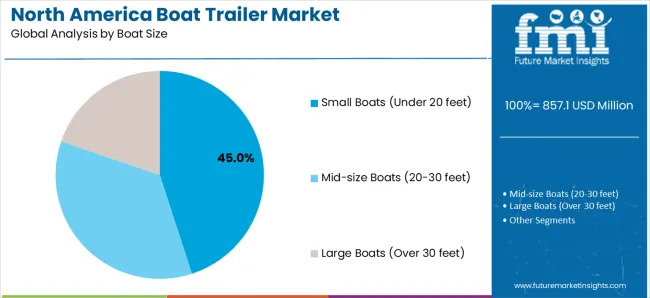
Mid-size boats ranging from 20–30 feet are projected to contribute 45% of demand in 2025, representing the most common vessel category in recreational boating and sport fishing. These boats often require dual-axle trailers with reinforced frames and advanced braking systems to ensure safe towing and balanced weight distribution. The versatility of mid-size boats, including family cruising, coastal fishing, and leisure activities, makes them highly popular across both inland waterways and coastal regions.
Trailers designed for mid-size boats are typically engineered with standardized specifications, ensuring compatibility across multiple brands and watercraft types. Growing consumer demand for family-oriented recreational boating and the popularity of coastal fishing expeditions are fueling this segment’s expansion. As boating becomes an increasingly popular lifestyle and leisure pursuit, demand for mid-size trailers is expected to remain robust, supported by steady vessel ownership growth and recreational infrastructure development.
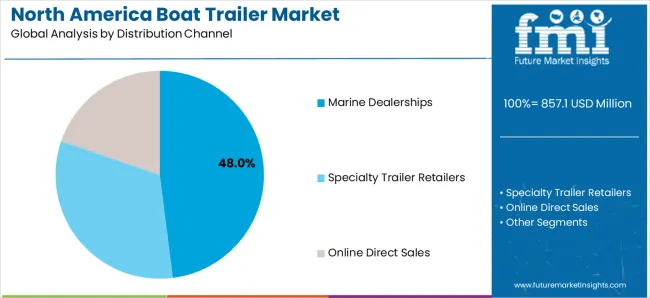
Marine dealerships are estimated to hold 48% of North America’s boat trailer sales share in 2025, reflecting their dominance as the primary distribution channel. Most new boat purchases are bundled with trailers, as consumers prefer integrated solutions endorsed by manufacturers and dealers.
Dealerships offer customization services tailored to boat specifications, providing convenience to first-time owners and seasoned buyers alike. This channel also plays a critical role in after-sales service and maintenance, ensuring boat owners have access to parts, warranty services, and upgrades. The dominance of marine dealerships is further supported by partnerships with manufacturers, enabling seamless delivery of standardized, high-quality trailers designed specifically for branded vessels.
North America’s boat trailer demand is advancing steadily, driven by the rising popularity of recreational boating and increasing consumer recognition of trailer quality as a critical factor in boating safety and convenience. Growth is further supported by expanding marina facilities, coastal tourism, and family-oriented recreational water activities. The industry faces challenges such as fluctuating raw material costs, especially for aluminum and steel, and the need for continuous innovation in lightweight construction. The varying towing requirements across boat sizes from small personal watercraft to larger fishing and leisure vessels—necessitate a wide product portfolio. Safety certification programs and regulatory compliance continue to influence sales and product development trends.
The adoption of aluminum frame construction is expanding rapidly in the North American boat trailer market, offering superior corrosion resistance and reduced maintenance needs compared to traditional steel. Aluminum trailers with welded I-beam frames provide extended lifespans, making them ideal for saltwater applications, high-frequency launch operations, and storage in harsh marine environments. These trailers also reduce towing weight, improving fuel efficiency for truck and SUV owners. Manufacturers are investing in aluminum technologies to stay competitive and address consumer demand for long-lasting, rust-resistant solutions. As coastal boating activity expands, aluminum trailer adoption is expected to remain the preferred choice for recreational and commercial users.
Boat trailer manufacturers in North America are increasingly integrating advanced braking and suspension technologies to enhance safety, performance, and regulatory compliance. Surge braking systems, combined with independent torsion axle suspensions, deliver smoother rides, reduced wear on trailers, and better control for operators. These systems are particularly important as larger recreational vessels such as pontoons and center-console fishing boats become more popular. The use of LED lighting, galvanized hardware, and corrosion-resistant components ensures trailers meet strict safety standards while reducing maintenance needs. Advanced engineering is enabling manufacturers to design trailers capable of supporting modern watercraft with higher performance and reliability expectations.
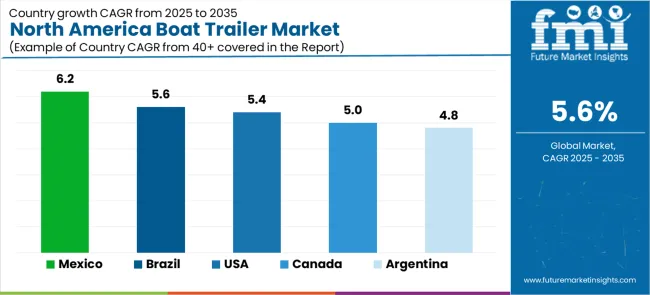
| Country | CAGR (2025-2035) |
|---|---|
| United States | 5.4% |
| Canada | 5.0% |
| Mexico | 6.2% |
| Brazil | 5.6% |
| Argentina | 4.8% |
North America boat trailer demand is growing rapidly, with Mexico leading at a 6.2% CAGR through 2035, driven by expanding coastal tourism, growing marine recreation infrastructure, and increasing middle-class boat ownership. United States follows at 5.4%, supported by established recreational boating culture across Great Lakes, coastal, and inland waterway regions.
Canada grows steadily at 5.0%, integrating trailer upgrades into its expanding marine tourism sector. Brazil records 5.6%, emphasizing recreational fishing and coastal boating activities. Argentina shows the slowest growth at 4.8%, focusing on niche riverine and lake-based recreational segments.
The report covers an in-depth analysis of 15+ countries, Top-performing countries are highlighted below.
The boat trailer sales in United States is projected to exhibit strong growth with a CAGR of 5.4% through 2035, driven by established recreational boating traditions and increasing consumer spending on marine equipment and watercraft accessories. The country's extensive network of lakes, rivers, and coastal waterways are creating significant demand for reliable trailer solutions. Major marine equipment retailers and boat manufacturers are establishing comprehensive distribution networks to support the growing population of boat owners across suburban and rural communities.
The United States benefits from well-developed marine infrastructure including boat ramps, storage facilities, and service centers that require standardized trailer specifications. Growing participation in fishing tournaments, water sports activities, and family recreational outings is driving consistent replacement cycles and upgrade demand.
The proliferation of aluminum trailer adoption reflects increasing consumer awareness of long-term value and corrosion resistance benefits, particularly in saltwater environments along Atlantic, Pacific, and Gulf Coast regions where traditional steel trailers experience accelerated deterioration.
The boat trailer sales in Canada is expanding at a CAGR of 5.0%, supported by increasing recreational boating participation in coastal provinces and growing awareness of corrosion-resistant trailer requirements. The country's expanding marine tourism sector and increasing seasonal boat usage are driving demand for professional-grade trailer solutions.
Authorized marine dealerships and specialty retailers are gradually establishing capabilities to serve the growing population of boat owners. Canadian demand patterns reflect strong regional variations, with British Columbia and Ontario representing primary consumption centers due to extensive coastline access and Great Lakes proximity.
The seasonal nature of Canadian boating activities creates concentrated purchasing periods during spring and early summer months when boat owners prepare for recreation season. Growing cottage country development and investment in waterfront properties are expanding boat ownership beyond traditional urban centers into rural and remote regions.
Environmental considerations and government regulations regarding invasive species transportation are increasing awareness of proper trailer maintenance and cleaning protocols, driving demand for trailers with integrated wash-down capabilities and corrosion-resistant components suitable for frequent exposure to inspection station procedures.
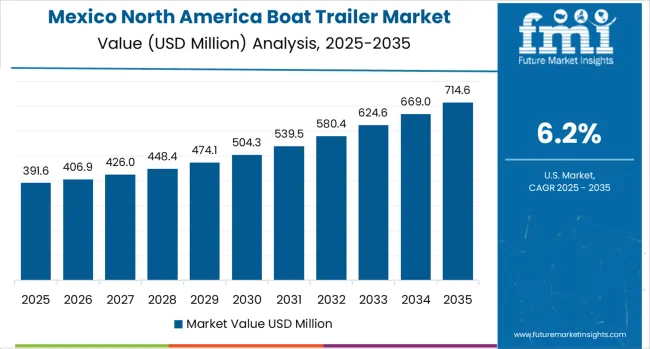
The boat trailer sales in Mexico is growing at a CAGR of 6.2%, driven by increasing boat ownership along Pacific and Caribbean coastlines and growing recognition of aluminum trailer advantages in saltwater environments. The country's developing marine infrastructure is gradually integrating modern trailer technologies to serve tourism and recreational fishing sectors.
Marine equipment retailers and boat dealerships are investing in inventory expansion and customer education to address growing demand. Mexico's rapid coastal tourism development, particularly in regions such as Quintana Roo, Baja California, and Nayarit, is creating substantial opportunities for trailer suppliers. The expansion of marina facilities and boat launch infrastructure in resort destinations is facilitating greater recreational boating accessibility for both domestic and international visitors.
Growing middle-class prosperity and increasing disposable income levels are enabling higher rates of personal watercraft and small boat ownership, particularly in metropolitan areas near coastal regions. The traditional prevalence of commercial fishing fleets is gradually being complemented by recreational boating activities, creating diverse demand patterns across different vessel categories and trailer specifications suitable for both work and leisure applications.
Demand for boat trailers in Brazil is projected to grow at a CAGR of 5.6%, supported by the country's emphasis on recreational fishing activities and extensive inland waterway networks. Brazilian marine equipment suppliers are implementing comprehensive trailer offerings that meet diverse vessel types and regional transport conditions.
Sales are characterized by focus on affordability, durability, and compliance with national road safety regulations. Brazil's vast river systems, including the Amazon basin and Pantanal wetlands, create unique trailer requirements for navigating unpaved roads and challenging transport conditions.
The country's strong fishing culture, both sport and subsistence-based, drives consistent demand for smaller capacity trailers suitable for aluminum fishing boats and inflatable vessels. Urban centers such as São Paulo, Rio de Janeiro, and coastal regions demonstrate growing interest in recreational boating as leisure activity gains popularity among emerging middle-class segments.
Brazilian consumers typically prioritize value-oriented solutions with lower initial investment costs, creating opportunities for galvanized steel trailer manufacturers alongside premium aluminum options targeting affluent buyers in metropolitan markets.
Demand for boat trailers in Argentina is expanding at a CAGR of 4.8%, driven by increasing recreational boating along major river systems and growing emphasis on lake-based tourism activities. Marine equipment retailers and boat dealerships are establishing trailer offerings to serve regional recreational needs. Sales benefit from seasonal boating patterns and growing middle-class participation in water-based recreation.
Argentina's extensive river network, including the Paraná, Uruguay, and Negro river systems, provides diverse recreational boating opportunities that require specialized trailer solutions adapted to riverine conditions. The Tigre Delta region near Buenos Aires represents a concentrated boating hub where trailer demand reflects both residential and tourism-related usage patterns.
Patagonian lake districts are experiencing growing recreational boating interest as domestic tourism expands into southern regions, creating demand for trailers capable of long-distance highway transport across varied terrain. Economic fluctuations and currency volatility create purchasing cycles where consumers prioritize durable, long-lasting trailer investments during stable periods. Growing environmental awareness and protection of aquatic ecosystems are influencing regulatory frameworks around boat transport and launch protocols.
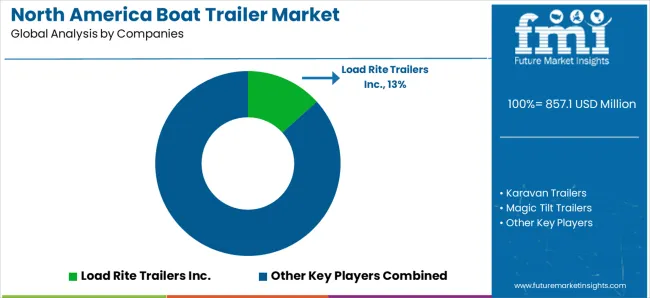
North America boat trailer sales are defined by competition among specialized manufacturers, marine equipment suppliers, and aftermarket distributors. Companies are investing in lightweight materials, advanced suspension systems, standardized safety features, and multi-axle configurations to deliver durable, reliable, and cost-effective trailer solutions. Strategic partnerships, technological innovation, and distribution expansion are central to strengthening product portfolios and regional presence.
Load Rite Trailers Inc., USA-based, offers comprehensive bunk and roller trailer solutions with a focus on corrosion resistance, weight capacity, and engineering precision. Karavan Trailers, operating regionally, provides aluminum trailer innovations integrated with recreational boating equipment and towing accessories. Magic Tilt Trailers, USA, delivers technologically advanced trailer designs with standardized specifications and multi-vessel compatibility. EZ Loader, USA, emphasizes advanced suspension technology and nationwide availability through marine dealership networks.
Magnum Trailers Inc., USA, offers custom trailer solutions integrated into specialized boat transportation requirements. These manufacturers provide trailer configurations across aluminum and galvanized steel categories, ensuring comprehensive product ranges that address diverse vessel types, towing capacities, and regional environmental conditions across North America.
| Item | Value |
|---|---|
| Quantitative Units | USD 1.5 billion |
| Material Type | Aluminum Trailers, Galvanized Steel, and Painted Steel |
| Product Type | Bunk Trailers, Roller Trailers, and Float-on Trailers |
| Boat Size | Small Boats (Under 20 feet), Mid-size Boats (20-30 feet), and Large Boats (Over 30 feet) |
| Distribution Channel | Marine Dealerships, Specialty Trailer Retailers, and Online Direct Sales |
| Countries Covered | United States, Canada, Mexico, Brazil, Argentina |
| Key Companies Profiled | Load Rite Trailers Inc., Karavan Trailers, Magic Tilt Trailers, EZ Loader, Magnum Trailers Inc., Triton Trailers, Shoreland'r Trailers, Continental Trailers, Venture Trailers, Yacht Club Trailers |
| Additional Attributes | Dollar sales by material type, product type, and distribution channel, regional demand trends across United States, Canada, and Mexico, competitive landscape with established manufacturers and emerging suppliers, buyer preferences for aluminum versus steel construction materials, integration with advanced braking and suspension technologies, innovations in lightweight frame engineering and corrosion-resistant coatings, and adoption of LED lighting systems with standardized electrical connections for enhanced towing safety and regulatory compliance. |
The global north america boat trailer market is estimated to be valued at USD 857.1 million in 2025.
The market size for the north america boat trailer market is projected to reach USD 1,478.0 million by 2035.
The north america boat trailer market is expected to grow at a 5.6% CAGR between 2025 and 2035.
The key product types in north america boat trailer market are aluminum trailers, galvanized steel and painted steel.
In terms of product type, bunk trailers segment to command 58.0% share in the north america boat trailer market in 2025.


Full Research Suite comprises of:
Market outlook & trends analysis
Interviews & case studies
Strategic recommendations
Vendor profiles & capabilities analysis
5-year forecasts
8 regions and 60+ country-level data splits
Market segment data splits
12 months of continuous data updates
DELIVERED AS:
PDF EXCEL ONLINE
Northern Blotting Market Size and Share Forecast Outlook 2025 to 2035
Northern Europe Calcium Sulphate Market Size and Share Forecast Outlook 2025 to 2035
North America Cryogenic Label Printer Market Size and Share Forecast Outlook 2025 to 2035
North America Chitosan Market Size and Share Forecast Outlook 2025 to 2035
North America Underground Mining Vehicle Market Size and Share Forecast Outlook 2025 to 2035
North America Bulk Aseptic Packaging Market Size and Share Forecast Outlook 2025 to 2035
North America Licorice Extract Market Size and Share Forecast Outlook 2025 to 2035
North America Par Baked Bread Market Size and Share Forecast Outlook 2025 to 2035
North America Silo Bags Market Size and Share Forecast Outlook 2025 to 2035
North America Fresh Meat Packaging Market Size and Share Forecast Outlook 2025 to 2035
North America Ceramic Barbeque Grill Market Size and Share Forecast Outlook 2025 to 2035
North America Temperature Sensor Market Size and Share Forecast Outlook 2025 to 2035
North American Dietary Supplements Market Size and Share Forecast Outlook 2025 to 2035
North America Head-up Display Market Size and Share Forecast Outlook 2025 to 2035
North America, Europe & Asia Pacific Legal Cannabis Market Size and Share Forecast Outlook 2025 to 2035
North America Ceiling Cassette Market Size and Share Forecast Outlook 2025 to 2035
North America Pressure Regulating Valves Market Size and Share Forecast Outlook 2025 to 2035
North America Flame Retardant Thermoplastics Market Size and Share Forecast Outlook 2025 to 2035
Fire Pit Market Analysis in North America - Growth, Trends and Forecast from 2025 to 2035
North America Electrical Testing Services Market - Growth & Demand 2025 to 2035

Thank you!
You will receive an email from our Business Development Manager. Please be sure to check your SPAM/JUNK folder too.
Chat With
MaRIA