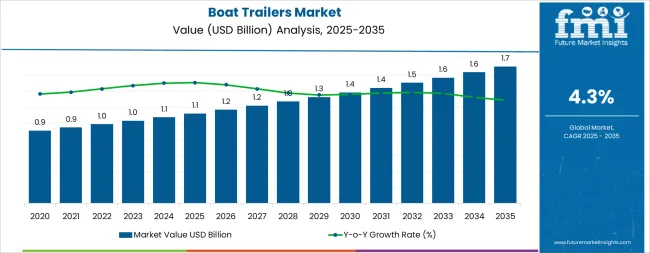
The boat trailers market is projected to grow steadily over the next decade, increasing from USD 1.1 billion in 2025 to USD 1.70 billion in 2035. Growth contribution is expected to come from several factors, including rising recreational boating activities, increased marine tourism, and expanding ownership of small and mid-sized boats. Manufacturers are likely to focus on lightweight materials, corrosion-resistant coatings, and innovative designs that simplify towing and storage, which will drive consumer adoption. Both private buyers and commercial operators are anticipated to contribute to overall market expansion, creating a balanced growth pattern across segments.
Between 2025 and 2030, growth contribution is expected to be driven primarily by replacement demand and gradual adoption in regions with established boating activities. Manufacturers introducing enhanced features, such as adjustable trailers, improved suspension, and integrated safety mechanisms, are likely to capture incremental market share. From 2030 to 2035, additional contributions may come from emerging markets and increasing recreational boat sales, reflecting broader acceptance and investment in boating infrastructure. The growth contribution index suggests a consistent upward trend, with multiple factors working together to support market expansion. The trajectory indicates stable long-term growth, driven by innovation, rising consumer interest, and increased participation in boating activities, creating reliable opportunities for manufacturers and suppliers globally.
The boat trailers market primarily derives from two main parent markets: Original Equipment Manufacturers (OEMs) and the aftermarket sector. OEMs hold a significant share, accounting for approximately 63% of total boat trailer sales. This dominance is driven by established partnerships with boat manufacturers, ensuring a steady demand for trailers during the production of new boats. The aftermarket segment, comprising about 37% of the market, caters to consumers seeking replacement trailers, upgrades, and customization options for their existing boats. This sector's growth is fueled by the increasing popularity of recreational boating and the rising number of boat ownerships.
Recent trends in the boat trailers market indicate a shift towards lightweight and corrosion-resistant materials. Aluminum trailers are gaining popularity due to their durability and resistance to rust, making them ideal for marine environments. The advancements in trailer design have LED to the development of models that offer better fuel efficiency and easier maneuverability. The integration of smart technologies, such as GPS tracking and automated braking systems, is also on the rise, enhancing safety and convenience for users. These innovations reflect the industry's commitment to meeting the evolving needs of boat owners and improving the overall boating experience.
| Metric | Value |
|---|---|
| Market Value (2025) | USD 1.1 billion |
| Market Forecast (2035) | USD 1.70 billion |
| Growth Rate | 4.3% CAGR |
| Leading Material Type | Aluminum Trailers |
| Primary Product Type | Bunk Trailers |
The market demonstrates strong fundamentals with Aluminum Trailers capturing a dominant share through advanced lightweight features and corrosion-resistant capabilities. Bunk Trailer applications drive primary demand, supported by increasing boat owner spending on durable transportation tools and marine equipment enhancement systems. Geographic expansion remains concentrated in coastal markets with established recreational boating infrastructure, while emerging economies show accelerating adoption rates driven by marine tourism and rising disposable income levels.
Market expansion rests on three fundamental shifts driving adoption across the recreational boating and marine transportation sectors.
1. Recreational boating demand creates compelling advantages through lightweight trailers that provide efficient towing without vehicle strain risks, enabling boat owners to transport watercraft while achieving fuel efficiency and reducing operational costs.
2. Marine tourism acceleration occurs as coastal regions worldwide seek advanced trailer systems that complement traditional boat launching methods, enabling precise vessel transportation and storage applications that align with safety standards and convenience requirements.
3. Material innovation advancement drives adoption from boat owners and marine operators requiring effective transportation tools that minimize corrosion damage while maintaining structural integrity during coastal and saltwater exposure procedures.
The growth faces headwinds from seasonal demand fluctuations that vary across regions regarding the deployment of boat trailers and recreational boating patterns, which may limit sales consistency in certain geographic markets. Regulatory compliance challenges also persist regarding safety certifications and load capacity standards that may reduce market penetration with varying international requirements or non-standardized regulations that limit product distribution capabilities.
The boat trailers market represents a transformative growth opportunity, expanding from USD 1.1 billion in 2025 to USD 1.70 billion by 2035 at a 4.3% CAGR. As recreational boating activities worldwide prioritize convenience, safety, and equipment durability, boat trailers have evolved from basic transportation equipment to essential marine accessories, enabling efficient vessel transport, reducing launching time, and supporting boating excellence across personal watercraft, fishing boats, and yacht applications.
The convergence of marine tourism growth, increasing boat ownership rates, material technology maturation, and regulatory acceptance of lightweight materials creates unprecedented adoption momentum. Advanced aluminum trailers offering superior corrosion resistance, seamless boat compatibility, and regulatory compliance will capture premium market positioning, while geographic expansion into emerging coastal markets and scalable production deployment will drive volume leadership. Government recreational infrastructure programs and marine safety standardization provide structural support.
Primary Classification: The market segments by material type into Aluminum Trailers and Galvanized Steel Trailers categories, representing the evolution from traditional steel solutions to lightweight corrosion-resistant systems for comprehensive marine transportation coverage.
Secondary Breakdown: Product type segmentation divides the market into Bunk Trailers, Roller Trailers, and Hybrid Trailers sectors, reflecting distinct requirements for hull support, launching convenience, and versatile boat compatibility applications.
Tertiary Classification: Load capacity segmentation includes Up to 1,500 kg, 1,500-3,000 kg, 3,000-4,500 kg, and Above 4,500 kg categories, addressing diverse boat sizes from personal watercraft to large yachts requiring specialized towing capabilities.
Regional Classification: Geographic distribution covers North America, Europe, Asia Pacific, Latin America, and the Middle East & Africa, with coastal markets leading adoption while inland lake regions show accelerating growth patterns driven by recreational boating expansion.
The segmentation structure reveals technology progression from traditional steel trailers toward integrated lightweight platforms with enhanced durability and smart features, while product diversity spans from simple bunk designs to comprehensive modular solutions requiring precise boat-specific customization.
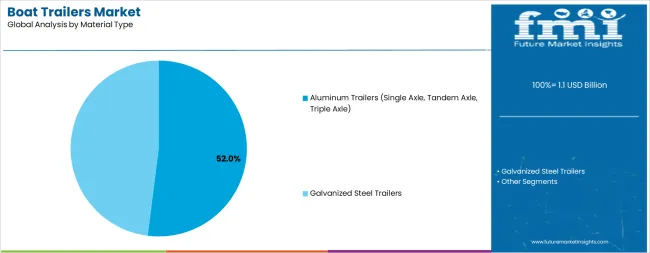
Market Position: Aluminum Trailers command the leading position in the Boat Trailers market with approximately 52% market share through advanced material properties, including exceptional corrosion resistance, reduced weight, and improved fuel efficiency that enable boat owners to deploy trailers across saltwater and freshwater environments without significant maintenance modifications.
Value Drivers: The segment benefits from boat owner preference for long-lasting trailer systems that provide reliable performance without requiring extensive rust prevention protocols or frequent replacement cycles. Aluminum material design features enable deployment across coastal regions, marina facilities, and high-salinity operations where durability and weight reduction represent critical purchasing requirements.
Competitive Advantages: Aluminum trailers differentiate through established corrosion immunity, proven lightweight benefits, and integration with modern towing vehicles that enhance fuel economy while maintaining cost-effective ownership profiles suitable for recreational boaters of all experience levels.
Key market characteristics:
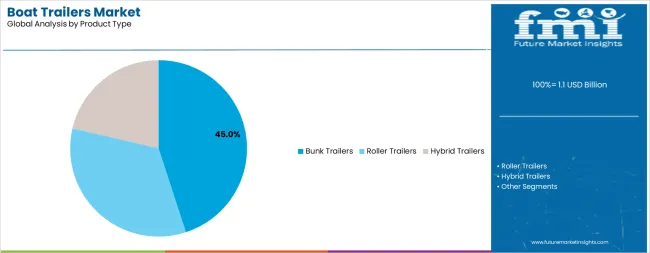
Market Context: Bunk Trailers applications dominate the Boat Trailers market with approximately 45% market share due to widespread adoption across recreational boating segments and increasing focus on hull protection, ease of use, and versatile boat compatibility applications that optimize vessel support while maintaining loading effectiveness.
Appeal Factors: Bunk trailer customers prioritize system reliability, hull support quality, and compatibility with diverse boat designs that enables coordinated transportation across multiple watercraft types and launching conditions. The segment benefits from substantial recreational boating participation and equipment upgrade cycles that emphasize reliable support systems for improved boat protection and operational convenience.
Growth Drivers: Recreational boating expansion programs incorporate bunk trailers as standard equipment for personal watercraft and fishing boat applications. At the same time, increasing boat protection awareness is driving demand for carpeted bunk systems that maintain hull integrity requirements and minimize surface damage during transport.
Market Challenges: Initial investment costs and customization requirements may limit system adoption in budget-constrained boating segments or standardized rental fleets.
Application dynamics include:
Growth Accelerators: Recreational boating expansion drives primary adoption as trailers provide transportation capabilities that enable convenient boat mobility without marina storage dependency risks, supporting boat ownership decisions and outdoor recreation missions that require efficient vessel management. The demand for corrosion-resistant materials accelerates market expansion as boat owners seek effective equipment that minimizes maintenance costs while maintaining structural effectiveness during coastal exposure procedures and saltwater launching scenarios. Marine tourism spending increases worldwide, creating sustained demand for durable trailer systems that complement boat ownership and provide transportation flexibility in diverse aquatic environments.
Growth Inhibitors: Seasonal demand patterns vary across regions regarding the deployment of boat trailers and recreational boating cycles, which may limit sales consistency and market penetration in areas with short boating seasons. Regulatory compliance complexity persists regarding safety certifications and load capacity standards that may reduce market accessibility with international variations, non-standardized testing requirements, or complex approval workflows that limit distribution capabilities. Price sensitivity across budget-conscious boat owner segments creates competitive pressure between aluminum premium offerings and cost-effective galvanized steel alternatives.
Market Evolution Patterns: Adoption accelerates in coastal regions and lakeside communities where recreational boating justifies trailer investments, with geographic concentration in North American and European markets transitioning toward mainstream adoption in Asia Pacific driven by marine tourism and rising disposable incomes. Technology development focuses on enhanced material durability, improved IoT integration, and compatibility with electric vehicles that optimize towing efficiency and environmental sustainability. The market could face disruption if electric-assist braking systems or autonomous launching technologies significantly alter traditional trailer deployment paradigms in recreational or commercial marine applications.
The boat trailers market demonstrates varied regional dynamics with Growth Leaders including South Korea (4.5% CAGR) and the United States (4.4% CAGR) driving expansion through recreational boating growth and coastal infrastructure development. Steady Performers encompass the European Union (4.3% CAGR) and the United Kingdom (4.2% CAGR), benefiting from established marine leisure industries and advanced trailer technology adoption. Emerging Markets feature Japan (4.1% CAGR), where specialized recreational applications and quality preferences support consistent growth patterns.
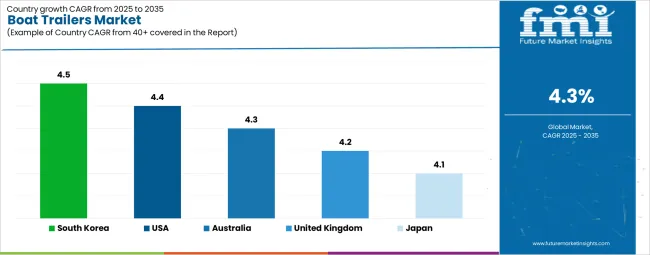
| Country | CAGR (2025-2035) |
|---|---|
| South Korea | 4.5% |
| United States | 4.4% |
| Australia | 4.3% |
| United Kingdom | 4.2% |
| Japan | 4.1% |
Regional synthesis reveals North American markets leading through recreational boating culture and extensive coastal access, while European countries maintain steady expansion supported by marine tourism advancement and environmental regulations. Asia Pacific markets show accelerating growth driven by rising disposable incomes and government recreational infrastructure initiatives.
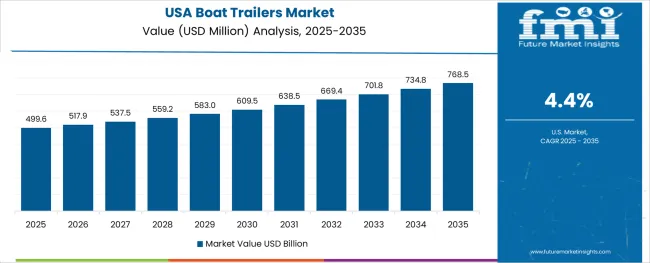
The United States leads global boat trailer adoption and expansion, projected to grow at a steady 4.4% CAGR through 2035, supported by one of the world’s most vibrant recreational boating cultures. With extensive coastal access, large inland waterways, and strong consumer interest in marine activities, the USA market benefits from high boat ownership density across Florida, California, Texas, and Great Lakes states. Aluminum trailers with enhanced corrosion resistance dominate the market, reflecting consumer needs for durability in both saltwater and freshwater conditions. Innovation plays a central role, with American manufacturers integrating next-generation features such as LED lighting, hydraulic disc brakes, GPS-enabled security, and lightweight aluminum frames designed for easy towing.
Distribution channels are broad, including marine retailers, boat dealerships, aftermarket specialty suppliers, and well-developed e-commerce platforms that increase accessibility across consumer segments. Financing programs for marine leisure equipment also sustain steady adoption among mid-income groups. Notably, the DIY and aftermarket customization segment is gaining traction, as boaters increasingly tailor trailers to specific vessel requirements. Beyond the domestic market, export demand for premium American-made trailers is expanding in Europe and Asia, strengthening the USA position as a global innovation hub. Coastal communities alone account for nearly two-thirds of USA trailer ownership, highlighting the dominance of marine lifestyles in shaping adoption trends.
South Korea represents one of the highest-growth markets for boat trailers, with a projected CAGR of 4.5% through 2035 driven by rising lifestyle diversification and increasing popularity of outdoor recreational activities. Coastal regions such as Busan, Jeju, and the Seoul metropolitan waterfront are witnessing strong adoption of advanced aluminum trailers due to their durability, saltwater resistance, and ease of towing in compact urban settings. This expansion is strongly supported by government coastal development programs and marine tourism initiatives, which aim to encourage both domestic boating culture and international visitor access. Growth is further influenced by South Korea’s increasing middle-class participation in recreational boating and fishing communities that require reliable transport solutions for vessels of varying sizes.
Trailer manufacturers are aligning innovations with consumer demand for lightweight, efficient, and smart-featured equipment, drawing from South Korea’s broader technological ecosystem and leading automotive accessory standards. As fishing and waterfront leisure become more integrated into Korean lifestyles, the boat trailers market benefits from a balance of personal boat ownership and community-driven boating facilities. Local companies continue to collaborate with global manufacturers for technology transfer, ensuring greater access to high-quality products. Altogether, these factors position South Korea as a resilient high-growth market in the Asia Pacific marine leisure sector.
Australia records a projected CAGR of 4.3% through 2035, supported by its expansive coastline, strong maritime traditions, and high per-capita boat ownership rates. Recreational boating plays a central role in Australian lifestyles, particularly in regions like Queensland, New South Wales, and Western Australia, where waterways and marine tourism are integral to both domestic leisure and international visitor activity. Aluminum boat trailers dominate sales due to their superior corrosion resistance, essential for saltwater applications across Australia’s extensive coastal areas. Consumer adoption is driven by increasing demand for family boating, fishing, and marine sport activities, alongside government initiatives that develop coastal infrastructure, marina systems, and ramp facilities to expand access to recreational boating.
Manufacturers emphasize lightweight construction, road compliance, and long-haul durability to suit Australia’s vast transport distances. Distribution networks are well established through boating retailers, online platforms, and marine dealerships, with emerging opportunities in the rental and shared-usage segment fueled by marine tourism operators. The Australian market also leverages innovation in trailer safety standards, braking systems, and aftermarket upgrades, demonstrating clear alignment with road safety regulations. Collectively, these factors sustain Australia as a steady-growth, developed recreational market in the Asia Pacific region, complementing USA leadership and South Korea’s high-growth trajectory.
The United Kingdom boat trailer market is forecast to grow at a 4.2% CAGR through 2035, benefiting from the country’s deep-rooted maritime heritage, rising marine leisure participation, and strong sailing community-based networks. UK consumers value trailers designed for enhanced safety compliance, reflecting national road regulations and the operational complexities of tidal launches in coastal zones. Aluminum trailers dominate due to their durability, corrosion resistance, and relatively low maintenance requirements, making them well-suited to saltwater environments in England, Scotland, and Wales.
Sailing clubs, fishing groups, and community marine organizations play a pivotal role in trailer adoption, often facilitating equipment sharing and introducing recreational boaters to premium-quality solutions. Coastal caravan and holiday parks are also emerging as growth catalysts by integrating boat storage and trailer parking facilities, adding convenience for traveling boat owners. Regulatory standards shape purchasing preferences, as demand focuses on high-quality, certified trailers equipped with advanced braking systems and safety features. The UK remains a steady marine hub with vibrant boat shows, sailing events, and heritage programs that reinforce the importance of recreational boating infrastructure. These cultural, recreational, and regulatory drivers combine to create a sustained market, where specialized des
Strategic Market Indicators:
Japan demonstrates stable but quality-driven growth in the boat trailer market, registering a projected CAGR of 4.1% through 2035. Consumer demand is shaped by the nation’s preference for precision-engineered, long-lasting, and compact solutions tailored to its specific boating culture. Trailers are widely used in recreational fishing, small-scale leisure boating, and specialized marine applications, reflecting the prominence of coastal communities and inland waterways. Japanese boat owners prioritize trailers that integrate seamlessly with compact vehicles, reinforcing the need for lightweight and efficient aluminum frames coupled with precision welding and corrosion-resistant finishes.
The market also benefits from Japan’s adoption of advanced manufacturing standards inherited from its larger automotive industry, ensuring products meet high expectations for safety and performance. Demand is concentrated across regions like Kansai, Kanto, and coastal prefectures where recreational fishing plays a cultural and economic role. Importantly, Japanese manufacturers focus on niche quality rather than volume, producing technologically sophisticated trailers that appeal to premium consumers and export markets seeking Japanese design excellence. While growth remains modest compared to other high-growth Asia Pacific markets, Japan’s trailer industry positions itself as a benchmark of reliability, innovation, and functionality, ensuring steady expansion supported by discerning domestic demand and technological leadership.
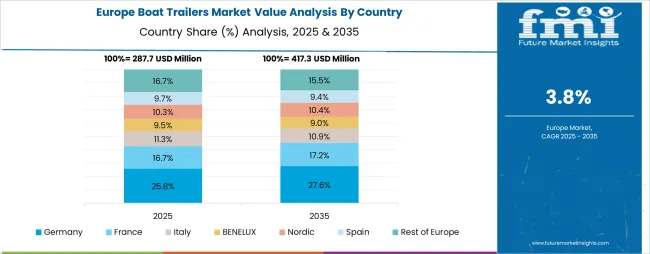
The Europe boat trailers market is projected to grow from USD 820 million in 2025 to USD 1.26 billion by 2035, registering a CAGR of 4.3% over the forecast period. Germany is expected to lead the regional market with a 27.0% share in 2025, slightly declining to 26.5% by 2035, supported by its extensive sailing culture, inland waterways, and advanced trailer engineering capabilities aligned with EU transport safety and environmental regulations. The United Kingdom follows with a 22.0% share in 2025, projected to maintain 22.0% by 2035, benefitting from a vibrant recreational boating community, strong adoption of aluminum trailers, and established compliance-driven road standards. France holds a 16.0% share in 2025, rising modestly to 16.2% by 2035, driven by its coastal tourism sector along the Mediterranean and Atlantic coasts, as well as robust participation in sailing and fishing activities.
Italy commands a 12.0% share in 2025, expected to rise to 12.3% by 2035, supported by a strong Mediterranean leisure boating tradition and increasing focus on marina and ramp infrastructure. Spain contributes a 9.0% share in 2025, climbing to 9.2% by 2035, with marine tourism along coastal areas driving fleet and rental trailer adoption. The Netherlands maintains a 6.0% share in 2025, edging up to 6.2% by 2035, supported by its strong waterway-linked leisure culture and technological adoption. The Rest of Europe region, including Nordic countries, Poland, Belgium, and Eastern European markets, collectively accounts for 8.0% in 2025, declining slightly to 7.6% by 2035 as mature Western European boating hubs continue to dominate, although growing interest in recreational boating and stricter environmental policies in Nordic nations sustain regional demand momentum
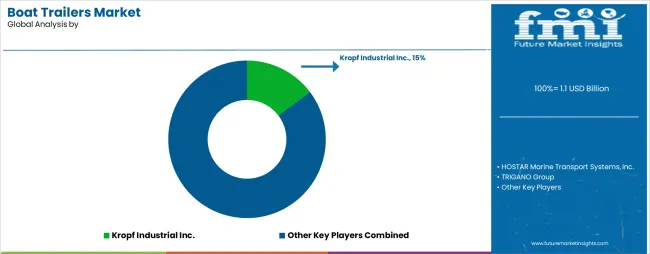
The boat trailers market operates with moderate concentration, featuring approximately 25-30 meaningful participants, where leading companies control roughly 48-55% of the global market share through established marine equipment relationships and comprehensive trailer portfolios. Competition emphasizes material quality, durability, and compatibility with diverse boat types rather than price-based rivalry.
Market Leaders encompass Kropf Industrial Inc., HOSTAR Marine Transport Systems, TRIGANO Group, EZ Loader, and TRACKER, which maintain competitive advantages through extensive marine industry expertise, global distribution networks, and comprehensive customization capabilities that create customer brand loyalty and support premium pricing. These companies leverage decades of trailer manufacturing experience and ongoing material innovation to develop advanced aluminum and galvanized steel trailers with superior corrosion resistance and load management features.
Technology Challengers include Load Rite, Karavan Trailers, Hydrotrans, and Midwest Industries Inc., which compete through specialized boat trailer focus and innovative design features that appeal to recreational boaters seeking advanced customization and performance optimization. These companies differentiate through rapid product development cycles and specialized application focus.
Regional Specialists feature companies like Balbi Rimorchi srl, which focus on specific geographic markets and specialized applications, including yacht transport systems and custom marine equipment platforms. Market dynamics favor participants that combine reliable construction with advanced features, including adjustable bunks, LED lighting systems, and disc brake technology. Competitive pressure intensifies as traditional marine equipment suppliers expand into trailer manufacturing. At the same time, specialized companies challenge established players through innovative lightweight designs and smart technology integration targeting premium recreational segments.
| Item | Value |
|---|---|
| Quantitative Units | USD 1.1 billion |
| Material Type | Aluminum Trailers, Galvanized Steel Trailers |
| Product Type | Bunk Trailers, Roller Trailers, Hybrid Trailers |
| Load Capacity | Up to 1,500 kg, 1,500-3,000 kg, 3,000-4,500 kg, Above 4,500 kg |
| Regions Covered | North America, Europe, Asia Pacific, Latin America, Middle East & Africa |
| Countries Covered | United States, United Kingdom, Japan, South Korea, European Union countries, and 20+ additional countries |
| Key Companies Profiled | Kropf Industrial Inc., HOSTAR Marine Transport Systems, TRIGANO Group, Hydrotrans, Balbi Rimorchi srl, EZ Loader, Midwest Industries Inc., TRACKER, Load Rite, Karavan Trailers |
| Additional Attributes | Dollar sales by material type and product categories, regional adoption trends across North America, Europe, and Asia Pacific, competitive landscape with marine equipment providers and trailer specialists, boat owner preferences for corrosion resistance and lightweight construction, integration with modern towing vehicles and IoT tracking systems, innovations in aluminum alloys and galvanization processes, and development of advanced solutions with enhanced load capacity and smart monitoring capabilities. |
The global boat trailers market is estimated to be valued at USD 1.1 billion in 2025.
The market size for the boat trailers market is projected to reach USD 1.7 billion by 2035.
The boat trailers market is expected to grow at a 4.3% CAGR between 2025 and 2035.
The key product types in boat trailers market are aluminum trailers (single axle, tandem axle, triple axle) and galvanized steel trailers.
In terms of product type, bunk trailers segment to command 45.0% share in the boat trailers market in 2025.


Full Research Suite comprises of:
Market outlook & trends analysis
Interviews & case studies
Strategic recommendations
Vendor profiles & capabilities analysis
5-year forecasts
8 regions and 60+ country-level data splits
Market segment data splits
12 months of continuous data updates
DELIVERED AS:
PDF EXCEL ONLINE
Boat Wiring Harness Market Size and Share Forecast Outlook 2025 to 2035
Boat Steering Wheels Market Size and Share Forecast Outlook 2025 to 2035
Boat Trolling Motor Market Size and Share Forecast Outlook 2025 to 2035
Boat Control Lever Market Growth - Trends & Forecast 2025 to 2035
Boat Rental Market Analysis by Growth, Trends and Forecast from 2025 to 2035
Boat Hook Market Growth - Trends & Forecast 2024 to 2034
Boat Console Market
Airboats Market
Sailboat Market Size and Share Forecast Outlook 2025 to 2035
Crew boats (Standby Crew Vessels) Market
Small Boats Market Size and Share Forecast Outlook 2025 to 2035
Japan Boat Trailer Market Growth – Trends & Forecast 2024-2034
Korea Boat Trailer Market Growth – Trends & Forecast 2024-2034
Hybrid Boat Market Size and Share Forecast Outlook 2025 to 2035
Rescue Boats Market Analysis - Size, Share, and Forecast 2025 to 2035
Rowing Boats Market
Trawler Boat Market Size and Share Forecast Outlook 2025 to 2035
Leisure Boat Market Growth – Trends & Forecast 2024 to 2034
Electric Boat Market Size and Share Forecast Outlook 2025 to 2035
Carbon Fiber Boat Hulls Market Size and Share Forecast Outlook 2025 to 2035

Thank you!
You will receive an email from our Business Development Manager. Please be sure to check your SPAM/JUNK folder too.
Chat With
MaRIA