

- Market Size (2026)
- USD 1.4 Bn
- Forecast (2036)
- USD 2.0 Bn
- CAGR (2026 to 2036)
- 3.5%
How big is the boat control lever market in 2026?
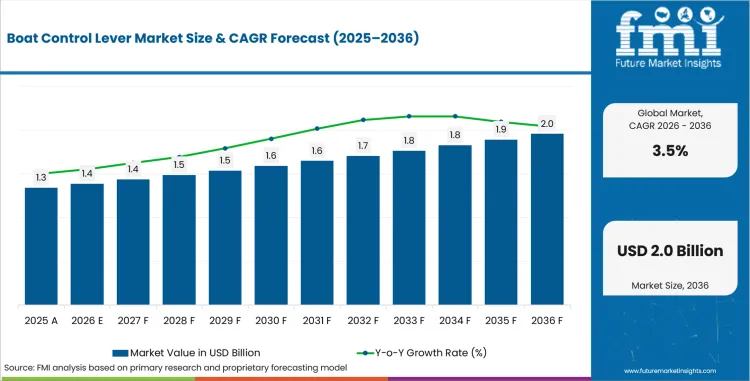
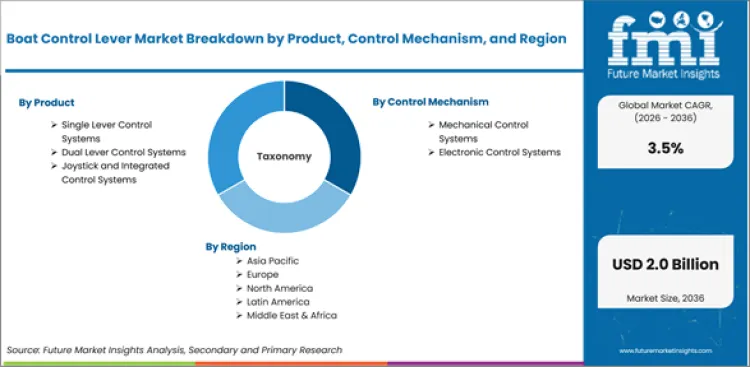
USD 1.4 billion in 2026, reaching USD 2.0 billion by 2036 at a 3.5% CAGR
Key Takeaways, Market Size, and Forecast
- Boat Control Lever Market Value (2025): USD 1.4 Bn
- Boat Control Lever Market Forecast Value (2036): USD 2.0 Bn
- Boat Control Lever Market CAGR (2026 TO 2036): 3.5%
- Boat Control Lever Market Leading Product Segment: Single Lever Control Systems (50.0%)
- Boat Control Lever Market Key Growth Regions: South Korea, USA, EU, UK, Japan
- Boat Control Lever Market Key Players: Glendinning Products, LLC, Lewmar Limited, Vetus B.V., Morse Controls, ZF Friedrichshafen AG
The boat control lever market was valued at USD 1.3 billion in 2025. The market is set to reach USD 1.4 billion by 2026-end and grow at a CAGR of 3.5% between 2026-2036 to reach USD 2.0 billion by 2036. Single Lever Control Systems will dominate with a 50.0% share, while Mechanical Control Systems will lead with a 55.0% share.
| Parameter | Details |
|---|---|
| Market Size in 2026 (Value) | USD 1.4 Billion |
| Market Forecast in 2036 (Value) | USD 2.0 Billion |
| CAGR (2026 to 2036) | 3.5% |
| Years Considered | 2021 to 2036 |
| Base Year | 2025 |
| Forecast Period | 2026 to 2036 |
| Units Considered | Value (USD Billion) |
| Leading Sub-Region | USA |
Summary of the Boat Control Lever Market
- Demand and Growth Drivers
- Sustained recreational boating activity and commercial vessel fleet maintenance create baseline demand for boat control lever systems across OEM and aftermarket channels.
- Transition from mechanical to electronic control systems is creating upgrade and replacement demand as boat owners seek improved precision and reliability.
- Growing adoption of joystick and integrated control systems for docking and maneuvering is creating a higher-value product segment within the boat control market.
- Product and Segment View
- Single lever control systems account for 50.0% of product share, serving as the standard throttle and shift control for outboard and sterndrive powered recreational boats.
- Mechanical control systems hold 55.0% of control mechanism share, reflecting the large installed base of mechanically actuated throttle and shift cables across the recreational boat fleet.
- Recreational boats hold 50.0% of vessel type share, as the private leisure boat segment represents the largest single market for boat control lever procurement.
- Geography and Competitive Outlook
- South Korea leads at 3.5% CAGR, reflecting shipbuilding industry activity and marine equipment manufacturing that serves both domestic and export vessel markets.
- North America maintains the largest market, anchored by the recreational boating industry and established marine equipment aftermarket distribution.
- Companies with broad control system portfolios spanning mechanical, electronic, and integrated platforms are positioned to serve both OEM and retrofit demand.
- Analyst Opinion
- Nikhil Kaitwade, Principal Consultant at FMI says, 'Marine control system manufacturers that can deliver electronic integration with established mechanical reliability are likely to capture the growing upgrade and replacement market from recreational and commercial boat operators over the forecast period.'
- The boat control lever market is transitioning from purely mechanical systems toward electronic and integrated control platforms that offer improved precision and additional functionality.
- Adoption of electronic throttle and shift control is increasing as marine engine manufacturers incorporate drive-by-wire technology into outboard and sterndrive power systems.
- Demand is supported by the large installed base of recreational boats requiring periodic control system maintenance, cable replacement, and component upgrades.
- Growth is attributable to joystick docking system adoption that creates demand for integrated control platforms connecting throttle, shift, and steering functions.
What is a boat control lever and what does the market cover?
Throttle and shift control systems for managing marine propulsion on recreational, commercial and military craft
The boat control lever market encompasses throttle and shift control systems used to manage marine propulsion on recreational boats, commercial vessels, and military craft. Products include single lever, dual lever, and joystick/integrated control systems using mechanical or electronic actuation with side mount and top mount configurations.
What is included in the boat control lever market scope?
Single lever, dual lever and joystick/integrated control systems with mechanical or electronic actuation, 2026 to 2036.
Market scope covers all commercially traded boat control lever products categorized by product (single lever control systems, dual lever control systems, joystick and integrated control systems), control mechanism (mechanical control systems, electronic control systems), vessel type (recreational boats, commercial vessels, defense and military vessels), application (navigation and maneuvering, propulsion control, safety and monitoring), end use (OEM installations, aftermarket), mounting type (side mount controls, top mount controls), and technology (conventional control systems, assisted control technology, advanced integrated technology). Revenue is tracked from 2026 to 2036.
What is excluded from the boat control lever market scope?
Marine steering systems, engine throttle bodies, and vessel navigation electronics
The scope does not include marine steering systems (helm and hydraulic steering), marine engine throttle bodies, or vessel navigation electronics.
How was the boat control lever market research conducted?
Primary interviews, desk research, bottom-up sizing, and quarterly validation
- Desk Research: Data was collected from databases of the recreation boating industry, trade statistics of marine equipment and the revenue disclosures of manufacturers.
- Market Sizing and Forecasting: Bottom up analysis of control system sales by product type, vessel category and geographic markets including forecast of new boat production and aftermarket.
- Data Validation: Quarterly with boat production data, marine equipment distribution sales and manufacturer shipment data.
Why is the boat control lever market growing?
Rising recreational boating and commercial vessel demand and drive-by-wire adoption
- Recreational boating activity and commercial vessel operations create ongoing demand for boat control lever systems via OEM installation and aftermarket replacement channels.
- The adoption of electronic control systems is increasing as drive-by-wire technology becomes a standard feature on new marine engines, and this is driving upgrade demand from the existing mechanical control installed base.
- South Korea is expected to have the highest CAGR of 3.5%, owing to the activity of shipbuilding and the manufacturing of marine equipment for domestic vessel production and the global export market.
Demand for boat control levers is driven by the number of new boat production, the need to maintain and upgrade the large existing recreational boat fleet, and the operations of the commercial vessel fleet. Single lever control systems account for 50.0% of product share as they offer the standard single hand throttle and shift actuation found on most outboard and sterndrive powered recreational boats. Mechanical control systems account for 55.0% of control mechanism share, reflecting the large installed base of cable-actuated controls on the world recreational boat fleet.
Recreational boats make up 50.0% of the vessel type share, and throttle and shift control systems are utilized by private leisure boats, including center consoles, bowriders, pontoon boats, and sailboats, to control propulsion. Demand is generated by commercial vessels, such as workboats, fishing vessels and patrol craft, with higher duty cycle and reliability requirements. Specialized control systems for military and defense ships are in accordance with military specification standards.
The market is moving away from mechanical to electronic control as marine engine manufacturers embrace drive-by-wire technology into current generation outboard and sterndrive systems. The electronic controls provide smoother shifting, precise throttle response and integration with joystick docking systems. This transition generates both OEM demand for electronic controls on new builds, and retrofit demand from boat owners upgrading existing mechanical installations.
How is the boat control lever market segmented?
By product, control mechanism, vessel type, application, end use, mounting type and technology
- Single lever controls lead the product share at 50.0%, the standard throttle and shift interface for recreational boats with outboard and sterndrive power.
- Mechanical control systems have a 55.0% share of the control mechanism, which reflects the large installed base of cable-actuated throttle and shift systems in the global boat fleet.
- Vessel type share of recreational boats is 50.0% as private leisure boats are the largest market for boat control system procurement.
Why do single lever control systems lead the boat control lever market?
They hold 50.0% share, led by single-hand controls for recreational powerboats
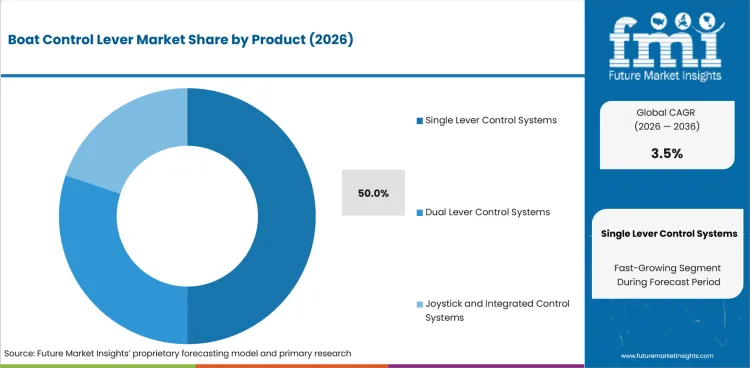
Single Lever Control Systems Captures 50.0% of the Product Share in 2026 These controls combine throttle and shift actuation in a single lever that moves forward for forward gear engagement and throttle advancement and rearward for reverse gear engagement. This is the standard control format for most recreational powerboats because of its convenience of single-hand operation.
Side mount and top mount installation options allow for different helm station configurations on various boat types. Single lever controls are available in mechanical (cable-actuated) and electronic (drive-by-wire) versions. The latter provide better shift quality and can be integrated with engine management systems.
How big is the mechanical control systems segment in the boat control lever market?
About 55.0% share, led by push-pull cable throttle and shift controls
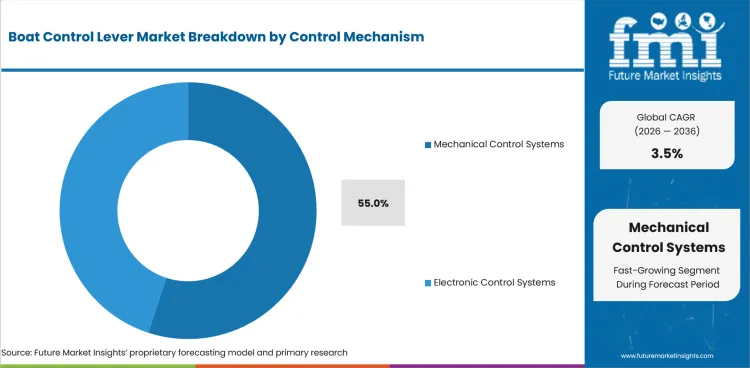
Mechanical Control System will account for 55.0% of control mechanism share in 2026. These systems use push-pull control cables to pass throttle and shift commands from the helm control lever to the engine. Mechanical systems are also simpler and more reliable and less expensive, so they continue to dominate the market, especially on smaller recreational boats and in the aftermarket replacement market.
The increase in share of electronic control systems is taking place as marine engine manufacturers are integrating drive-by-wire actuation into existing outboard and sterndrive models. “Electronic systems do not require cable routing, require less maintenance, and can be integrated with joystick docking and multi-engine synchronization features.” The transition timeline is a proxy for new boat take-up rates and the slow aging of the mechanical control installed base.
What drives and restrains the boat control lever market?
Driven by recreational boating and commercial vessel operations; restrained by the long-lived mechanical installed base
- Recreational boating activity and commercial vessel operations provide baseline control system demand through OEM installation and aftermarket maintenance channels.
- The large installed base of mechanical devices with long service life limits the near-term rate of growth of the pace of transition from mechanical to electronic control.
- The highest value growth segment is the adoption of the joystick and integrated control system, as these premium systems are sold at a considerably higher price point than conventional single lever controls.
The boat control lever market is witnessing moderate growth driven by recreational boating activity, transition to electronic controls, and aftermarket replacement demand. Slow technology transition and mature market dynamics limit growth rates. Adoption of joystick systems and demand for electronic upgrades present higher-value growth avenues.
What drives demand?
Recreational boating participation and new boat sales driving OEM controls
Recreational boating participation and new boat sales volumes that drive OEM control system installation is the demand driver. Consumer confidence, disposable income and coastal lifestyle preferences promoting boat ownership and use in developed markets drive the trends in the recreational marine industry.
What opportunity does electronic actuation create?
Engine builders standardizing electronic throttle and shift actuation
As marine engine builders standardize electronic throttle and shift actuation, growth is driven by the gradual transition from cable-actuated mechanical controls to electronic drive-by-wire systems. This change creates OEM demand for new builds and retrofit opportunities for existing boats upgrading to electronic control platforms.
What opportunity does the joystick segment offer?
Docking and close-quarter maneuvering joysticks as premium differentiators
With docking and close-quarter maneuvering becoming competitive differentiators for boat builders, the demand for joystick and integrated control systems is growing. These systems combine throttle, shift and steering controls into one joystick interface, which commands a premium price and creates the highest value segment of products.
Where is aftermarket demand?
A large installed base of boats generating ongoing replacement demand
The large installed base of recreational and commercial boats creates ongoing aftermarket demand for control cable replacement, lever mechanism service, and control system upgrades. Aftermarket distribution through marine dealers and online retailers serves boat owners maintaining existing vessels.
Analysis of Boat Control Lever Market By Key Countries
Which countries are growing fastest in the boat control lever market?
South Korea 3.5%, USA 3.4%, EU 3.3%, UK 3.2%, Japan 3.1% through 2036
.webp "Top Country Growth Comparison Boat Control Lever Market Cagr (2026 2036)")
| Country | CAGR |
|---|---|
| USA | 3.4% |
| UK | 3.2% |
| EU | 3.3% |
| Japan | 3.1% |
| South Korea | 3.5% |
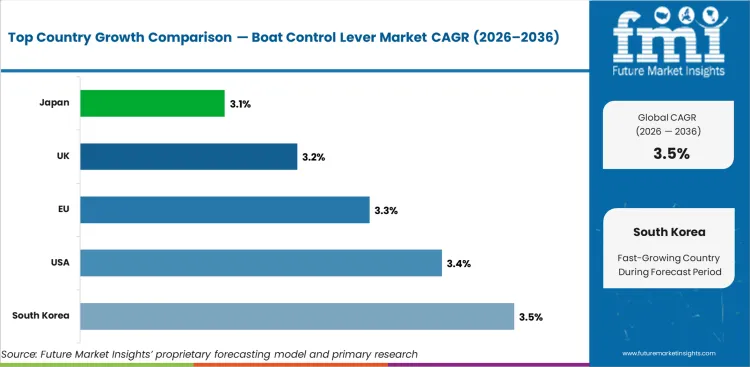
- South Korea leads at 3.5% CAGR, supported by its shipbuilding industry, marine equipment manufacturing ecosystem, and growing adoption of advanced vessel control technologies.
- USA follows at 3.4%, supported by expanding market activity.
- EU (3.3%) and UK (3.2%) sustain growth through established demand.
The global boat control lever market is estimated to grow at 3.5% CAGR from 2026 to 2036. The study covers more than 30 countries, and the key markets are listed below.
How fast is the boat control lever market growing in South Korea?
3.5% CAGR through 2036, the fastest country-level market in the study
South Korea leads at 3.5% CAGR through 2036. Shipbuilding industry activity and marine equipment manufacturing sustain production-oriented demand for control systems.
- Korean shipbuilding industry produces commercial and recreational vessels that incorporate boat control systems from both domestic and international manufacturers.
- Marine equipment manufacturing clusters produce control components that serve vessel production and export supply chains.
- Domestic recreational boating participation is growing, creating incremental consumer-market demand alongside commercial vessel production.
What is the boat control lever market outlook in the United States?
3.4% CAGR, driven by largest recreational boating market globally, combined with established aftermarket
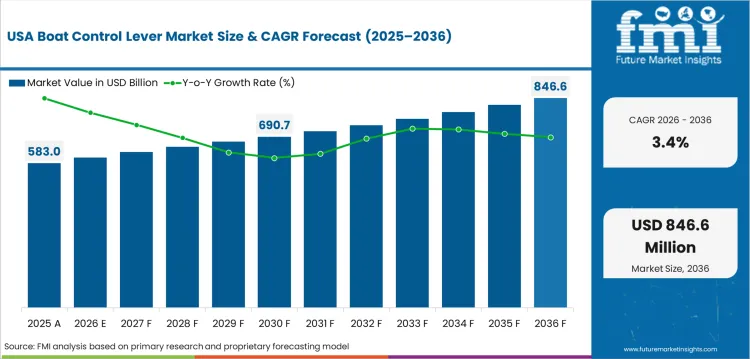
The United States is projected to register 3.4% CAGR through 2036. The largest recreational boating market globally, combined with established aftermarket distribution, sustains control system demand.
- US recreational boating industry produces over 150,000 new powerboats annually, each requiring OEM control system installation.
- Established marine aftermarket distribution through dealers and online retailers serves the large installed recreational boat fleet.
- Drive-by-wire electronic control adoption on Mercury, Yamaha, and Suzuki outboard models is accelerating electronic control system demand on new builds.
What is driving boat control lever growth in the European Union?
3.3% CAGR, driven by Recreational boating in Mediterranean and Scandinavian regions and commercial vessel
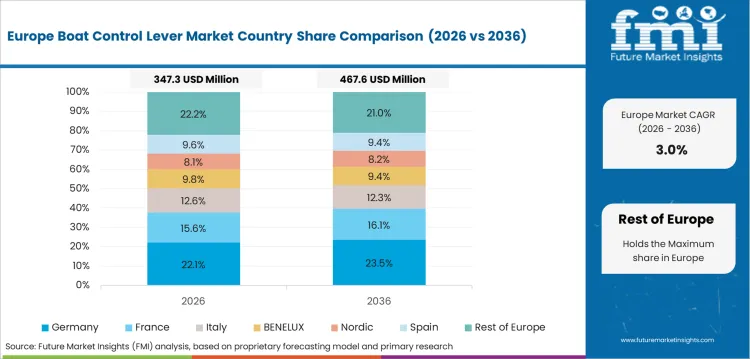
The European Union is projected to register 3.3% CAGR through 2036. Recreational boating in Mediterranean and Scandinavian regions and commercial vessel operations sustain market demand.
- Mediterranean recreational boating in France, Italy, Spain, and Croatia sustains demand for boat control systems across sailing and powerboat categories.
- Scandinavian boating culture with high per-capita boat ownership creates significant control system procurement for both new builds and aftermarket replacement.
- European marine electronics manufacturers including Lewmar and Vetus maintain production of control systems for regional and global distribution.
How is the boat control lever market performing in the United Kingdom?
3.2% CAGR, driven by Coastal recreational boating and commercial vessel operations
The United Kingdom is projected to register 3.2% CAGR through 2036. Coastal recreational boating and commercial vessel operations sustain control system demand.
- UK coastal and inland recreational boating creates consistent demand for boat control systems across powerboat, sailing, and inland waterway vessel categories.
- Commercial fishing and workboat fleet operations generate demand for duty-rated control systems with marine environment durability requirements.
- UK marine equipment distribution through chandleries and online retailers serves aftermarket replacement and upgrade demand.
What is the boat control lever market forecast for Japan?
3.1% CAGR, driven by Recreational fishing boat culture and marine equipment manufacturing
Japan is projected to register 3.1% CAGR through 2036. Recreational fishing boat culture and marine equipment manufacturing sustain control system demand.
- Japanese recreational fishing boat culture sustains consistent demand for outboard-powered vessels equipped with throttle and shift control systems.
- Domestic marine equipment manufacturers produce precision control components that serve Japanese boat production and export markets.
- Yamaha, Suzuki, and Honda marine engine integration with electronic control systems is driving drive-by-wire adoption on Japanese-produced outboard motors.
Who are the leading companies in the boat control lever market?
Glendinning Products, LLC, Lewmar Limited, Vetus B.V., Dometic Marine (SeaStar Solutions), and ZF Friedrichshafen AG
- Glendinning Products leads in the premium electronic control system segment through marine-specific drive-by-wire throttle and shift technology with established OEM and retrofit installation networks.
- Lewmar Limited provides integrated helm control solutions spanning throttle levers, windlasses, and bow thrusters for recreational and commercial marine applications.
- ZF Friedrichshafen AG serves the marine control market through its marine propulsion division, offering integrated electronic and mechanical control systems for commercial and recreational vessels.
- Morse Controls and Vetus maintain strong positions in mechanical cable control systems that serve the large installed base of recreational boats requiring replacement and maintenance parts.
Who are the key players in the boat control lever market?
Glendinning Products, LLC, Lewmar Limited, Vetus B.V., Dometic Marine (SeaStar Solutions) and ZF Friedrichshafen AG, plus regional players
Key global companies leading the boat control lever market include:
- Glendinning Products, LLC (USA), Lewmar Limited (UK), Vetus B.V. (Netherlands), and ZF Friedrichshafen AG (Germany) lead global boat control lever markets through marine-specific engineering expertise, broad product portfolios spanning mechanical and electronic systems, and established OEM and aftermarket distribution channels.
- Morse Controls (USA) holds a strong position through mechanical control cable and lever systems with extensive installed base and aftermarket distribution.
- Additional marine control system manufacturers are developing electronic integration capabilities to address the growing drive-by-wire control market as marine engine technology transitions.
How do top boat control lever companies compare?
Glendinning Products, LLC and Lewmar Limited lead globally; Vetus B.V., Dometic Marine (SeaStar Solutions) and ZF Friedrichshafen AG are regional specialists
| Company | Product Portfolio Breadth | Electronic Integration | Marine OEM Relationships | Geographic Footprint |
|---|---|---|---|---|
| Glendinning Products | High | High | Strong | N. America, Global |
| Lewmar | High | Medium | Moderate | Europe, Global |
| Vetus | Medium | Medium | Moderate | Europe |
| ZF Marine | High | High | Moderate | Global |
| Morse Controls | Medium | Medium | Moderate | N. America |
Source: Future Market Insights competitive analysis, 2026.
Key Developments in Boat Control Lever Market
- In 2025, Glendinning Products continued expansion of its Complete Controls™ electronic propulsion platform, including wider deployment of its ProPilot joystick control system for docking and maneuvering applications across recreational and commercial vessels.
- In 2025, Vetus introduced the E-LINE 22 kW electric propulsion platform and expanded its electronic propulsion control ecosystem, including advanced electric propulsion control lever solutions compatible with E-LINE and E-POD systems.
Key Players in the Boat Control Lever Market
Major Global Players
- Glendinning Products, LLC
- Lewmar Limited
- Vetus B.V.
- Dometic Marine (SeaStar Solutions)
- ZF Friedrichshafen AG
- Ultraflex Group
Emerging Players/Startups
- ePropulsion
- Flexball Italiana
- Twin Disc (Marine Controls Division)
What does the boat control lever market report cover?
Boat Control Lever Market - Research Methodology
| Method | Description |
|---|---|
| Primary Research | FMI analysts conducted interviews with manufacturers, distributors, procurement specialists, and end-use operators across USA, UK, and EU to validate demand patterns and pricing structures for Single Lever Control Systems, and Dual Lever Control Systems and related product categories. |
| Desk Research | Combined trade statistics, regulatory filings, industry association data, and manufacturer disclosures to establish baseline parameters for Boat Control Lever across product, control mechanism, vessel, application, end use, mounting, and technology segments. |
| Market Sizing & Forecasting | Bottom-up aggregation across Single Lever Control Systems, Dual Lever Control Systems, and Joystick and Integrated Control Systems product categories and Mechanical Control Systems, and Electronic Control Systems control mechanism segments, triangulated with top-down macro indicators and regional adoption curves. |
| Data Validation | Cross-checked quarterly against production statistics, trade flow data, and manufacturer revenue disclosures for Boat Control Lever products. |
2016 to 2025 history and 2026 to 2036 forecasts across all segments and 30+ countries
| Parameter | Details |
|---|---|
| Market size by 2036 | USD 2.0 Bn |
| Growth rate | 3.5% CAGR (2026 to 2036) |
| Forecast period | 2026 to 2036 |
| Base year value (2025) | USD 1.3 Bn |
| Key Segment Covered | Product, Control Mechanism, Vessel Type, Application, End Use, Mounting Type, Technology |
| Regions covered | North America, Latin America, Eastern Europe, Western Europe, East Asia, South Asia and Pacific, Middle East and Africa |
| Countries covered | USA, UK, EU, Japan, South Korea, 30 plus countries |
| Key companies profiled | Glendinning Products, LLC, Lewmar Limited, Vetus B.V., Morse Controls, ZF Friedrichshafen AG |
| Approach | Hybrid bottom-up and top-down methodology starting with verified transaction data, projecting adoption velocity across segments and regions. |
Market Segmentation Analysis
Boat Control Lever Market Segmented by Product:
- Single Lever Control Systems
- Mechanical Single Lever
- Side Mount Controls
- Top Mount Controls
- Electronic Single Lever
- Fly By Wire Controls
- Digital Throttle Systems
- Mechanical Single Lever
- Dual Lever Control Systems
- Mechanical Dual Lever
- Throttle and Gear Separate
- Twin Engine Control
- Electronic Dual Lever
- Synchronized Engine Control
- Multi Engine Integration
- Mechanical Dual Lever
- Joystick and Integrated Control Systems
- Joystick Control Systems
- Docking Assistance
- Precision Maneuvering
- Integrated Helm Controls
- Touchscreen Integration
- Autopilot Linked Systems
- Joystick Control Systems
Boat Control Lever Market Segmented by Control Mechanism:
- Mechanical Control Systems
- Push Pull Cable Systems
- Single Cable Systems
- Dual Cable Systems
- Hydraulic Assisted Systems
- Heavy Duty Systems
- Commercial Grade Systems
- Push Pull Cable Systems
- Electronic Control Systems
- Fly By Wire Systems
- Digital Signal Control
- Sensor Based Systems
- Smart Control Systems
- Integrated Navigation
- Remote Monitoring
- Fly By Wire Systems
Boat Control Lever Market Segmented by Vessel Type:
- Recreational Boats
- Motorboats
- Fishing Boats
- Personal Boats
- Yachts and Cruisers
- Luxury Yachts
- Leisure Cruisers
- Motorboats
- Commercial Vessels
- Workboats
- Fishing Vessels
- Utility Boats
- Transport Vessels
- Cargo Boats
- Passenger Ferries
- Workboats
- Defense and Military Vessels
- Naval Ships
- Patrol Boats
- Combat Vessels
- Coast Guard Vessels
- Rescue Boats
- Surveillance Boats
- Naval Ships
Boat Control Lever Market Segmented by Application:
- Navigation and Maneuvering
- Docking Operations
- Precision Docking
- Assisted Docking
- Open Water Navigation
- Speed Control
- Directional Control
- Docking Operations
- Propulsion Control
- Throttle Management
- Engine Speed Control
- Fuel Efficiency Control
- Gear Shifting
- Forward Reverse Control
- Neutral Control
- Throttle Management
- Safety and Monitoring
- Emergency Control
- Quick Stop Systems
- Override Controls
- System Monitoring
- Engine Feedback
- Alarm Systems
- Emergency Control
Boat Control Lever Market Segmented by End Use:
- OEM Installations
- Boat Manufacturers
- Factory Installed Systems
- Integrated Helm Systems
- Engine Manufacturers
- Outboard Engines
- Inboard Engines
- Boat Manufacturers
- Aftermarket
- Retrofit Installations
- Upgrade Systems
- Replacement Systems
- Service Providers
- Marine Workshops
- Repair Centers
- Retrofit Installations
Boat Control Lever Market Segmented by Mounting Type:
- Side Mount Controls
- Single Side Mount
- Compact Boats
- Recreational Boats
- Dual Side Mount
- Twin Engine Boats
- Commercial Boats
- Single Side Mount
- Top Mount Controls
- Single Top Mount
- Console Mount
- Dashboard Integration
- Dual Top Mount
- Multi Engine Boats
- Luxury Yachts
- Single Top Mount
Boat Control Lever Market Segmented by Technology:
- Conventional Control Systems
- Manual Operation
- Cable Based Control
- Basic Mechanical Systems
- Manual Operation
- Assisted Control Technology
- Electronic Assistance
- Fly By Wire
- Precision Control
- Electronic Assistance
- Advanced Integrated Technology
- Joystick Integration
- Docking Automation
- Multi Axis Control
- Smart Systems
- Autonomous Features
- Connected Systems
- Joystick Integration
Boat Control Lever Market by Region:
- North America
- USA
- Canada
- Mexico
- Latin America
- Brazil
- Chile
- Rest of Latin America
- Western Europe
- Germany
- UK
- Italy
- Spain
- France
- Nordic
- BENELUX
- Rest of Western Europe
- Eastern Europe
- Russia
- Poland
- Hungary
- Balkan & Baltic
- Rest of Eastern Europe
- East Asia
- China
- Japan
- South Korea
- South Asia and Pacific
- India
- ASEAN
- Australia & New Zealand
- Rest of South Asia and Pacific
- Middle East & Africa
- Kingdom of Saudi Arabia
- Other GCC Countries
- Türkiye
- South Africa
- Other African Union
- Rest of Middle East & Africa
Research Sources and Bibliography
- National Marine Manufacturers Association. (2025). NMMA Recreational Boating Statistical Abstract. NMMA.
- International Council of Marine Industry Associations. (2025). ICOMIA Boating Industry Statistics. ICOMIA.
- American Boat and Yacht Council. (2025). ABYC Standards for Marine Electrical Systems. ABYC.
- International Organization for Standardization. (2025). ISO Standards for Small Craft Systems. ISO.
- USA Coast Guard. (2025). USCG Recreational Boating Statistics Report. USCG.
This bibliography is provided for reader reference.
This Report Answers
- Estimating the size of the boat control lever market and projected revenue from 2026 to 2036.
- Segmentation by product, control mechanism, vessel type, application, end use, mounting type, technology.
- Insights about more than 30 regional markets.
- Analysis of key market dynamics including demand drivers, restraints, and emerging opportunities.
- Assessment of the competitive landscape and strategic positioning of leading companies.
- Identifying investment opportunities across key product segments and geographic markets.
- Supply chain and distribution channel analysis.
- Delivery of data in PDF and Excel formats.
Frequently Asked Questions
How big is the boat control lever market in 2026?
The global boat control lever market is estimated to be valued at USD 1.4 billion in 2026.
What will be the size of the boat control lever market in 2036?
The market size for the boat control lever market is projected to reach USD 2.0 billion by 2036.
How much will the boat control lever market growth be between 2026 and 2036?
The boat control lever market is expected to grow at a 3.5% CAGR between 2026 and 2036.
What are the key products in the boat control lever market?
The key products in the boat control lever market are Single Lever Control Systems, Dual Lever Control Systems and Joystick and Integrated Control Systems.
Which control mechanism segment is expected to contribute a significant share in the boat control lever market in 2026?
In terms of control mechanism, the mechanical control systems segment is expected to command 55.0% share in the boat control lever market in 2026.
Preview the report firsthand - request a free sample
Get SampleGet the brochure for pricing and purchase details.
Get PDFTable of Content
- Key Takeaways
- Market Size and CAGR
- Top Growth Driver
- Fastest Growing Segment
- Leading Region
- Key Companies
- Emerging Opportunities
- Executive Summary
- Global Market Outlook
- Demand-side Trends
- Supply-side Trends
- Technology Roadmap Analysis
- Analysis and Recommendations
- Analyst Perspective (What is happening? Why now? What should investors know?)
- Key Questions Answered
- How large is the market?
- What is the CAGR?
- What are key trends?
- Which region dominates?
- Who are the leaders?
- Market Overview
- Market Coverage / Taxonomy
- Market Definition / Scope / Limitations
- Research Methodology
- Chapter Orientation
- Analytical Lens and Working Hypotheses
- Market Structure, Signals, and Trend Drivers
- Benchmarking and Cross-market Comparability
- Market Sizing, Forecasting, and Opportunity Mapping
- Research Design and Evidence Framework
- Desk Research Programme (Secondary Evidence)
- Expert Input and Fieldwork (Primary Evidence)
- Tooling, Models, and Reference Databases
- Data Engineering and Model Build
- Quality Assurance and Audit Trail
- Market Background
- Market Dynamics (Drivers, Restraints, Opportunity, Trends)
- Scenario Forecast (Optimistic, Likely, Conservative)
- Impact Analysis
- AI Impact
- Sustainability Impact
- Regulatory Impact
- Technology Impact
- Consumer / Buyer Analysis
- Purchase Drivers
- Adoption Barriers
- Buyer Journey
- Opportunity Map Analysis
- Product Life Cycle Analysis
- Supply Chain Analysis
- Investment Feasibility Matrix
- Value Chain Analysis
- PESTLE and Porter's Analysis
- Regulatory Landscape
- Regional Parent Market Outlook
- Production and Consumption Statistics
- Import and Export Statistics
- Global Market Analysis and Forecast, 2021 to 2036
- Historical Market Size Value (USD Million) Analysis, 2021 to 2025
- Current and Future Market Size Value (USD Million) Projections, 2026 to 2036
- Y-o-Y Growth Trend Analysis
- Absolute $ Opportunity Analysis
- Global Market Pricing Analysis, 2021 to 2036
- Global Market Analysis and Forecast, By Product, 2021 to 2036
- Introduction / Key Findings
- Historical Market Size Value (USD Million) Analysis By Product, 2021 to 2025
- Current and Future Market Size Value (USD Million) Analysis and Forecast By Product, 2026 to 2036
- Single Lever Control Systems
- Mechanical Single Lever
- Electronic Single Lever
- Dual Lever Control Systems
- Mechanical Dual Lever
- Electronic Dual Lever
- Joystick and Integrated Control Systems
- Joystick Control Systems
- Integrated Helm Controls
- Single Lever Control Systems
- Y-o-Y Growth Trend Analysis By Product, 2021 to 2025
- Absolute $ Opportunity Analysis By Product, 2026 to 2036
- Global Market Analysis and Forecast, By Control Mechanism, 2021 to 2036
- Introduction / Key Findings
- Historical Market Size Value (USD Million) Analysis By Control Mechanism, 2021 to 2025
- Current and Future Market Size Value (USD Million) Analysis and Forecast By Control Mechanism, 2026 to 2036
- Mechanical Control Systems
- Push Pull Cable Systems
- Hydraulic Assisted Systems
- Electronic Control Systems
- Fly By Wire Systems
- Smart Control Systems
- Mechanical Control Systems
- Y-o-Y Growth Trend Analysis By Control Mechanism, 2021 to 2025
- Absolute $ Opportunity Analysis By Control Mechanism, 2026 to 2036
- Global Market Analysis and Forecast, By Vessel Type, 2021 to 2036
- Introduction / Key Findings
- Historical Market Size Value (USD Million) Analysis By Vessel Type, 2021 to 2025
- Current and Future Market Size Value (USD Million) Analysis and Forecast By Vessel Type, 2026 to 2036
- Recreational Boats
- Motorboats
- Yachts and Cruisers
- Commercial Vessels
- Workboats
- Transport Vessels
- Defense and Military Vessels
- Naval Ships
- Coast Guard Vessels
- Recreational Boats
- Y-o-Y Growth Trend Analysis By Vessel Type, 2021 to 2025
- Absolute $ Opportunity Analysis By Vessel Type, 2026 to 2036
- Global Market Analysis and Forecast, By Application, 2021 to 2036
- Introduction / Key Findings
- Historical Market Size Value (USD Million) Analysis By Application, 2021 to 2025
- Current and Future Market Size Value (USD Million) Analysis and Forecast By Application, 2026 to 2036
- Navigation and Maneuvering
- Docking Operations
- Open Water Navigation
- Propulsion Control
- Throttle Management
- Gear Shifting
- Safety and Monitoring
- Emergency Control
- System Monitoring
- Navigation and Maneuvering
- Y-o-Y Growth Trend Analysis By Application, 2021 to 2025
- Absolute $ Opportunity Analysis By Application, 2026 to 2036
- Global Market Analysis and Forecast, By End Use, 2021 to 2036
- Introduction / Key Findings
- Historical Market Size Value (USD Million) Analysis By End Use, 2021 to 2025
- Current and Future Market Size Value (USD Million) Analysis and Forecast By End Use, 2026 to 2036
- OEM Installations
- Boat Manufacturers
- Engine Manufacturers
- Aftermarket
- Retrofit Installations
- Service Providers
- OEM Installations
- Y-o-Y Growth Trend Analysis By End Use, 2021 to 2025
- Absolute $ Opportunity Analysis By End Use, 2026 to 2036
- Global Market Analysis and Forecast, By Mounting Type
- Introduction / Key Findings
- Historical Market Size Value (USD Million) Analysis By Mounting Type, 2021 to 2025
- Current and Future Market Size Value (USD Million) Analysis and Forecast By Mounting Type, 2026 to 2036
- Side Mount Controls
- Single Side Mount
- Dual Side Mount
- Top Mount Controls
- Single Top Mount
- Dual Top Mount
- Side Mount Controls
- Y-o-Y Growth Trend Analysis By Mounting Type, 2021 to 2025
- Absolute $ Opportunity Analysis By Mounting Type, 2026 to 2036
- Global Market Analysis and Forecast, By Technology
- Introduction / Key Findings
- Historical Market Size Value (USD Million) Analysis By Technology, 2021 to 2025
- Current and Future Market Size Value (USD Million) Analysis and Forecast By Technology, 2026 to 2036
- Conventional Control Systems
- Manual Operation
- Assisted Control Technology
- Electronic Assistance
- Advanced Integrated Technology
- Joystick Integration
- Smart Systems
- Conventional Control Systems
- Y-o-Y Growth Trend Analysis By Technology, 2021 to 2025
- Absolute $ Opportunity Analysis By Technology, 2026 to 2036
- Global Market Analysis and Forecast, By Region, 2021 to 2036
- Introduction
- Historical Market Size Value (USD Million) Analysis By Region, 2021 to 2025
- Current Market Size Value (USD Million) Analysis and Forecast By Region, 2026 to 2036
- North America
- Latin America
- Western Europe
- Eastern Europe
- East Asia
- South Asia and Pacific
- Middle East & Africa
- Market Attractiveness Analysis By Region
- North America Market Analysis and Forecast, By Country, 2021 to 2036
- Historical Market Size Value (USD Million) Trend Analysis By Market Taxonomy, 2021 to 2025
- Market Size Value (USD Million) Forecast By Market Taxonomy, 2026 to 2036
- By Country
- USA
- Canada
- Mexico
- By Product
- By Control Mechanism
- By Vessel Type
- By Application
- By End Use
- By Mounting Type
- By Technology
- By Country
- Market Attractiveness Analysis
- By Country
- By Product
- By Control Mechanism
- By Vessel Type
- By Application
- By End Use
- By Mounting Type
- By Technology
- Key Takeaways
- Latin America Market Analysis and Forecast, By Country
- Historical Market Size Value (USD Million) Trend Analysis By Market Taxonomy, 2021 to 2025
- Market Size Value (USD Million) Forecast By Market Taxonomy, 2026 to 2036
- By Country
- Brazil
- Chile
- Rest of Latin America
- By Product
- By Control Mechanism
- By Vessel Type
- By Application
- By End Use
- By Mounting Type
- By Technology
- By Country
- Market Attractiveness Analysis
- By Country
- By Product
- By Control Mechanism
- By Vessel Type
- By Application
- By End Use
- By Mounting Type
- By Technology
- Key Takeaways
- Western Europe Market Analysis and Forecast, By Country
- Historical Market Size Value (USD Million) Trend Analysis By Market Taxonomy, 2021 to 2025
- Market Size Value (USD Million) Forecast By Market Taxonomy, 2026 to 2036
- By Country
- Germany
- UK
- Italy
- Spain
- France
- Nordic
- BENELUX
- Rest of Western Europe
- By Product
- By Control Mechanism
- By Vessel Type
- By Application
- By End Use
- By Mounting Type
- By Technology
- By Country
- Market Attractiveness Analysis
- By Country
- By Product
- By Control Mechanism
- By Vessel Type
- By Application
- By End Use
- By Mounting Type
- By Technology
- Key Takeaways
- Eastern Europe Market Analysis and Forecast, By Country
- Historical Market Size Value (USD Million) Trend Analysis By Market Taxonomy, 2021 to 2025
- Market Size Value (USD Million) Forecast By Market Taxonomy, 2026 to 2036
- By Country
- Russia
- Poland
- Hungary
- Balkan & Baltic
- Rest of Eastern Europe
- By Product
- By Control Mechanism
- By Vessel Type
- By Application
- By End Use
- By Mounting Type
- By Technology
- By Country
- Market Attractiveness Analysis
- By Country
- By Product
- By Control Mechanism
- By Vessel Type
- By Application
- By End Use
- By Mounting Type
- By Technology
- Key Takeaways
- East Asia Market Analysis and Forecast, By Country
- Historical Market Size Value (USD Million) Trend Analysis By Market Taxonomy, 2021 to 2025
- Market Size Value (USD Million) Forecast By Market Taxonomy, 2026 to 2036
- By Country
- China
- Japan
- South Korea
- By Product
- By Control Mechanism
- By Vessel Type
- By Application
- By End Use
- By Mounting Type
- By Technology
- By Country
- Market Attractiveness Analysis
- By Country
- By Product
- By Control Mechanism
- By Vessel Type
- By Application
- By End Use
- By Mounting Type
- By Technology
- Key Takeaways
- South Asia and Pacific Market Analysis and Forecast, By Country
- Historical Market Size Value (USD Million) Trend Analysis By Market Taxonomy, 2021 to 2025
- Market Size Value (USD Million) Forecast By Market Taxonomy, 2026 to 2036
- By Country
- India
- ASEAN
- Australia & New Zealand
- Rest of South Asia and Pacific
- By Product
- By Control Mechanism
- By Vessel Type
- By Application
- By End Use
- By Mounting Type
- By Technology
- By Country
- Market Attractiveness Analysis
- By Country
- By Product
- By Control Mechanism
- By Vessel Type
- By Application
- By End Use
- By Mounting Type
- By Technology
- Key Takeaways
- Middle East & Africa Market Analysis and Forecast, By Country
- Historical Market Size Value (USD Million) Trend Analysis By Market Taxonomy, 2021 to 2025
- Market Size Value (USD Million) Forecast By Market Taxonomy, 2026 to 2036
- By Country
- Kingdom of Saudi Arabia
- Other GCC Countries
- Türkiye
- South Africa
- Other African Union
- Rest of Middle East & Africa
- By Product
- By Control Mechanism
- By Vessel Type
- By Application
- By End Use
- By Mounting Type
- By Technology
- By Country
- Market Attractiveness Analysis
- By Country
- By Product
- By Control Mechanism
- By Vessel Type
- By Application
- By End Use
- By Mounting Type
- By Technology
- Key Takeaways
- Key Countries Market Analysis
- USA
- Pricing Analysis
- Market Share Analysis, 2025
- By Product
- By Control Mechanism
- By Vessel Type
- By Application
- By End Use
- By Mounting Type
- By Technology
- Canada
- Pricing Analysis
- Market Share Analysis, 2025
- By Product
- By Control Mechanism
- By Vessel Type
- By Application
- By End Use
- By Mounting Type
- By Technology
- Mexico
- Pricing Analysis
- Market Share Analysis, 2025
- By Product
- By Control Mechanism
- By Vessel Type
- By Application
- By End Use
- By Mounting Type
- By Technology
- Brazil
- Pricing Analysis
- Market Share Analysis, 2025
- By Product
- By Control Mechanism
- By Vessel Type
- By Application
- By End Use
- By Mounting Type
- By Technology
- Chile
- Pricing Analysis
- Market Share Analysis, 2025
- By Product
- By Control Mechanism
- By Vessel Type
- By Application
- By End Use
- By Mounting Type
- By Technology
- Germany
- Pricing Analysis
- Market Share Analysis, 2025
- By Product
- By Control Mechanism
- By Vessel Type
- By Application
- By End Use
- By Mounting Type
- By Technology
- UK
- Pricing Analysis
- Market Share Analysis, 2025
- By Product
- By Control Mechanism
- By Vessel Type
- By Application
- By End Use
- By Mounting Type
- By Technology
- Italy
- Pricing Analysis
- Market Share Analysis, 2025
- By Product
- By Control Mechanism
- By Vessel Type
- By Application
- By End Use
- By Mounting Type
- By Technology
- Spain
- Pricing Analysis
- Market Share Analysis, 2025
- By Product
- By Control Mechanism
- By Vessel Type
- By Application
- By End Use
- By Mounting Type
- By Technology
- France
- Pricing Analysis
- Market Share Analysis, 2025
- By Product
- By Control Mechanism
- By Vessel Type
- By Application
- By End Use
- By Mounting Type
- By Technology
- India
- Pricing Analysis
- Market Share Analysis, 2025
- By Product
- By Control Mechanism
- By Vessel Type
- By Application
- By End Use
- By Mounting Type
- By Technology
- ASEAN
- Pricing Analysis
- Market Share Analysis, 2025
- By Product
- By Control Mechanism
- By Vessel Type
- By Application
- By End Use
- By Mounting Type
- By Technology
- Australia & New Zealand
- Pricing Analysis
- Market Share Analysis, 2025
- By Product
- By Control Mechanism
- By Vessel Type
- By Application
- By End Use
- By Mounting Type
- By Technology
- China
- Pricing Analysis
- Market Share Analysis, 2025
- By Product
- By Control Mechanism
- By Vessel Type
- By Application
- By End Use
- By Mounting Type
- By Technology
- Japan
- Pricing Analysis
- Market Share Analysis, 2025
- By Product
- By Control Mechanism
- By Vessel Type
- By Application
- By End Use
- By Mounting Type
- By Technology
- South Korea
- Pricing Analysis
- Market Share Analysis, 2025
- By Product
- By Control Mechanism
- By Vessel Type
- By Application
- By End Use
- By Mounting Type
- By Technology
- Russia
- Pricing Analysis
- Market Share Analysis, 2025
- By Product
- By Control Mechanism
- By Vessel Type
- By Application
- By End Use
- By Mounting Type
- By Technology
- Poland
- Pricing Analysis
- Market Share Analysis, 2025
- By Product
- By Control Mechanism
- By Vessel Type
- By Application
- By End Use
- By Mounting Type
- By Technology
- Hungary
- Pricing Analysis
- Market Share Analysis, 2025
- By Product
- By Control Mechanism
- By Vessel Type
- By Application
- By End Use
- By Mounting Type
- By Technology
- Kingdom of Saudi Arabia
- Pricing Analysis
- Market Share Analysis, 2025
- By Product
- By Control Mechanism
- By Vessel Type
- By Application
- By End Use
- By Mounting Type
- By Technology
- Türkiye
- Pricing Analysis
- Market Share Analysis, 2025
- By Product
- By Control Mechanism
- By Vessel Type
- By Application
- By End Use
- By Mounting Type
- By Technology
- South Africa
- Pricing Analysis
- Market Share Analysis, 2025
- By Product
- By Control Mechanism
- By Vessel Type
- By Application
- By End Use
- By Mounting Type
- By Technology
- USA
- Market Structure Analysis
- Competition Dashboard
- Competition Benchmarking
- Market Share Analysis of Top Players
- By Regional
- By Product
- By Control Mechanism
- By Vessel Type
- By Application
- By End Use
- By Mounting Type
- By Technology
- Emerging Startups
- Innovation Benchmarking
- Competition Analysis
- Competition Deep Dive
- Glendinning Products, LLC
- Overview
- Product Portfolio
- Profitability by Market Segments (Product/Region/Sales Channel)
- Sales Footprint
- Strategy Overview
- Marketing Strategy
- Product Strategy
- Channel Strategy
- Lewmar Limited
- Vetus B.V.
- Morse Controls
- ZF Friedrichshafen AG
- Glendinning Products, LLC
- Case Studies
- Success Stories
- Recent Developments
- Competition Deep Dive
- Assumptions & Acronyms Used


