Hybrid Boat Market Size and Share Forecast Outlook From 2024 to 2034

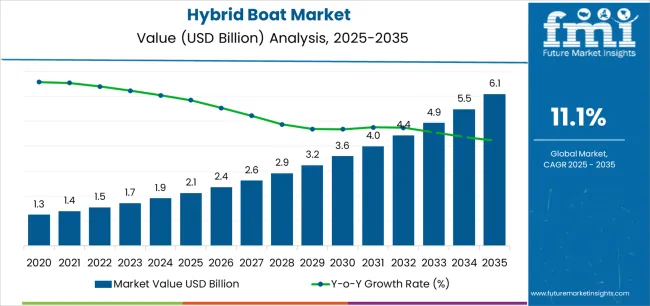
The Hybrid Boat Market is estimated at USD 1.9 billion by 2024. The market valuation is expected to be USD 5.9 billion by 2034, registering an impressive CAGR of 11.7%.

The market within the consumer product domain is experiencing significant growth as eco-conscious consumers seek sustainable alternatives. Hybrid boats combine traditional fuel sources with electric propulsion, reducing environmental impact and fuel costs.

The vessels offer versatility, seamlessly transitioning between power sources based on efficiency and environmental considerations. The consumer appeal lies in the eco-friendly nature of hybrid boats, aligning with the growing trend towards responsible and green choices in recreational activities.

Manufacturers invest in research and development to enhance battery efficiency, driving innovation in the hybrid boat sector. As awareness of environmental issues increases, the market is poised to expand, catering to consumers seeking performance and environmental responsibility in their water-based leisure activities.

Key Market Trends and Highlights

  • Increasing consumer consciousness regarding environmental impact drives demand for hybrid boats.
  • Hybrid boats seamlessly switch between traditional fuel and electric power, offering flexibility and efficiency.
  • Consumers benefit from reduced fuel costs as hybrid boats optimize energy usage through electric propulsion.
  • Ongoing research and development focuses on improving battery efficiency, addressing a key aspect of hybrid boat performance.
  • The market will expand as manufacturers invest in advancements, catering to a growing eco-friendly leisure segment.
Attributes Key Insights
Market Estimated Size in 2024 USD 1.9 billion
Projected Market Size in 2034 USD 5.9 billion
Value-based CAGR from 2024 to 2034 11.7%

Sales Trend Analysis from 2019 to 2023 Compared to Market Outlook for 2024 to 2034

The scope for global hybrid boat market insights expanded at a 15.1% CAGR between 2019 and 2023. The market is anticipated to develop at a CAGR of 11.7% over the forecast period from 2024 to 2034.

Historical CAGR from 2019 to 2023 15.1%
Forecast CAGR from 2024 to 2034 11.7%

Between 2019 and 2023, the global market witnessed substantial growth, with a CAGR of 15.1%. This surge can be attributed to increasing consumer awareness of environmental sustainability, prompting a shift towards hybrid boats that combine traditional fuel and electric power sources.

The period saw robust market expansion as manufacturers focused on technological advancements and innovation, enhancing the appeal of hybrid boats to eco-conscious consumers.

The market is poised for continued development, albeit slightly moderated. Projections indicate a CAGR of 11.7% from 2024 to 2034. Despite a marginally lower growth rate, the forecast suggests sustained demand for hybrid boats.

This phase is characterized by a more mature market, where ongoing improvements in battery technology, regulatory support, and a solid foundation laid in the preceding years contribute to the continued success of hybrid boats in meeting the evolving preferences of consumers seeking both performance and environmental responsibility.

Emerging Opportunities in the Hybrid Boat Market

Attributes Details
Opportunities
  • Opportunities arise in promoting a hybrid boating culture, influencing consumer perceptions, and fostering long-term market growth.
  • Addressing consumer demand for personalized experiences, there are opportunities for manufacturers to offer customizable features in hybrid boats.
  • Opportunities lie in conducting awareness campaigns to educate consumers about the benefits of hybrid boats, further expanding market acceptance.
  • Manufacturers can capitalize on opportunities by adopting innovative marketing strategies to differentiate their hybrid boat offerings and capture consumer attention in a competitive market landscape.

Analysis of Top Countries Producing, Regulating, and Deploying Hybrid Boats

The table emphasizes the CAGRs in five pivotal countries, namely the United States, Japan, China, the United Kingdom, and South Korea.

South Korea emerges as a dynamic and rapidly advancing market, poised for significant growth with an impressive 14% CAGR expected by 2034. Recognized for its commitment to innovation, the country is pivotal across various industries, showcasing a thriving economic landscape marked by continuous progress.

The substantial CAGR highlights the proactive approach to embracing and propelling advancements in the market, solidifying its position as a key contributor to the global industry. This underscores the dedication to sustainable practices, positioning South Korea as a notable player driving positive global developments within the hybrid boat sector.

Countries CAGR from 2024 to 2034
The United States 11.9%
Japan 13.2%
China 12.3%
The United Kingdom 13%
South Korea 14%

Rise in Environmental Consciousness Propels the Demand in the United States

The United States exhibits a robust 11.9% CAGR, driven by a combination of factors. Environmental consciousness is rising, propelling the demand for sustainable recreational options.

The vast inland waterways and coastal regions create ample opportunities for hybrid boats, meeting the diverse needs of American boaters. Government initiatives and incentives encourage the adoption of eco-friendly technologies, contributing to the growth of the market in the United States

Technological Innovation Fuels Market Growth in Japan

A strong commitment to technological innovation and environmental sustainability influences the 13.2% CAGR in the market. With a rich maritime culture, consumers are increasingly drawn to hybrid boats for their eco-friendly features.

Government support for clean energy initiatives and a penchant for cutting-edge technologies contribute to the rapid adoption of hybrid boats, making Japan a key market for sustainable marine transportation.

Adoption of Hybrid Boats Boosts the Market Growth in China

With a 12.3% CAGR, China reflects a growing demand for hybrid boats fueled by the expanding middle class and a burgeoning interest in water-based recreational activities.

As environmental concerns gain prominence, consumers seek greener alternatives, making hybrid boats an attractive choice. Government initiatives promoting green transportation align with the market trend, further boosting the adoption of hybrid boats across an extensive network of rivers, lakes, and coastal areas.

Increase in Environmental Awareness Surges the Market Growth in the United Kingdom

The United Kingdom 13% CAGR is driven by environmental awareness, stringent regulations, and a strong maritime heritage. British consumers, conscious of ecological impact, are increasingly turning to hybrid boats.

The United Kingdom commitment to reducing carbon emissions in the maritime sector aligns with the eco-friendly features of hybrid boats, making them a preferred choice. The diverse water bodies in the region create opportunities for hybrid boat enthusiasts, contributing to market growth.

Government Support and Tech-Savvy Population Inhibits Growth in South Korea

The impressive growth rate at 14% CAGR is attributed to a culture of technological excellence and a keen interest in sustainable practices. The thriving shipbuilding industry leverages expertise to produce advanced hybrid boats.

With a picturesque coastline and an emphasis on eco-friendly solutions, South Korean consumers embrace hybrid boats for leisure and practical transportation. Government support and a tech-savvy population further propel the market growth in South Korea.

Hybrid Boat Industry Analysis by Top Investment Segments

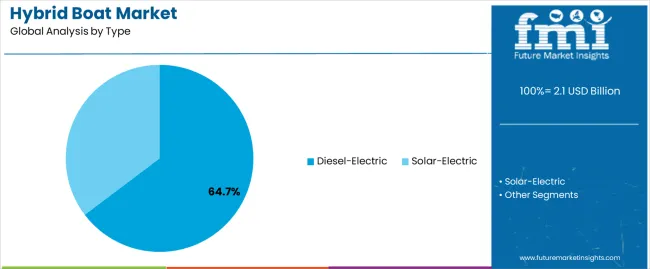
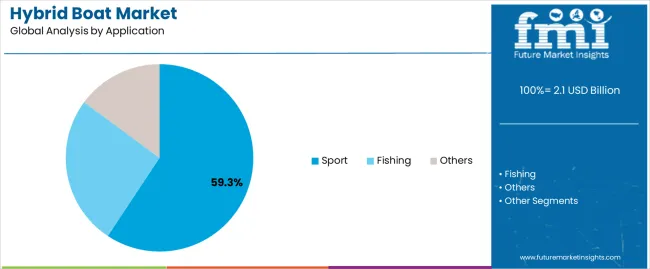
The table below provides an overview of the hybrid boat landscape on the basis of type and application. Diesel-Electric is projected to lead the type of market at an 11.5% CAGR by 2034, while sport in the application category is likely to expand at a CAGR of 11.3% by 2034.

The prominence of diesel-electric hybrid boats is driven by their superior fuel efficiency and extended range. The dominance of the sport application category is propelled by the versatility and high-performance hybrid boats offer in sporting activities.

Category CAGR from 2024 to 2034
Diesel-Electric 11.5%
Sport 11.3%

Diesel-Electric Holds a Dominant Position in the Market

The data indicates that diesel-electric hybrid boats are anticipated to dominate the market, with a projected CAGR of 11.5% by 2034. This underscores a sustained preference for hybrid boats integrating diesel and electric propulsion systems, combining efficiency and environmental considerations.

Sport Emerges as a Significant Segment in the Market

The sports segment is poised for substantial expansion in the application category, projecting a CAGR of 11.3% by 2034. This signals a growing demand for hybrid boats in recreational and sporting activities, emphasizing the appeal of eco-friendly and versatile watercraft for enthusiasts seeking both performance and sustainability.

The dual emphasis on diesel-electric technology and sporting applications reflects the evolving landscape of the market, catering to diverse consumer preferences and environmental concerns.
Leading Suppliers in the Hybrid Boat Sector

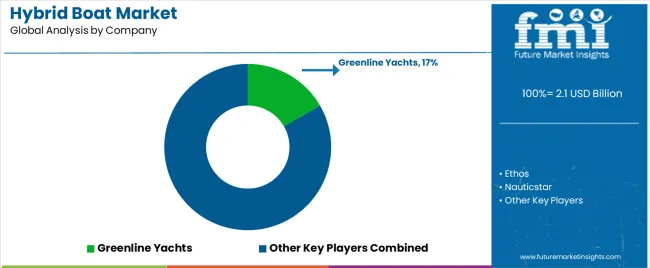
The competitive landscape of the hybrid boat market is characterized by active industry players vying for market share and innovation. Manufacturers are engaged in continuous research and development to enhance technological features, improve performance, and address environmental concerns.

Robust competition fosters a variety of offerings to cater to diverse consumer preferences.

Key market players are establishing strategic collaborations and partnerships to leverage combined expertise and accelerate advancements in propulsion technologies. This collaborative approach enhances market penetration and strengthens the industrial position in promoting sustainable boating practices.

Effective marketing strategies to differentiate products and capture consumer attention mark the competitive environment.

Companies are focusing on branding efforts that highlight the eco-friendly aspects of hybrid boats, aligning with the increasing global emphasis on environmentally responsible choices. As the market evolves, competitive dynamics drive innovation, fostering a dynamic landscape in the hybrid boat industry.

Key Market Developments

  • In May 2023, Mercury Marine and JJE partnered to expand the Avator electric product line for higher power applications.
  • In October 2022, Enevate, a renowned global battery innovation company, joined forces with Sealence, a boat propulsion company, in a collaborative effort to advance high-performance battery cell technology specifically designed for marine applications.

Scope and Coverage of the Hybrid Boat Market Report

Attributes Details
Estimated Market Size in 2024 USD 1.9 billion
Projected Market Valuation in 2034 USD 5.9 billion
CAGR Share from 2024 to 2034 11.7%
Forecast Period 2024 to 2034
Historical Data Available for 2019 to 2023
Market Analysis Value in USD billion
Key Regions Covered North America; Latin America; Western Europe; Eastern Europe; South Asia and Pacific; East Asia; Middle East and Africa
Key Market Segments Covered By Type, By Application, By Region
Key Countries Profiled United States, Canada, Brazil, Mexico, Germany, United Kingdom, France, Spain, Italy, Poland, Russia, Czech Republic, Romania, India, Bangladesh, Australia, New Zealand, China, Japan, South Korea, GCC Countries, South Africa, Israel
Key Companies Profiled Ethos; Nauticstar; Bavaria Motorboats; Greenline Yachts; Nautique Boats; Rand Boats; Domani Yachts; Duffy Electric Boats; Greenline Yachts; Silent Yachts

Top Segments Studied in the Hybrid Boat Market

By Type:

  • Diesel-Electric
  • Solar-Electric

By Application:

  • Sport
  • Fishing
  • Others

By Region:

  • North America
  • Latin America
  • Western Europe
  • Eastern Europe
  • South Asia and Pacific
  • East Asia
  • Middle East and Africa

Table of Content

  • 1. Executive Summary
  • 2. Market Overview
  • 3. Market Background
  • 4. Global Market Analysis 2019 to 2023 and Forecast, 2024 to 2034
  • 5. Global Market Analysis 2019 to 2023 and Forecast 2024 to 2034, By Type
    • 5.1. Diesel-Electric
    • 5.2. Solar-Electric
  • 6. Global Market Analysis 2019 to 2023 and Forecast 2024 to 2034, By Application
    • 6.1. Sport
    • 6.2. Fishing
    • 6.3. Others
  • 7. Global Market Analysis 2019 to 2023 and Forecast 2024 to 2034, By Region
    • 7.1. North America
    • 7.2. Latin America
    • 7.3. Western Europe
    • 7.4. Eastern Europe
    • 7.5. South Asia and Pacific
    • 7.6. East Asia
    • 7.7. Middle East and Africa
  • 8. North America Market Analysis 2019 to 2023 and Forecast 2024 to 2034, By Country
  • 9. Latin America Market Analysis 2019 to 2023 and Forecast 2024 to 2034, By Country
  • 10. Western Europe Market Analysis 2019 to 2023 and Forecast 2024 to 2034, By Country
  • 11. Eastern Europe Market Analysis 2019 to 2023 and Forecast 2024 to 2034, By Country
  • 12. South Asia and Pacific Market Analysis 2019 to 2023 and Forecast 2024 to 2034, By Country
  • 13. East Asia Market Analysis 2019 to 2023 and Forecast 2024 to 2034, By Country
  • 14. Middle East and Africa Market Analysis 2019 to 2023 and Forecast 2024 to 2034, By Country
  • 15. Key Countries Market Analysis
  • 16. Market Structure Analysis
  • 17. Competition Analysis
    • 17.1. Ethos
    • 17.2. Nauticstar
    • 17.3. Bavaria Motorboats
    • 17.4. Greenline Yachts
    • 17.5. Nautique Boats
    • 17.6. Rand Boats
    • 17.7. Domani Yachts
    • 17.8. Duffy Electric Boats
    • 17.9. Silent Yachts
  • 18. Assumptions & Acronyms Used
  • 19. Research Methodology

List of Tables

Table 1: Global Market Value (US$ Million) Forecast by Region, 2019 to 2034

Table 2: Global Market Volume (Units) Forecast by Region, 2019 to 2034

Table 3: Global Market Value (US$ Million) Forecast by Type, 2019 to 2034

Table 4: Global Market Volume (Units) Forecast by Type, 2019 to 2034

Table 5: Global Market Value (US$ Million) Forecast by Application, 2019 to 2034

Table 6: Global Market Volume (Units) Forecast by Application, 2019 to 2034

Table 7: North America Market Value (US$ Million) Forecast by Country, 2019 to 2034

Table 8: North America Market Volume (Units) Forecast by Country, 2019 to 2034

Table 9: North America Market Value (US$ Million) Forecast by Type, 2019 to 2034

Table 10: North America Market Volume (Units) Forecast by Type, 2019 to 2034

Table 11: North America Market Value (US$ Million) Forecast by Application, 2019 to 2034

Table 12: North America Market Volume (Units) Forecast by Application, 2019 to 2034

Table 13: Latin America Market Value (US$ Million) Forecast by Country, 2019 to 2034

Table 14: Latin America Market Volume (Units) Forecast by Country, 2019 to 2034

Table 15: Latin America Market Value (US$ Million) Forecast by Type, 2019 to 2034

Table 16: Latin America Market Volume (Units) Forecast by Type, 2019 to 2034

Table 17: Latin America Market Value (US$ Million) Forecast by Application, 2019 to 2034

Table 18: Latin America Market Volume (Units) Forecast by Application, 2019 to 2034

Table 19: Western Europe Market Value (US$ Million) Forecast by Country, 2019 to 2034

Table 20: Western Europe Market Volume (Units) Forecast by Country, 2019 to 2034

Table 21: Western Europe Market Value (US$ Million) Forecast by Type, 2019 to 2034

Table 22: Western Europe Market Volume (Units) Forecast by Type, 2019 to 2034

Table 23: Western Europe Market Value (US$ Million) Forecast by Application, 2019 to 2034

Table 24: Western Europe Market Volume (Units) Forecast by Application, 2019 to 2034

Table 25: Eastern Europe Market Value (US$ Million) Forecast by Country, 2019 to 2034

Table 26: Eastern Europe Market Volume (Units) Forecast by Country, 2019 to 2034

Table 27: Eastern Europe Market Value (US$ Million) Forecast by Type, 2019 to 2034

Table 28: Eastern Europe Market Volume (Units) Forecast by Type, 2019 to 2034

Table 29: Eastern Europe Market Value (US$ Million) Forecast by Application, 2019 to 2034

Table 30: Eastern Europe Market Volume (Units) Forecast by Application, 2019 to 2034

Table 31: South Asia and Pacific Market Value (US$ Million) Forecast by Country, 2019 to 2034

Table 32: South Asia and Pacific Market Volume (Units) Forecast by Country, 2019 to 2034

Table 33: South Asia and Pacific Market Value (US$ Million) Forecast by Type, 2019 to 2034

Table 34: South Asia and Pacific Market Volume (Units) Forecast by Type, 2019 to 2034

Table 35: South Asia and Pacific Market Value (US$ Million) Forecast by Application, 2019 to 2034

Table 36: South Asia and Pacific Market Volume (Units) Forecast by Application, 2019 to 2034

Table 37: East Asia Market Value (US$ Million) Forecast by Country, 2019 to 2034

Table 38: East Asia Market Volume (Units) Forecast by Country, 2019 to 2034

Table 39: East Asia Market Value (US$ Million) Forecast by Type, 2019 to 2034

Table 40: East Asia Market Volume (Units) Forecast by Type, 2019 to 2034

Table 41: East Asia Market Value (US$ Million) Forecast by Application, 2019 to 2034

Table 42: East Asia Market Volume (Units) Forecast by Application, 2019 to 2034

Table 43: Middle East and Africa Market Value (US$ Million) Forecast by Country, 2019 to 2034

Table 44: Middle East and Africa Market Volume (Units) Forecast by Country, 2019 to 2034

Table 45: Middle East and Africa Market Value (US$ Million) Forecast by Type, 2019 to 2034

Table 46: Middle East and Africa Market Volume (Units) Forecast by Type, 2019 to 2034

Table 47: Middle East and Africa Market Value (US$ Million) Forecast by Application, 2019 to 2034

Table 48: Middle East and Africa Market Volume (Units) Forecast by Application, 2019 to 2034

List of Figures

Figure 1: Global Market Value (US$ Million) by Type, 2024 to 2034

Figure 2: Global Market Value (US$ Million) by Application, 2024 to 2034

Figure 3: Global Market Value (US$ Million) by Region, 2024 to 2034

Figure 4: Global Market Value (US$ Million) Analysis by Region, 2019 to 2034

Figure 5: Global Market Volume (Units) Analysis by Region, 2019 to 2034

Figure 6: Global Market Value Share (%) and BPS Analysis by Region, 2024 to 2034

Figure 7: Global Market Y-o-Y Growth (%) Projections by Region, 2024 to 2034

Figure 8: Global Market Value (US$ Million) Analysis by Type, 2019 to 2034

Figure 9: Global Market Volume (Units) Analysis by Type, 2019 to 2034

Figure 10: Global Market Value Share (%) and BPS Analysis by Type, 2024 to 2034

Figure 11: Global Market Y-o-Y Growth (%) Projections by Type, 2024 to 2034

Figure 12: Global Market Value (US$ Million) Analysis by Application, 2019 to 2034

Figure 13: Global Market Volume (Units) Analysis by Application, 2019 to 2034

Figure 14: Global Market Value Share (%) and BPS Analysis by Application, 2024 to 2034

Figure 15: Global Market Y-o-Y Growth (%) Projections by Application, 2024 to 2034

Figure 16: Global Market Attractiveness by Type, 2024 to 2034

Figure 17: Global Market Attractiveness by Application, 2024 to 2034

Figure 18: Global Market Attractiveness by Region, 2024 to 2034

Figure 19: North America Market Value (US$ Million) by Type, 2024 to 2034

Figure 20: North America Market Value (US$ Million) by Application, 2024 to 2034

Figure 21: North America Market Value (US$ Million) by Country, 2024 to 2034

Figure 22: North America Market Value (US$ Million) Analysis by Country, 2019 to 2034

Figure 23: North America Market Volume (Units) Analysis by Country, 2019 to 2034

Figure 24: North America Market Value Share (%) and BPS Analysis by Country, 2024 to 2034

Figure 25: North America Market Y-o-Y Growth (%) Projections by Country, 2024 to 2034

Figure 26: North America Market Value (US$ Million) Analysis by Type, 2019 to 2034

Figure 27: North America Market Volume (Units) Analysis by Type, 2019 to 2034

Figure 28: North America Market Value Share (%) and BPS Analysis by Type, 2024 to 2034

Figure 29: North America Market Y-o-Y Growth (%) Projections by Type, 2024 to 2034

Figure 30: North America Market Value (US$ Million) Analysis by Application, 2019 to 2034

Figure 31: North America Market Volume (Units) Analysis by Application, 2019 to 2034

Figure 32: North America Market Value Share (%) and BPS Analysis by Application, 2024 to 2034

Figure 33: North America Market Y-o-Y Growth (%) Projections by Application, 2024 to 2034

Figure 34: North America Market Attractiveness by Type, 2024 to 2034

Figure 35: North America Market Attractiveness by Application, 2024 to 2034

Figure 36: North America Market Attractiveness by Country, 2024 to 2034

Figure 37: Latin America Market Value (US$ Million) by Type, 2024 to 2034

Figure 38: Latin America Market Value (US$ Million) by Application, 2024 to 2034

Figure 39: Latin America Market Value (US$ Million) by Country, 2024 to 2034

Figure 40: Latin America Market Value (US$ Million) Analysis by Country, 2019 to 2034

Figure 41: Latin America Market Volume (Units) Analysis by Country, 2019 to 2034

Figure 42: Latin America Market Value Share (%) and BPS Analysis by Country, 2024 to 2034

Figure 43: Latin America Market Y-o-Y Growth (%) Projections by Country, 2024 to 2034

Figure 44: Latin America Market Value (US$ Million) Analysis by Type, 2019 to 2034

Figure 45: Latin America Market Volume (Units) Analysis by Type, 2019 to 2034

Figure 46: Latin America Market Value Share (%) and BPS Analysis by Type, 2024 to 2034

Figure 47: Latin America Market Y-o-Y Growth (%) Projections by Type, 2024 to 2034

Figure 48: Latin America Market Value (US$ Million) Analysis by Application, 2019 to 2034

Figure 49: Latin America Market Volume (Units) Analysis by Application, 2019 to 2034

Figure 50: Latin America Market Value Share (%) and BPS Analysis by Application, 2024 to 2034

Figure 51: Latin America Market Y-o-Y Growth (%) Projections by Application, 2024 to 2034

Figure 52: Latin America Market Attractiveness by Type, 2024 to 2034

Figure 53: Latin America Market Attractiveness by Application, 2024 to 2034

Figure 54: Latin America Market Attractiveness by Country, 2024 to 2034

Figure 55: Western Europe Market Value (US$ Million) by Type, 2024 to 2034

Figure 56: Western Europe Market Value (US$ Million) by Application, 2024 to 2034

Figure 57: Western Europe Market Value (US$ Million) by Country, 2024 to 2034

Figure 58: Western Europe Market Value (US$ Million) Analysis by Country, 2019 to 2034

Figure 59: Western Europe Market Volume (Units) Analysis by Country, 2019 to 2034

Figure 60: Western Europe Market Value Share (%) and BPS Analysis by Country, 2024 to 2034

Figure 61: Western Europe Market Y-o-Y Growth (%) Projections by Country, 2024 to 2034

Figure 62: Western Europe Market Value (US$ Million) Analysis by Type, 2019 to 2034

Figure 63: Western Europe Market Volume (Units) Analysis by Type, 2019 to 2034

Figure 64: Western Europe Market Value Share (%) and BPS Analysis by Type, 2024 to 2034

Figure 65: Western Europe Market Y-o-Y Growth (%) Projections by Type, 2024 to 2034

Figure 66: Western Europe Market Value (US$ Million) Analysis by Application, 2019 to 2034

Figure 67: Western Europe Market Volume (Units) Analysis by Application, 2019 to 2034

Figure 68: Western Europe Market Value Share (%) and BPS Analysis by Application, 2024 to 2034

Figure 69: Western Europe Market Y-o-Y Growth (%) Projections by Application, 2024 to 2034

Figure 70: Western Europe Market Attractiveness by Type, 2024 to 2034

Figure 71: Western Europe Market Attractiveness by Application, 2024 to 2034

Figure 72: Western Europe Market Attractiveness by Country, 2024 to 2034

Figure 73: Eastern Europe Market Value (US$ Million) by Type, 2024 to 2034

Figure 74: Eastern Europe Market Value (US$ Million) by Application, 2024 to 2034

Figure 75: Eastern Europe Market Value (US$ Million) by Country, 2024 to 2034

Figure 76: Eastern Europe Market Value (US$ Million) Analysis by Country, 2019 to 2034

Figure 77: Eastern Europe Market Volume (Units) Analysis by Country, 2019 to 2034

Figure 78: Eastern Europe Market Value Share (%) and BPS Analysis by Country, 2024 to 2034

Figure 79: Eastern Europe Market Y-o-Y Growth (%) Projections by Country, 2024 to 2034

Figure 80: Eastern Europe Market Value (US$ Million) Analysis by Type, 2019 to 2034

Figure 81: Eastern Europe Market Volume (Units) Analysis by Type, 2019 to 2034

Figure 82: Eastern Europe Market Value Share (%) and BPS Analysis by Type, 2024 to 2034

Figure 83: Eastern Europe Market Y-o-Y Growth (%) Projections by Type, 2024 to 2034

Figure 84: Eastern Europe Market Value (US$ Million) Analysis by Application, 2019 to 2034

Figure 85: Eastern Europe Market Volume (Units) Analysis by Application, 2019 to 2034

Figure 86: Eastern Europe Market Value Share (%) and BPS Analysis by Application, 2024 to 2034

Figure 87: Eastern Europe Market Y-o-Y Growth (%) Projections by Application, 2024 to 2034

Figure 88: Eastern Europe Market Attractiveness by Type, 2024 to 2034

Figure 89: Eastern Europe Market Attractiveness by Application, 2024 to 2034

Figure 90: Eastern Europe Market Attractiveness by Country, 2024 to 2034

Figure 91: South Asia and Pacific Market Value (US$ Million) by Type, 2024 to 2034

Figure 92: South Asia and Pacific Market Value (US$ Million) by Application, 2024 to 2034

Figure 93: South Asia and Pacific Market Value (US$ Million) by Country, 2024 to 2034

Figure 94: South Asia and Pacific Market Value (US$ Million) Analysis by Country, 2019 to 2034

Figure 95: South Asia and Pacific Market Volume (Units) Analysis by Country, 2019 to 2034

Figure 96: South Asia and Pacific Market Value Share (%) and BPS Analysis by Country, 2024 to 2034

Figure 97: South Asia and Pacific Market Y-o-Y Growth (%) Projections by Country, 2024 to 2034

Figure 98: South Asia and Pacific Market Value (US$ Million) Analysis by Type, 2019 to 2034

Figure 99: South Asia and Pacific Market Volume (Units) Analysis by Type, 2019 to 2034

Figure 100: South Asia and Pacific Market Value Share (%) and BPS Analysis by Type, 2024 to 2034

Figure 101: South Asia and Pacific Market Y-o-Y Growth (%) Projections by Type, 2024 to 2034

Figure 102: South Asia and Pacific Market Value (US$ Million) Analysis by Application, 2019 to 2034

Figure 103: South Asia and Pacific Market Volume (Units) Analysis by Application, 2019 to 2034

Figure 104: South Asia and Pacific Market Value Share (%) and BPS Analysis by Application, 2024 to 2034

Figure 105: South Asia and Pacific Market Y-o-Y Growth (%) Projections by Application, 2024 to 2034

Figure 106: South Asia and Pacific Market Attractiveness by Type, 2024 to 2034

Figure 107: South Asia and Pacific Market Attractiveness by Application, 2024 to 2034

Figure 108: South Asia and Pacific Market Attractiveness by Country, 2024 to 2034

Figure 109: East Asia Market Value (US$ Million) by Type, 2024 to 2034

Figure 110: East Asia Market Value (US$ Million) by Application, 2024 to 2034

Figure 111: East Asia Market Value (US$ Million) by Country, 2024 to 2034

Figure 112: East Asia Market Value (US$ Million) Analysis by Country, 2019 to 2034

Figure 113: East Asia Market Volume (Units) Analysis by Country, 2019 to 2034

Figure 114: East Asia Market Value Share (%) and BPS Analysis by Country, 2024 to 2034

Figure 115: East Asia Market Y-o-Y Growth (%) Projections by Country, 2024 to 2034

Figure 116: East Asia Market Value (US$ Million) Analysis by Type, 2019 to 2034

Figure 117: East Asia Market Volume (Units) Analysis by Type, 2019 to 2034

Figure 118: East Asia Market Value Share (%) and BPS Analysis by Type, 2024 to 2034

Figure 119: East Asia Market Y-o-Y Growth (%) Projections by Type, 2024 to 2034

Figure 120: East Asia Market Value (US$ Million) Analysis by Application, 2019 to 2034

Figure 121: East Asia Market Volume (Units) Analysis by Application, 2019 to 2034

Figure 122: East Asia Market Value Share (%) and BPS Analysis by Application, 2024 to 2034

Figure 123: East Asia Market Y-o-Y Growth (%) Projections by Application, 2024 to 2034

Figure 124: East Asia Market Attractiveness by Type, 2024 to 2034

Figure 125: East Asia Market Attractiveness by Application, 2024 to 2034

Figure 126: East Asia Market Attractiveness by Country, 2024 to 2034

Figure 127: Middle East and Africa Market Value (US$ Million) by Type, 2024 to 2034

Figure 128: Middle East and Africa Market Value (US$ Million) by Application, 2024 to 2034

Figure 129: Middle East and Africa Market Value (US$ Million) by Country, 2024 to 2034

Figure 130: Middle East and Africa Market Value (US$ Million) Analysis by Country, 2019 to 2034

Figure 131: Middle East and Africa Market Volume (Units) Analysis by Country, 2019 to 2034

Figure 132: Middle East and Africa Market Value Share (%) and BPS Analysis by Country, 2024 to 2034

Figure 133: Middle East and Africa Market Y-o-Y Growth (%) Projections by Country, 2024 to 2034

Figure 134: Middle East and Africa Market Value (US$ Million) Analysis by Type, 2019 to 2034

Figure 135: Middle East and Africa Market Volume (Units) Analysis by Type, 2019 to 2034

Figure 136: Middle East and Africa Market Value Share (%) and BPS Analysis by Type, 2024 to 2034

Figure 137: Middle East and Africa Market Y-o-Y Growth (%) Projections by Type, 2024 to 2034

Figure 138: Middle East and Africa Market Value (US$ Million) Analysis by Application, 2019 to 2034

Figure 139: Middle East and Africa Market Volume (Units) Analysis by Application, 2019 to 2034

Figure 140: Middle East and Africa Market Value Share (%) and BPS Analysis by Application, 2024 to 2034

Figure 141: Middle East and Africa Market Y-o-Y Growth (%) Projections by Application, 2024 to 2034

Figure 142: Middle East and Africa Market Attractiveness by Type, 2024 to 2034

Figure 143: Middle East and Africa Market Attractiveness by Application, 2024 to 2034

Figure 144: Middle East and Africa Market Attractiveness by Country, 2024 to 2034

Frequently Asked Questions

What is the expected value of the hybrid boat market in 2024?

By 2024, the hybrid boat landscape is anticipated to be valued at USD 1.9 billion.

What is the projected forecast CAGR for the hybrid boat market from 2024 to 2034?

The hybrid boat market is projected to flourish at a CAGR of 11.7% from 2024 to 2034.

At what value the hybrid boat market is expected to conclude in 2034?

By 2034, the hybrid boat market will generate USD 5.9 billion in value terms.

Based on type, which segment dominates the hybrid boat market?

The diesel-electric type is anticipated to expand at 11.5% CAGR by 2034.

Which country dominates the hybrid boat market?

With a CAGR of 14%, South Korea is expected to dominate the market for composite resins.

Explore Similar Insights

Future Market Insights

Hybrid Boat Market