Reports

- Global Locations -

Headquarters

Future Market Insights, Inc.

Christiana Corporate, 200
Continental Drive, Suite 401,
Newark, Delaware - 19713,
United States

T: +1-845-579-5705

Americas

Future Market Insights, Inc.

616 Corporate Way, Suite 2-9018,
Valley Cottage, NY 10989, United States

T: +1-347-918-3531

MEA

Future Market Insights

1602-6 Jumeirah Bay X2 Tower, Plot No: JLT-PH2-X2A,
Jumeirah Lakes Towers, Dubai,
United Arab Emirates

Europe

Future Market Insights

3rd Floor, 207 Regent Street,
W1B 3HH London
United Kingdom

T: + 44 (0) 20 8123 9659
D: +44 (0) 20 3287 4268

Asia Pacific

Future Market Insights

IndiaLand Global Tech Park, Unit UG-1, Behind Grand HighStreet, Phase 1, Hinjawadi, MH, Pune – 411057, India

Hybrid Cloud Storage Market Outlook (2022 to 2032)

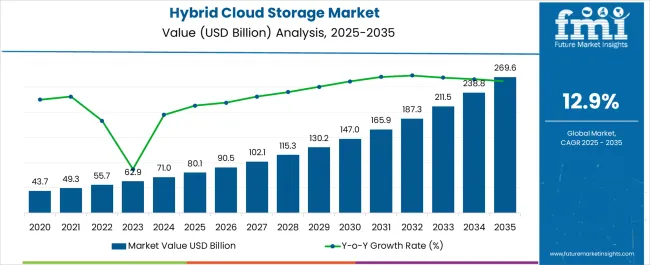
The global hybrid cloud storage market garnered a market value of US$ 55,678.0 Million in 2022 and is expected to accumulate a market value of US$ 1,87,982 Million by 2032 registering a CAGR of 12.9% in the forecast period 2022 to 2032.

Factors behind this massive market expansion are:

  • Rising demand for agile, cost-effective, and flexible computing
  • Interoperability standards for existing systems and cloud services are highly in demand
  • Increasing digitalization and extensive use of cloud computing services
  • The rise of hybrid IT services
  • Improving the IT infrastructure and expanding the use of Software-as-a-Service (SaaS) and multi-cloud environments
  • Organizations are provided with increased security, flexibility, stability, quicker data recovery, and decreased latency.
Report Attribute Details
Expected Market Value (2022) US$ 55,678.0 Million
Anticipated Forecast Value (2032) US$ 1,87,982 Million
Projected Growth Rate (2022 to 2032) 12.9% CAGR

Don't pay for what you don't need

Customize your report by selecting specific countries or regions and save 30%!

The existence of Leading Service Providers in North America is Supporting Market Expansion

The hybrid cloud storage market size in North America is anticipated to be the greatest due to the thriving IT sector in the countries of this region. The presence of a dynamic corporate environment, the rising use of numerous cloud services for cost savings, and an unavoidable need to improve productivity and efficiency through centralized cloud governance are the key reasons that will continue to propel the growth of the hybrid cloud storage market.

Numerous local businesses are transitioning from the public cloud to a new age of hybrid IT, which mixes the public cloud, private cloud, and conventional IT. These businesses have adopted a hybrid cloud approach, which helps them grow their operations and provide customer service. Government policies in the nations in this region support digitization as well, which has fueled the growth of the global hybrid cloud storage market in this region.

Research released by Stormforge in April 2021 states that 18% of North American respondents indicated that their company spends between $100,000 and $250,000 per month on cloud computing. In addition, 44% of respondents anticipate a little rise in cloud spending over the coming year, while another 32% predict a considerable increase in cloud spending for their firm over the same period. Additionally, vendors are supporting the hybrid approach in a variety of ways. Companies in North America are actively engaged in strategic mergers and acquisitions. For instance, to improve its cloud offerings, American technology giant IBM purchased Sanovi Technologies. Sanovi offers business continuity, cloud migration, and hybrid cloud recovery software for corporate data centers and cloud infrastructure.

Product Expansions and Launches are Common Market Events

There are several significant participants in the extremely fragmented hybrid cloud industry. Few big firms now control the majority of the industry in terms of market share. These significant industry participants are concentrating on growing their consumer base internationally. These businesses use tactical joint ventures to raise their market share and profitability. For instance, Citrix Systems and Google Cloud announced a new partnership in October 2021, as part of which Citrix would introduce a new Desktop-as-a-Service (DaaS) product on Google Cloud.

To support the smooth delivery of virtualized apps and desktops on Google Cloud, the service makes use of Citrix's management plan and HDX protocol. To improve the capabilities of their products, industry players are also buying up startups developing hybrid cloud technology. New players in the hybrid cloud storage market are concentrating on providing hybrid cloud storage services, primarily for business and financial services.

Advanced storage solutions are being introduced by several international service providers to make data availability and accessibility across hybrid clouds simpler. The businesses are concentrating on providing streamlined hybrid storage systems. For instance, For HPE GreenLake, the company's flagship product that enables businesses to update all of their apps and data, Hewlett Packard Enterprise introduced platform upgrades and new cloud services in June 2022. This includes a contemporary private cloud that has been reinvented and offers a cloud-native experience to enable any organization's hybrid approach, regardless of location.

Challenges such as keeping a secure backup and lack of storage space on either a cloud or on-premise were eliminated with the introduction of hybrid cloud storage as hybrid cloud storage, in integration, uses both on-premises and cloud storage services.

Hybrid cloud storage supplements on-premise storage in addition to public cloud storage by keeping frequently used data on-premise while storing inactive data on the cloud simultaneously. Hybrid cloud storage, henceforth, enables flexibility in operation and efficiently undergoes the process of transferring data between the two environments.

Sudip Saha
Sudip Saha

Principal Consultant

Talk to Analyst

Find your sweet spots for generating winning opportunities in this market.

Which are Some Prominent Drivers of Hybrid Cloud Storage Market?

Different organizations use hybrid cloud storage differently. For some hybrid cloud storage is a mediator between their on-site data storage and public cloud, while for some hybrid cloud storage leverages the scalability of cloud computing to have an access to a more stable and flexible storage platform.

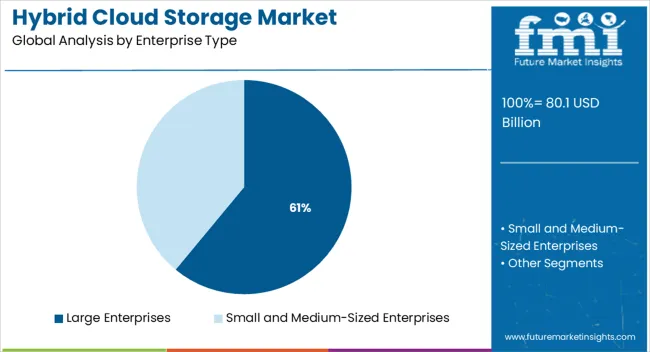
Hybrid Cloud storage is widely adopted by enterprises whose volume of storage is considerably high. Furthermore, due to several benefits offered, high demand for hybrid cloud storage is witnessed by both large and small & medium-sized enterprises.

Low costs associated with an enterprise hybrid cloud storage solution, due to its consolidated storage infrastructure and automated data management, are a major factor driving the growth of the hybrid cloud storage market.

Added security offered to enterprises is the primary reason for the high demand witnessed, for hybrid cloud storage. In addition to this, added features such as flexibility, stability, faster data recovery, and reduced latency are expected to drive the overall hybrid cloud storage market.

What are the Challenges Faced by the Hybrid Cloud Storage Market?

The complexity observed in maintaining an efficient network across both cloud and on-premise is one of the restraining factors for the hybrid cloud storage market. Additionally, compatibility across dual levels of infrastructure to run different stacks efficiently is another major challenge faced by hybrid cloud storage.

Certain geographical locations do not possess a strong network bandwidth to support the integration of hybrid cloud storage systems, thus impeding the growth of the market.

Get the data you need at a Fraction of the cost

Personalize your report by choosing insights you need
and save 40%!

Qualities of Hybrid Cloud Storage Systems Accelerating Growth of the Market in North America?

End-user industries present in the USA and Canada are relying on private clouds and public clouds. The increasing dependency on the same for completing various tasks such as data collection and retrieving information is augmenting the growth of the hybrid cloud storage market. In addition, companies such as IBM, HudsonAlpha, and VMWare are creating lucrative opportunities for hybrid cloud storage in North America.

Owing to the above-mentioned reasons, North America is expected to hold a 32.2% market share for the hybrid cloud storage market in 2022.

End User Sectors Bolstering Demand for Hybrid Cloud Storage Market in Europe?

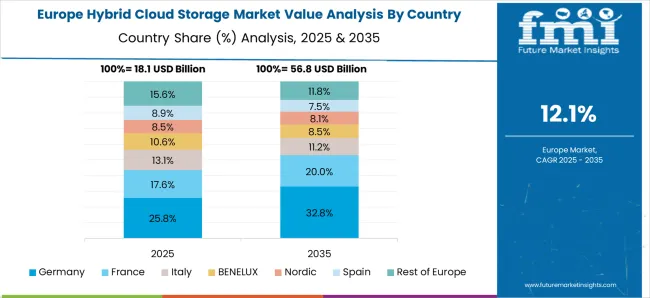
Europe is a hub of technological advancement. The strong presence of the IT industry, healthcare sector, and the automotive sector has increased the demand for hybrid cloud storage systems. Moreover, digitalization and automation especially in countries like the United Kingdom. and Germany is augmenting its reliance on the hybrid cloud storage market.

Due to the reasons mentioned above, Europe is expected to possess a 24.7% market share for the hybrid cloud storage market in 2022.

Customization of Hybrid Cloud Storage Systems Favoring Growth of Market in Asia Pacific?

Growing internet penetration along with customization of hybrid cloud services is favoring the growth of the hybrid cloud storage market, especially in India and China. In addition, the increasing population and end-user industries in the Asia Pacific region are propelling the growth of hybrid cloud storage systems as they offer a secure space for storing and maintaining information.

Asia Pacific is expected to procure a 27% market share for the hybrid cloud storage market in 2022.

Start-ups for Hybrid Cloud Storage Market

Some of the key players in the hybrid cloud storage market are Virtustream, Hewlett Packard Enterprise, Gigas, Stratoscale, and Quali
  • Hewlett Packard Enterprise, a key start-up player in the hybrid cloud storage market is focusing on offering hybrid cloud storage services mainly to enterprise and financial services.

Market Competition

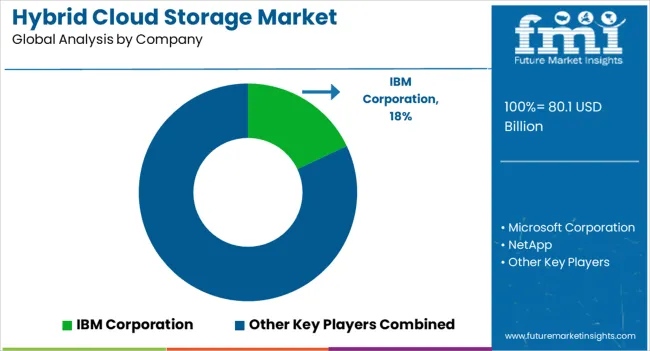
Some of the key players in the hybrid cloud storage market are IBM Corporation, Microsoft Corporation, NetApp, Amazon Web Services, Inc., VMware, Inc., Micro Focus, Google Cloud Platform, Dell Inc., Rackspace, Inc., Panzura, Spectra Logic Corporation, Cloudian, and Quantum Corporation.

  • In April 2021, IBM Corporation launched advanced storage solutions to simplify data accessibility and availability across hybrid clouds. The company is focusing on offering simplified hybrid storage systems.

Report Scope

Report Attribute Details
Market Value in 2022 US$ 55,678.0 Million
Market Value in 2032 US$ 1,87,982 Million
Growth Rate CAGR of 12.9% from 2022 to 2032
Base Year for Estimation 2021
Historical Data 2016 to 2021
Forecast Period 2022 to 2032
Quantitative Units Revenue in USD Million and CAGR from 2022 to 2032
Report Coverage Revenue Forecast, Volume Forecast, Company Ranking, Competitive Landscape, Growth Factors, Trends, and Pricing Analysis
Segments Covered
  • Enterprise Type
  • Industry Verticals
  • Region
Regions Covered
  • North America
  • Latin America
  • Western Europe
  • Eastern Europe
  • Asia Pacific Excluding Japan
  • Japan
  • Middle East and Africa
Key Countries Profiled
  • United States of America
  • Canada
  • Brazil
  • Argentina
  • Germany
  • United Kingdom
  • France
  • Spain
  • Italy
  • Nordics
  • BENELUX
  • Australia & New Zealand
  • China
  • India
  • ASIAN
  • GCC Countries
  • South Africa
Key Companies Profiled
  • IBM Corporation
  • Microsoft Corporation
  • NetApp
  • Amazon Web Services, Inc.
  • VMware Inc.
  • Micro Focus
  • Google Cloud Platform
  • Dell Inc.
  • Rackspace, Inc.
  • Panzura, Spectra Logic Corporation
  • Cloudian
  • Quantum Corporation.
Customization Available Upon Request

Key Segments Profiled in the Hybrid Cloud Storage Industry Survey

Enterprise Type:

  • Large Enterprises
  • Small and Medium-Sized Enterprises

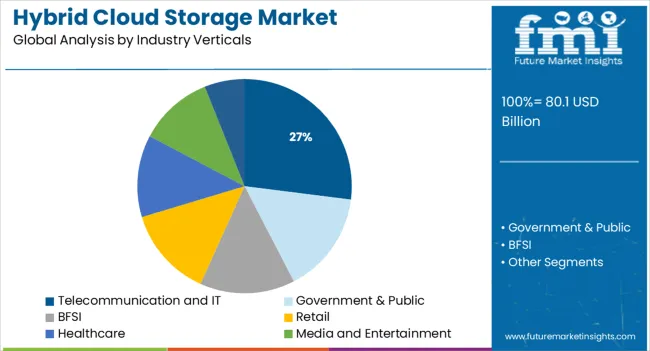
Industry Verticals:

  • Government & Public
  • BFSI
  • Retail
  • Healthcare
  • Telecommunication and IT
  • Media and Entertainment
  • Others

Region:

  • North America
  • Latin America
  • Western Europe
  • Eastern Europe
  • Asia Pacific Excluding Japan
  • Japan
  • Middle East & Africa

Frequently Asked Questions

What is the anticipated growth of the hybrid cloud storage market until 2032?

FMI projects the global hybrid cloud storage market to expand at a 12.9% value CAGR by 2032.

Which region is forecast to be the most lucrative for hybrid cloud storage market growth?

North America is expected to hold a 32.2% market share for the hybrid cloud storage market in 2022.

Which are some prominent hybrid cloud storage manufacturers?

IBM Corporation, Microsoft Corporation, NetApp, Amazon Web Services, Inc., VMware, Inc., Micro Focus, Google Cloud Platform, Dell Inc., Rackspace, Inc., Panzura, Spectra Logic Corporation, Cloudian, and Quantum Corporation are some prominent hybrid cloud storage manufacturers.

Table of Content

1. Executive Summary | Hybrid Cloud Storage Market

    1.1. Global Market Outlook

    1.2. Demand-side Trends

    1.3. Supply-side Trends

    1.4. Technology Roadmap Analysis

    1.5. Analysis and Recommendations

2. Market Overview

    2.1. Market Coverage / Taxonomy

    2.2. Market Definition / Scope / Limitations

3. Market Background

    3.1. Market Dynamics

        3.1.1. Drivers

        3.1.2. Restraints

        3.1.3. Opportunity

        3.1.4. Trends

    3.2. Scenario Forecast

        3.2.1. Demand in Optimistic Scenario

        3.2.2. Demand in Likely Scenario

        3.2.3. Demand in Conservative Scenario

    3.3. Opportunity Map Analysis

    3.4. Investment Feasibility Matrix

    3.5. PESTLE and Porter’s Analysis

    3.6. Regulatory Landscape

        3.6.1. By Key Regions

        3.6.2. By Key Countries

    3.7. Regional Parent Market Outlook

4. Global Market Analysis 2017 to 2021 and Forecast, 2022 to 2032

    4.1. Historical Market Size Value (US$ Million) Analysis, 2017 to 2021

    4.2. Current and Future Market Size Value (US$ Million) Projections, 2022 to 2032

        4.2.1. Y-o-Y Growth Trend Analysis

        4.2.2. Absolute $ Opportunity Analysis

5. Global Market Analysis 2017 to 2021 and Forecast 2022 to 2032, By Enterprise Type

    5.1. Introduction / Key Findings

    5.2. Historical Market Size Value (US$ Million) Analysis By Enterprise Type, 2017 to 2021

    5.3. Current and Future Market Size Value (US$ Million) Analysis and Forecast By Enterprise Type, 2022 to 2032

        5.3.1. Large Enterprises

        5.3.2. Small and Medium-Sized Enterprises

    5.4. Y-o-Y Growth Trend Analysis By Enterprise Type, 2017 to 2021

    5.5. Absolute $ Opportunity Analysis By Enterprise Type, 2022 to 2032

6. Global Market Analysis 2017 to 2021 and Forecast 2022 to 2032, By Industry Verticals

    6.1. Introduction / Key Findings

    6.2. Historical Market Size Value (US$ Million) Analysis By Industry Verticals, 2017 to 2021

    6.3. Current and Future Market Size Value (US$ Million) Analysis and Forecast By Industry Verticals, 2022 to 2032

        6.3.1. Government & Public

        6.3.2. BFSI

        6.3.3. Retail

        6.3.4. Healthcare

        6.3.5. Telecommunication and IT

        6.3.6. Media and Entertainment

        6.3.7. Others

    6.4. Y-o-Y Growth Trend Analysis By Industry Verticals, 2017 to 2021

    6.5. Absolute $ Opportunity Analysis By Industry Verticals, 2022 to 2032

7. Global Market Analysis 2017 to 2021 and Forecast 2022 to 2032, By Region

    7.1. Introduction

    7.2. Historical Market Size Value (US$ Million) Analysis By Region, 2017 to 2021

    7.3. Current Market Size Value (US$ Million) Analysis and Forecast By Region, 2022 to 2032

        7.3.1. North America

        7.3.2. Latin America

        7.3.3. Europe

        7.3.4. Asia Pacific

        7.3.5. Middle East and Africa

    7.4. Market Attractiveness Analysis By Region

8. North America Market Analysis 2017 to 2021 and Forecast 2022 to 2032, By Country

    8.1. Historical Market Size Value (US$ Million) Trend Analysis By Market Taxonomy, 2017 to 2021

    8.2. Market Size Value (US$ Million) Forecast By Market Taxonomy, 2022 to 2032

        8.2.1. By Country

            8.2.1.1. United States of America

            8.2.1.2. Canada

        8.2.2. By Enterprise Type

        8.2.3. By Industry Verticals

    8.3. Market Attractiveness Analysis

        8.3.1. By Country

        8.3.2. By Enterprise Type

        8.3.3. By Industry Verticals

    8.4. Key Takeaways

9. Latin America Market Analysis 2017 to 2021 and Forecast 2022 to 2032, By Country

    9.1. Historical Market Size Value (US$ Million) Trend Analysis By Market Taxonomy, 2017 to 2021

    9.2. Market Size Value (US$ Million) Forecast By Market Taxonomy, 2022 to 2032

        9.2.1. By Country

            9.2.1.1. Brazil

            9.2.1.2. Mexico

            9.2.1.3. Rest of Latin America

        9.2.2. By Enterprise Type

        9.2.3. By Industry Verticals

    9.3. Market Attractiveness Analysis

        9.3.1. By Country

        9.3.2. By Enterprise Type

        9.3.3. By Industry Verticals

    9.4. Key Takeaways

10. Europe Market Analysis 2017 to 2021 and Forecast 2022 to 2032, By Country

    10.1. Historical Market Size Value (US$ Million) Trend Analysis By Market Taxonomy, 2017 to 2021

    10.2. Market Size Value (US$ Million) Forecast By Market Taxonomy, 2022 to 2032

        10.2.1. By Country

            10.2.1.1. Germany

            10.2.1.2. United Kingdom

            10.2.1.3. France

            10.2.1.4. Spain

            10.2.1.5. Italy

            10.2.1.6. Rest of Europe

        10.2.2. By Enterprise Type

        10.2.3. By Industry Verticals

    10.3. Market Attractiveness Analysis

        10.3.1. By Country

        10.3.2. By Enterprise Type

        10.3.3. By Industry Verticals

    10.4. Key Takeaways

11. Asia Pacific Market Analysis 2017 to 2021 and Forecast 2022 to 2032, By Country

    11.1. Historical Market Size Value (US$ Million) Trend Analysis By Market Taxonomy, 2017 to 2021

    11.2. Market Size Value (US$ Million) Forecast By Market Taxonomy, 2022 to 2032

        11.2.1. By Country

            11.2.1.1. China

            11.2.1.2. Japan

            11.2.1.3. South Korea

            11.2.1.4. Malaysia

            11.2.1.5. Singapore

            11.2.1.6. Australia

            11.2.1.7. Rest of Asia Pacific

        11.2.2. By Enterprise Type

        11.2.3. By Industry Verticals

    11.3. Market Attractiveness Analysis

        11.3.1. By Country

        11.3.2. By Enterprise Type

        11.3.3. By Industry Verticals

    11.4. Key Takeaways

12. Middle East and Africa Market Analysis 2017 to 2021 and Forecast 2022 to 2032, By Country

    12.1. Historical Market Size Value (US$ Million) Trend Analysis By Market Taxonomy, 2017 to 2021

    12.2. Market Size Value (US$ Million) Forecast By Market Taxonomy, 2022 to 2032

        12.2.1. By Country

            12.2.1.1. GCC Countries

            12.2.1.2. South Africa

            12.2.1.3. Israel

            12.2.1.4. Rest of Middle East and Africa

        12.2.2. By Enterprise Type

        12.2.3. By Industry Verticals

    12.3. Market Attractiveness Analysis

        12.3.1. By Country

        12.3.2. By Enterprise Type

        12.3.3. By Industry Verticals

    12.4. Key Takeaways

13. Key Countries Market Analysis

    13.1. United Kingdom

        13.1.1. Pricing Analysis

        13.1.2. Market Share Analysis, 2021

            13.1.2.1. By Enterprise Type

            13.1.2.2. By Industry Verticals

    13.2. Canada

        13.2.1. Pricing Analysis

        13.2.2. Market Share Analysis, 2021

            13.2.2.1. By Enterprise Type

            13.2.2.2. By Industry Verticals

    13.3. Brazil

        13.3.1. Pricing Analysis

        13.3.2. Market Share Analysis, 2021

            13.3.2.1. By Enterprise Type

            13.3.2.2. By Industry Verticals

    13.4. Mexico

        13.4.1. Pricing Analysis

        13.4.2. Market Share Analysis, 2021

            13.4.2.1. By Enterprise Type

            13.4.2.2. By Industry Verticals

    13.5. Rest of Latin America

        13.5.1. Pricing Analysis

        13.5.2. Market Share Analysis, 2021

            13.5.2.1. By Enterprise Type

            13.5.2.2. By Industry Verticals

    13.6. Germany

        13.6.1. Pricing Analysis

        13.6.2. Market Share Analysis, 2021

            13.6.2.1. By Enterprise Type

            13.6.2.2. By Industry Verticals

    13.7. United Kingdom

        13.7.1. Pricing Analysis

        13.7.2. Market Share Analysis, 2021

            13.7.2.1. By Enterprise Type

            13.7.2.2. By Industry Verticals

    13.8. France

        13.8.1. Pricing Analysis

        13.8.2. Market Share Analysis, 2021

            13.8.2.1. By Enterprise Type

            13.8.2.2. By Industry Verticals

    13.9. Spain

        13.9.1. Pricing Analysis

        13.9.2. Market Share Analysis, 2021

            13.9.2.1. By Enterprise Type

            13.9.2.2. By Industry Verticals

    13.10. Italy

        13.10.1. Pricing Analysis

        13.10.2. Market Share Analysis, 2021

            13.10.2.1. By Enterprise Type

            13.10.2.2. By Industry Verticals

    13.11. Rest of Europe

        13.11.1. Pricing Analysis

        13.11.2. Market Share Analysis, 2021

            13.11.2.1. By Enterprise Type

            13.11.2.2. By Industry Verticals

    13.12. China

        13.12.1. Pricing Analysis

        13.12.2. Market Share Analysis, 2021

            13.12.2.1. By Enterprise Type

            13.12.2.2. By Industry Verticals

    13.13. Japan

        13.13.1. Pricing Analysis

        13.13.2. Market Share Analysis, 2021

            13.13.2.1. By Enterprise Type

            13.13.2.2. By Industry Verticals

    13.14. South Korea

        13.14.1. Pricing Analysis

        13.14.2. Market Share Analysis, 2021

            13.14.2.1. By Enterprise Type

            13.14.2.2. By Industry Verticals

    13.15. Malaysia

        13.15.1. Pricing Analysis

        13.15.2. Market Share Analysis, 2021

            13.15.2.1. By Enterprise Type

            13.15.2.2. By Industry Verticals

    13.16. Singapore

        13.16.1. Pricing Analysis

        13.16.2. Market Share Analysis, 2021

            13.16.2.1. By Enterprise Type

            13.16.2.2. By Industry Verticals

    13.17. Australia

        13.17.1. Pricing Analysis

        13.17.2. Market Share Analysis, 2021

            13.17.2.1. By Enterprise Type

            13.17.2.2. By Industry Verticals

    13.18. Rest of Asia Pacific

        13.18.1. Pricing Analysis

        13.18.2. Market Share Analysis, 2021

            13.18.2.1. By Enterprise Type

            13.18.2.2. By Industry Verticals

    13.19. GCC Countries

        13.19.1. Pricing Analysis

        13.19.2. Market Share Analysis, 2021

            13.19.2.1. By Enterprise Type

            13.19.2.2. By Industry Verticals

    13.20. South Africa

        13.20.1. Pricing Analysis

        13.20.2. Market Share Analysis, 2021

            13.20.2.1. By Enterprise Type

            13.20.2.2. By Industry Verticals

    13.21. Israel

        13.21.1. Pricing Analysis

        13.21.2. Market Share Analysis, 2021

            13.21.2.1. By Enterprise Type

            13.21.2.2. By Industry Verticals

    13.22. Rest of the Middle East and Africa

        13.22.1. Pricing Analysis

        13.22.2. Market Share Analysis, 2021

            13.22.2.1. By Enterprise Type

            13.22.2.2. By Industry Verticals

14. Market Structure Analysis

    14.1. Competition Dashboard

    14.2. Competition Benchmarking

    14.3. Market Share Analysis of Top Players

        14.3.1. By Regional

        14.3.2. By Enterprise Type

        14.3.3. By Industry Verticals

15. Competition Analysis

    15.1. Competition Deep Dive

        15.1.1. IBM Corporation

            15.1.1.1. Overview

            15.1.1.2. Product Portfolio

            15.1.1.3. Profitability by Market Segments

            15.1.1.4. Sales Footprint

            15.1.1.5. Strategy Overview

                15.1.1.5.1. Marketing Strategy

        15.1.2. Microsoft Corporation

            15.1.2.1. Overview

            15.1.2.2. Product Portfolio

            15.1.2.3. Profitability by Market Segments

            15.1.2.4. Sales Footprint

            15.1.2.5. Strategy Overview

                15.1.2.5.1. Marketing Strategy

        15.1.3. NetApp

            15.1.3.1. Overview

            15.1.3.2. Product Portfolio

            15.1.3.3. Profitability by Market Segments

            15.1.3.4. Sales Footprint

            15.1.3.5. Strategy Overview

                15.1.3.5.1. Marketing Strategy

        15.1.4. Amazon Web Services, Inc

            15.1.4.1. Overview

            15.1.4.2. Product Portfolio

            15.1.4.3. Profitability by Market Segments

            15.1.4.4. Sales Footprint

            15.1.4.5. Strategy Overview

                15.1.4.5.1. Marketing Strategy

        15.1.5. VMware, Inc.

            15.1.5.1. Overview

            15.1.5.2. Product Portfolio

            15.1.5.3. Profitability by Market Segments

            15.1.5.4. Sales Footprint

            15.1.5.5. Strategy Overview

                15.1.5.5.1. Marketing Strategy

        15.1.6. Micro Focus

            15.1.6.1. Overview

            15.1.6.2. Product Portfolio

            15.1.6.3. Profitability by Market Segments

            15.1.6.4. Sales Footprint

            15.1.6.5. Strategy Overview

                15.1.6.5.1. Marketing Strategy

        15.1.7. Google Cloud Platform

            15.1.7.1. Overview

            15.1.7.2. Product Portfolio

            15.1.7.3. Profitability by Market Segments

            15.1.7.4. Sales Footprint

            15.1.7.5. Strategy Overview

                15.1.7.5.1. Marketing Strategy

        15.1.8. Dell Inc

            15.1.8.1. Overview

            15.1.8.2. Product Portfolio

            15.1.8.3. Profitability by Market Segments

            15.1.8.4. Sales Footprint

            15.1.8.5. Strategy Overview

                15.1.8.5.1. Marketing Strategy

        15.1.9. Rackspace, Inc

            15.1.9.1. Overview

            15.1.9.2. Product Portfolio

            15.1.9.3. Profitability by Market Segments

            15.1.9.4. Sales Footprint

            15.1.9.5. Strategy Overview

                15.1.9.5.1. Marketing Strategy

        15.1.10. Panzura

            15.1.10.1. Overview

            15.1.10.2. Product Portfolio

            15.1.10.3. Profitability by Market Segments

            15.1.10.4. Sales Footprint

            15.1.10.5. Strategy Overview

                15.1.10.5.1. Marketing Strategy

        15.1.11. Spectra Logic Corporation

            15.1.11.1. Overview

            15.1.11.2. Product Portfolio

            15.1.11.3. Profitability by Market Segments

            15.1.11.4. Sales Footprint

            15.1.11.5. Strategy Overview

                15.1.11.5.1. Marketing Strategy

        15.1.12. Cloudian

            15.1.12.1. Overview

            15.1.12.2. Product Portfolio

            15.1.12.3. Profitability by Market Segments

            15.1.12.4. Sales Footprint

            15.1.12.5. Strategy Overview

                15.1.12.5.1. Marketing Strategy

        15.1.13. Quantum Corporation

            15.1.13.1. Overview

            15.1.13.2. Product Portfolio

            15.1.13.3. Profitability by Market Segments

            15.1.13.4. Sales Footprint

            15.1.13.5. Strategy Overview

                15.1.13.5.1. Marketing Strategy

16. Assumptions & Acronyms Used

17. Research Methodology

List of Tables

Table 1: Global Market Value (US$ Million) Forecast by Region, 2017 to 2032

Table 2: Global Market Value (US$ Million) Forecast by Enterprise Type, 2017 to 2032

Table 3: Global Market Value (US$ Million) Forecast by Industry Verticals, 2017 to 2032

Table 4: North America Market Value (US$ Million) Forecast by Country, 2017 to 2032

Table 5: North America Market Value (US$ Million) Forecast by Enterprise Type, 2017 to 2032

Table 6: North America Market Value (US$ Million) Forecast by Industry Verticals, 2017 to 2032

Table 7: Latin America Market Value (US$ Million) Forecast by Country, 2017 to 2032

Table 8: Latin America Market Value (US$ Million) Forecast by Enterprise Type, 2017 to 2032

Table 9: Latin America Market Value (US$ Million) Forecast by Industry Verticals, 2017 to 2032

Table 10: Europe Market Value (US$ Million) Forecast by Country, 2017 to 2032

Table 11: Europe Market Value (US$ Million) Forecast by Enterprise Type, 2017 to 2032

Table 12: Europe Market Value (US$ Million) Forecast by Industry Verticals, 2017 to 2032

Table 13: Asia Pacific Market Value (US$ Million) Forecast by Country, 2017 to 2032

Table 14: Asia Pacific Market Value (US$ Million) Forecast by Enterprise Type, 2017 to 2032

Table 15: Asia Pacific Market Value (US$ Million) Forecast by Industry Verticals, 2017 to 2032

Table 16: Middle East and Africa Market Value (US$ Million) Forecast by Country, 2017 to 2032

Table 17: Middle East and Africa Market Value (US$ Million) Forecast by Enterprise Type, 2017 to 2032

Table 18: Middle East and Africa Market Value (US$ Million) Forecast by Industry Verticals, 2017 to 2032

List of Charts

Figure 1: Global Market Value (US$ Million) by Enterprise Type, 2022 to 2032

Figure 2: Global Market Value (US$ Million) by Industry Verticals, 2022 to 2032

Figure 3: Global Market Value (US$ Million) by Region, 2022 to 2032

Figure 4: Global Market Value (US$ Million) Analysis by Region, 2017 to 2032

Figure 5: Global Market Value Share (%) and BPS Analysis by Region, 2022 to 2032

Figure 6: Global Market Y-o-Y Growth (%) Projections by Region, 2022 to 2032

Figure 7: Global Market Value (US$ Million) Analysis by Enterprise Type, 2017 to 2032

Figure 8: Global Market Value Share (%) and BPS Analysis by Enterprise Type, 2022 to 2032

Figure 9: Global Market Y-o-Y Growth (%) Projections by Enterprise Type, 2022 to 2032

Figure 10: Global Market Value (US$ Million) Analysis by Industry Verticals, 2017 to 2032

Figure 11: Global Market Value Share (%) and BPS Analysis by Industry Verticals, 2022 to 2032

Figure 12: Global Market Y-o-Y Growth (%) Projections by Industry Verticals, 2022 to 2032

Figure 13: Global Market Attractiveness by Enterprise Type, 2022 to 2032

Figure 14: Global Market Attractiveness by Industry Verticals, 2022 to 2032

Figure 15: Global Market Attractiveness by Region, 2022 to 2032

Figure 16: North America Market Value (US$ Million) by Enterprise Type, 2022 to 2032

Figure 17: North America Market Value (US$ Million) by Industry Verticals, 2022 to 2032

Figure 18: North America Market Value (US$ Million) by Country, 2022 to 2032

Figure 19: North America Market Value (US$ Million) Analysis by Country, 2017 to 2032

Figure 20: North America Market Value Share (%) and BPS Analysis by Country, 2022 to 2032

Figure 21: North America Market Y-o-Y Growth (%) Projections by Country, 2022 to 2032

Figure 22: North America Market Value (US$ Million) Analysis by Enterprise Type, 2017 to 2032

Figure 23: North America Market Value Share (%) and BPS Analysis by Enterprise Type, 2022 to 2032

Figure 24: North America Market Y-o-Y Growth (%) Projections by Enterprise Type, 2022 to 2032

Figure 25: North America Market Value (US$ Million) Analysis by Industry Verticals, 2017 to 2032

Figure 26: North America Market Value Share (%) and BPS Analysis by Industry Verticals, 2022 to 2032

Figure 27: North America Market Y-o-Y Growth (%) Projections by Industry Verticals, 2022 to 2032

Figure 28: North America Market Attractiveness by Enterprise Type, 2022 to 2032

Figure 29: North America Market Attractiveness by Industry Verticals, 2022 to 2032

Figure 30: North America Market Attractiveness by Country, 2022 to 2032

Figure 31: Latin America Market Value (US$ Million) by Enterprise Type, 2022 to 2032

Figure 32: Latin America Market Value (US$ Million) by Industry Verticals, 2022 to 2032

Figure 33: Latin America Market Value (US$ Million) by Country, 2022 to 2032

Figure 34: Latin America Market Value (US$ Million) Analysis by Country, 2017 to 2032

Figure 35: Latin America Market Value Share (%) and BPS Analysis by Country, 2022 to 2032

Figure 36: Latin America Market Y-o-Y Growth (%) Projections by Country, 2022 to 2032

Figure 37: Latin America Market Value (US$ Million) Analysis by Enterprise Type, 2017 to 2032

Figure 38: Latin America Market Value Share (%) and BPS Analysis by Enterprise Type, 2022 to 2032

Figure 39: Latin America Market Y-o-Y Growth (%) Projections by Enterprise Type, 2022 to 2032

Figure 40: Latin America Market Value (US$ Million) Analysis by Industry Verticals, 2017 to 2032

Figure 41: Latin America Market Value Share (%) and BPS Analysis by Industry Verticals, 2022 to 2032

Figure 42: Latin America Market Y-o-Y Growth (%) Projections by Industry Verticals, 2022 to 2032

Figure 43: Latin America Market Attractiveness by Enterprise Type, 2022 to 2032

Figure 44: Latin America Market Attractiveness by Industry Verticals, 2022 to 2032

Figure 45: Latin America Market Attractiveness by Country, 2022 to 2032

Figure 46: Europe Market Value (US$ Million) by Enterprise Type, 2022 to 2032

Figure 47: Europe Market Value (US$ Million) by Industry Verticals, 2022 to 2032

Figure 48: Europe Market Value (US$ Million) by Country, 2022 to 2032

Figure 49: Europe Market Value (US$ Million) Analysis by Country, 2017 to 2032

Figure 50: Europe Market Value Share (%) and BPS Analysis by Country, 2022 to 2032

Figure 51: Europe Market Y-o-Y Growth (%) Projections by Country, 2022 to 2032

Figure 52: Europe Market Value (US$ Million) Analysis by Enterprise Type, 2017 to 2032

Figure 53: Europe Market Value Share (%) and BPS Analysis by Enterprise Type, 2022 to 2032

Figure 54: Europe Market Y-o-Y Growth (%) Projections by Enterprise Type, 2022 to 2032

Figure 55: Europe Market Value (US$ Million) Analysis by Industry Verticals, 2017 to 2032

Figure 56: Europe Market Value Share (%) and BPS Analysis by Industry Verticals, 2022 to 2032

Figure 57: Europe Market Y-o-Y Growth (%) Projections by Industry Verticals, 2022 to 2032

Figure 58: Europe Market Attractiveness by Enterprise Type, 2022 to 2032

Figure 59: Europe Market Attractiveness by Industry Verticals, 2022 to 2032

Figure 60: Europe Market Attractiveness by Country, 2022 to 2032

Figure 61: Asia Pacific Market Value (US$ Million) by Enterprise Type, 2022 to 2032

Figure 62: Asia Pacific Market Value (US$ Million) by Industry Verticals, 2022 to 2032

Figure 63: Asia Pacific Market Value (US$ Million) by Country, 2022 to 2032

Figure 64: Asia Pacific Market Value (US$ Million) Analysis by Country, 2017 to 2032

Figure 65: Asia Pacific Market Value Share (%) and BPS Analysis by Country, 2022 to 2032

Figure 66: Asia Pacific Market Y-o-Y Growth (%) Projections by Country, 2022 to 2032

Figure 67: Asia Pacific Market Value (US$ Million) Analysis by Enterprise Type, 2017 to 2032

Figure 68: Asia Pacific Market Value Share (%) and BPS Analysis by Enterprise Type, 2022 to 2032

Figure 69: Asia Pacific Market Y-o-Y Growth (%) Projections by Enterprise Type, 2022 to 2032

Figure 70: Asia Pacific Market Value (US$ Million) Analysis by Industry Verticals, 2017 to 2032

Figure 71: Asia Pacific Market Value Share (%) and BPS Analysis by Industry Verticals, 2022 to 2032

Figure 72: Asia Pacific Market Y-o-Y Growth (%) Projections by Industry Verticals, 2022 to 2032

Figure 73: Asia Pacific Market Attractiveness by Enterprise Type, 2022 to 2032

Figure 74: Asia Pacific Market Attractiveness by Industry Verticals, 2022 to 2032

Figure 75: Asia Pacific Market Attractiveness by Country, 2022 to 2032

Figure 76: Middle East and Africa Market Value (US$ Million) by Enterprise Type, 2022 to 2032

Figure 77: Middle East and Africa Market Value (US$ Million) by Industry Verticals, 2022 to 2032

Figure 78: Middle East and Africa Market Value (US$ Million) by Country, 2022 to 2032

Figure 79: Middle East and Africa Market Value (US$ Million) Analysis by Country, 2017 to 2032

Figure 80: Middle East and Africa Market Value Share (%) and BPS Analysis by Country, 2022 to 2032

Figure 81: Middle East and Africa Market Y-o-Y Growth (%) Projections by Country, 2022 to 2032

Figure 82: Middle East and Africa Market Value (US$ Million) Analysis by Enterprise Type, 2017 to 2032

Figure 83: Middle East and Africa Market Value Share (%) and BPS Analysis by Enterprise Type, 2022 to 2032

Figure 84: Middle East and Africa Market Y-o-Y Growth (%) Projections by Enterprise Type, 2022 to 2032

Figure 85: Middle East and Africa Market Value (US$ Million) Analysis by Industry Verticals, 2017 to 2032

Figure 86: Middle East and Africa Market Value Share (%) and BPS Analysis by Industry Verticals, 2022 to 2032

Figure 87: Middle East and Africa Market Y-o-Y Growth (%) Projections by Industry Verticals, 2022 to 2032

Figure 88: Middle East and Africa Market Attractiveness by Enterprise Type, 2022 to 2032

Figure 89: Middle East and Africa Market Attractiveness by Industry Verticals, 2022 to 2032

Figure 90: Middle East and Africa Market Attractiveness by Country, 2022 to 2032

Recommendations

Technology

Cloud Systems Management Software Market

Published : January 2023

Healthcare

Cloud Based Drug Discovery Platform Market

Published : October 2022

Technology

Cloud-RAN (Radio Access Network) Market

Published : September 2022

Technology

Cloud Business Email Market

Published : August 2017

Explore Technology Insights

View Reports

Hybrid Cloud Storage Market