The enterprise data management market is valued at USD 119.1 billion in 2025 and is expected to reach USD 266.8 billion by 2035, growing at a CAGR of 8.4%. Market expansion is driven by the increasing need for data integration across industries, the growing adoption of cloud-based solutions, and the demand for unified data governance across enterprise ecosystems. Software solutions dominate the market, holding a 61.8% share in 2025, due to their ability to centralize data management, ensure compliance, and support real-time analytics. The healthcare and life sciences vertical leads with a 22.9% share in 2025, supported by the rising digitalization of healthcare records, the need for precision in research data, and regulatory pressures around patient data protection. As enterprises increasingly embrace AI, IoT, and big data technologies, demand for comprehensive data management platforms intensifies across verticals such as BFSI, manufacturing, and retail.
Growth is also reinforced by the widespread adoption of data security and privacy measures, driven by increasing cybersecurity risks and the need for businesses to protect sensitive information. While challenges such as data security concerns, integration complexities, and high costs of implementation remain, industry leaders including IBM, SAP, Oracle, and SAS Institute are continuously advancing solutions to enhance scalability, data quality, and operational efficiency. As global enterprises focus on digital transformation, the demand for integrated, secure, and intelligent data management solutions is expected to remain high.
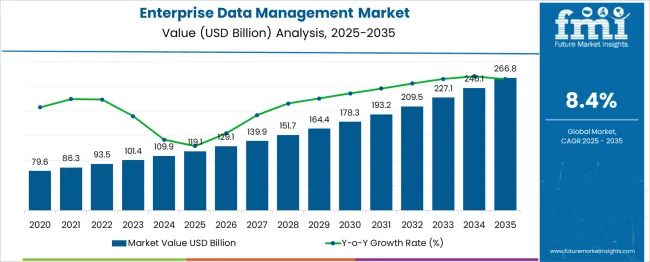
| Metric | Value |
|---|---|
| Enterprise Data Management Market Estimated Value in (2025 E) | USD 119.1 billion |
| Enterprise Data Management Market Forecast Value in (2035 F) | USD 266.8 billion |
| Forecast CAGR (2025 to 2035) | 8.4% |
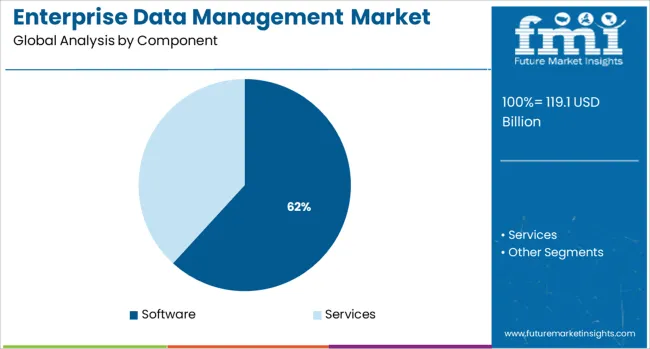
The software segment is projected to hold 61.8% of the market share in 2025, positioning it as the dominant category within the enterprise data management space. The growing complexity of enterprise data systems and the increasing need for integrated, scalable solutions have contributed to the widespread adoption of software tools that streamline data governance, quality control, and integration across diverse platforms. These solutions are crucial in enabling organizations to unify their data assets, enhance analytics capabilities, and ensure compliance with global data protection regulations. With increasing reliance on cloud platforms, AI-driven data solutions, and IoT-enabled devices, enterprises are increasingly prioritizing software that can integrate data across different environments and applications. The software segment benefits from advancements in machine learning and predictive analytics that allow for better data-driven decision-making. As businesses focus on leveraging data to improve operational performance, software continues to be the core driver of growth in the enterprise data management market.
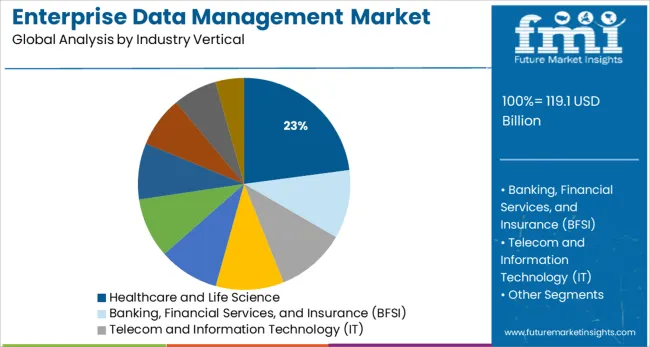
The healthcare and life sciences vertical is expected to account for 22.9% of the enterprise data management market share in 2025, making it the leading industry vertical. The rapid digital transformation of healthcare, driven by the adoption of electronic health records, telemedicine, and precision medicine, has created an increasing need for efficient data management systems to handle large volumes of sensitive patient data. Healthcare organizations are under growing pressure to ensure the security, interoperability, and scalability of their data systems to comply with stringent regulations such as HIPAA and GDPR. Furthermore, the increasing volume of clinical data from research, trials, and diagnostics is driving demand for unified data platforms that can provide real-time access to patient information and enable improved clinical outcomes. With healthcare organizations focusing on data integration, storage, and security, the healthcare and life sciences vertical remains a major contributor to the market, supporting the continued growth of enterprise data management solutions.
The increasing inclination of organizations toward data integration is expected to play a salient role in driving the market in the forecast period. Enterprises adopt various data integration tools across several applications that boost digital transformation.
Therefore, enterprises are focusing to develop better tools to manage and store data. In May 2025, Google Cloud developed cloud and edge systems focused to assist manufacturers to enhance operation efficiency by collecting soiled assets, process, and standardized data.
The tool is assisted by manufacturing analytics and insights, machine-level anomaly, and predictive maintenance. Such initiatives are expected to benefit the enterprise data management market in the forthcoming period.
In addition, the advent of the Industrial Internet of Things (IIoT) is expected to drive the market during the time span of 2025 to 2035. As per a report published by Analytics Insight 2024, with the rise of IIoT, the demand for data integration has increased considerably. The IIoT and data integration platforms work together to produce a digital supply chain that enables players to regulate players to offer raw materials to the plant and finished goods to consumers.
Furthermore, other benefits such as; access to high-data quality for appropriate analysis, assuring the security of data, consolidation of data across various sources for enhanced efficiency, and consistency of data architecture that scales with the organization, among others, are likely to augment the market size in the forecast period. Owing to such factors, the market is set to flourish in the coming period.
The incorporation of the cloud with data integration is expected to offer remunerative opportunities for expansion to the global enterprise data management market. As per an article published by NetApp in January 2024, a USA-based hybrid cloud data services and data management company, there has been an increased demand to incorporate heterogeneous cloud systems.
The incorporation of software is based on analytical models that regulate the massive amount of data. The demand for data regulation can be monitored by cloud technology in a secure environment at a low cost. The benefits offered have motivated players to collaborate with each other, which has augmented the market size. For instance, in April 2025, Crux, a renowned player in external data integration solutions, announced that it had extended its partnership with Google Cloud. Google Cloud also announced the launch of Analytics Hub, which is a data exchange platform that enables one to securely exchange data assets across organizations to acknowledge challenges of data reliability and cost.
Evolved technologies such as; AWS or an OpenStack data center are focused on data integration and integrity software within public cloud platforms. Owing to such positive factors, the market is likely to witness significant remunerative opportunities for expansion in the assessment tenure.
Growing concerns about data security are likely to limit the market growth in the forecast period. The platform is vulnerable and can be encroached on by hackers.
As per a report published by Empeek OU in February 2024, among the most significant obstacles to data integration in the healthcare sector, about 94% reported data security.
Also, the growing accessibility and presence of open-source solutions are expected to hinder market expansion in the forecast period. In addition, efficient handling of large data, compliance, and privacy requirements are other causes that can hinder industry growth.
However, with increasing demand for risk management and software among enterprises, the market is expected to witness significant opportunities, which will also act as a counter to the impeding cause and propel the market growth in the forecast period.
Based on components, the global enterprise data management market can be segregated into software and services. As per the analysis, the global enterprise data management market is dominated by software. The segment is estimated to record a CAGR of 7.6% in the forecast period.
This software helps organizations in augmenting their revenue by monitoring production, thereby, attracting clients. Also, there has been a significant rise in the number of startups and small and medium-sized businesses.
These enterprises opt for data management software to expand their reach and augment their revenue. Owing to such factors, the segment is likely to expand significantly.
What Growth Prospects will unravel across the USA market?
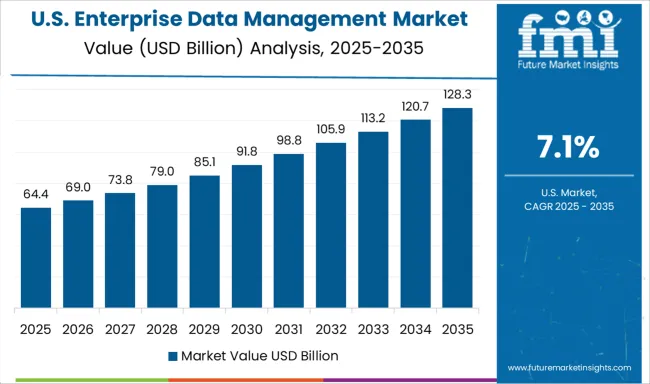
According to FMI, the global enterprise data management market is expected to be dominated by North America. Among all, the USA is projected to lead the regional market during the timeframe of 2025 to 2035. The country is likely to garner USD 72.8 Billion while expanding at a CAGR of 8.1% in the forecast period.
Growth of the region can be attributed to the increasing focus of established companies such as; Amazon Web Services, IBM, and Oracle, among others, towards the adoption of next-generation technologies big data analytics, IoT, AI, and machine learning.
Besides, increasing investment of end-users in cloud services is likely to propel the industry in the forecast period. In addition, with increasing partnerships and acquisitions, the market is likely to flourish notably in the assessment period. For instance, in May 2024, a USA-based data integrity company, Precisely, completed the acquisition of Infogix, a data quality vendor. Such initiatives are likely to benefit the market in the region, thereby, expanding the market reach in the assessment period.
How will Asia Pacific countries fare in the Enterprise Data Management Market?
Asia Pacific is anticipated to be the most lucrative market in the forecast period. As per the analysis, China is projected to dominate the industry in the assessment period. The country is estimated at a market value of USD 119.1 Billion while recording a CAGR of 7.7% from 2025 to 2035. The development of the regional market can be attributed to the presence of various small players.
Also, there has been a significant influx of demand for the end-user sectors such as; healthcare, BFSI, and others. Moreover, there has been a rise in investment among players in the market, which is likely to strengthen the market in the forecast period. In addition, the contribution of developing countries such as; Japan, India, and South Korea is of significance. According to FMI, Japan and South Korea have been estimated at a market value of USD 11.8 Billion and USD 7.3 Billion while recording a CAGR of 7% and 6% during the stint of 2025 to 2035.
| Country | Estimated CAGR |
|---|---|
| USA | 8.1% |
| UK | 7.4% |
| China | 7.7% |
| Japan | 7% |
| South Korea | 6% |
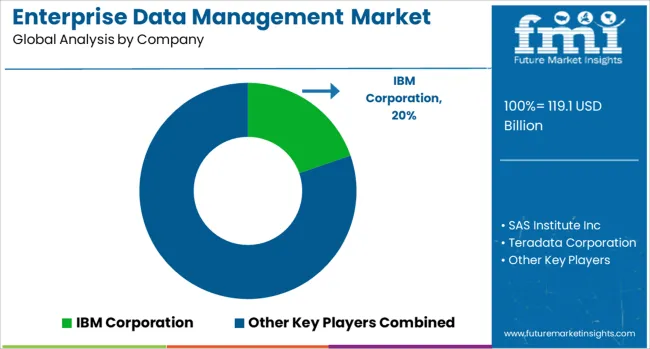
Key players in the global enterprise data management market include SAS Institute Inc., IBM Corporation, Oracle Corporation, Teradata Corporation, and SAP SE, among others. Recent developments in the industry are:
The global enterprise data management market is estimated to be valued at USD 119.1 billion in 2025.
The market size for the enterprise data management market is projected to reach USD 266.8 billion by 2035.
The enterprise data management market is expected to grow at a 8.4% CAGR between 2025 and 2035.
The key product types in enterprise data management market are software, _data security, _master data management, _data integration, _data migration, _data warehousing, _data governance, _data quality, _others, services, _managed services and _professional services.
In terms of industry vertical, healthcare and life science segment to command 22.9% share in the enterprise data management market in 2025.


Our Research Products

The "Full Research Suite" delivers actionable market intel, deep dives on markets or technologies, so clients act faster, cut risk, and unlock growth.

The Leaderboard benchmarks and ranks top vendors, classifying them as Established Leaders, Leading Challengers, or Disruptors & Challengers.

Locates where complements amplify value and substitutes erode it, forecasting net impact by horizon

We deliver granular, decision-grade intel: market sizing, 5-year forecasts, pricing, adoption, usage, revenue, and operational KPIs—plus competitor tracking, regulation, and value chains—across 60 countries broadly.

Spot the shifts before they hit your P&L. We track inflection points, adoption curves, pricing moves, and ecosystem plays to show where demand is heading, why it is changing, and what to do next across high-growth markets and disruptive tech

Real-time reads of user behavior. We track shifting priorities, perceptions of today’s and next-gen services, and provider experience, then pace how fast tech moves from trial to adoption, blending buyer, consumer, and channel inputs with social signals (#WhySwitch, #UX).

Partner with our analyst team to build a custom report designed around your business priorities. From analysing market trends to assessing competitors or crafting bespoke datasets, we tailor insights to your needs.
Supplier Intelligence
Discovery & Profiling
Capacity & Footprint
Performance & Risk
Compliance & Governance
Commercial Readiness
Who Supplies Whom
Scorecards & Shortlists
Playbooks & Docs
Category Intelligence
Definition & Scope
Demand & Use Cases
Cost Drivers
Market Structure
Supply Chain Map
Trade & Policy
Operating Norms
Deliverables
Buyer Intelligence
Account Basics
Spend & Scope
Procurement Model
Vendor Requirements
Terms & Policies
Entry Strategy
Pain Points & Triggers
Outputs
Pricing Analysis
Benchmarks
Trends
Should-Cost
Indexation
Landed Cost
Commercial Terms
Deliverables
Brand Analysis
Positioning & Value Prop
Share & Presence
Customer Evidence
Go-to-Market
Digital & Reputation
Compliance & Trust
KPIs & Gaps
Outputs
Full Research Suite comprises of:
Market outlook & trends analysis
Interviews & case studies
Strategic recommendations
Vendor profiles & capabilities analysis
5-year forecasts
8 regions and 60+ country-level data splits
Market segment data splits
12 months of continuous data updates
DELIVERED AS:
PDF EXCEL ONLINE
Enterprise Metadata Management Market Size and Share Forecast Outlook 2025 to 2035
Data Management Platforms Market Analysis and Forecast 2025 to 2035, By Type, End User, and Region
Enterprise Data Observability Software Market Size and Share Forecast Outlook 2025 to 2035
Enterprise Data Loss Prevention (DLP) Services Market Size and Share Forecast Outlook 2025 to 2035
Enterprise Key Management Market Report – Trends & Growth Forecast 2023-2033
Enterprise Asset Management Market Size and Share Forecast Outlook 2025 to 2035
Enterprise Drone Management Solutions Market Analysis 2025 to 2035 by Type, Technology, Application, and Region
Data Center Power Management Industry Analysis in Western Europe Size and Share Forecast Outlook 2025 to 2035
Data Center Power Management Industry Analysis in Korea Size and Share Forecast Outlook 2025 to 2035
Enterprise Rights Management Solution Market Size and Share Forecast Outlook 2025 to 2035
Data Center Power Management Market Growth – Demand, Trends & Forecast 2025–2035
Data Center Power Management Market Insights – Demand & Growth 2024-2034
Enterprise Content Management Market Size and Share Forecast Outlook 2025 to 2035
Enterprise Feedback Management Market Size and Share Forecast Outlook 2025 to 2035
Enterprise Feedback Management Industry Analysis in Western Europe Size and Share Forecast Outlook 2025 to 2035
Enterprise Feedback Management Industry Analysis in Korea Size and Share Forecast Outlook 2025 to 2035
Enterprise Feedback Management Industry Analysis in Japan Size and Share Forecast Outlook 2025 to 2035
Dynamic Data Management System Market Report – Trends & Forecast 2023-2033
Data Security Posture Management (DSPM) Solutions Market Size and Share Forecast Outlook 2025 to 2035
Oil & Gas Data Management Software Market Size and Share Forecast Outlook 2025 to 2035

Thank you!
You will receive an email from our Business Development Manager. Please be sure to check your SPAM/JUNK folder too.
Chat With
MaRIA