The Enterprise Feedback Management Industry Analysis in Korea is estimated to be valued at USD 136.0 million in 2025 and is projected to reach USD 319.1 million by 2035, registering a compound annual growth rate (CAGR) of 8.9% over the forecast period.
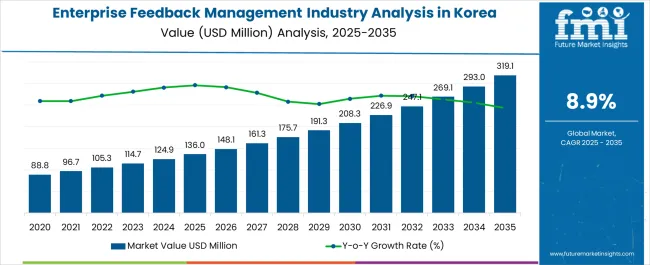
| Metric | Value |
|---|---|
| Enterprise Feedback Management Industry Analysis in Korea Estimated Value in (2025 E) | USD 136.0 million |
| Enterprise Feedback Management Industry Analysis in Korea Forecast Value in (2035 F) | USD 319.1 million |
| Forecast CAGR (2025 to 2035) | 8.9% |
The enterprise feedback management industry in Korea is expanding as organizations increasingly recognize the strategic importance of structured feedback systems in enhancing customer experience and operational efficiency. Current dynamics are being shaped by accelerated digital adoption, rising demand for data-driven decision-making, and integration of advanced analytics and AI tools into feedback platforms.
Enterprises are leveraging these solutions to capture, process, and analyze feedback across multiple channels to strengthen customer loyalty and streamline service delivery. Market development is also being supported by regulatory emphasis on compliance and consumer protection, which is encouraging adoption in highly sensitive sectors.
The future outlook is being influenced by continued growth in cloud-based solutions, scalability requirements of enterprises, and the rising prioritization of customer-centric strategies Growth rationale is anchored on the role of feedback systems in improving retention, enabling real-time monitoring, and driving innovation in product and service portfolios, ensuring long-term expansion of the industry in both large and mid-sized enterprise landscapes.
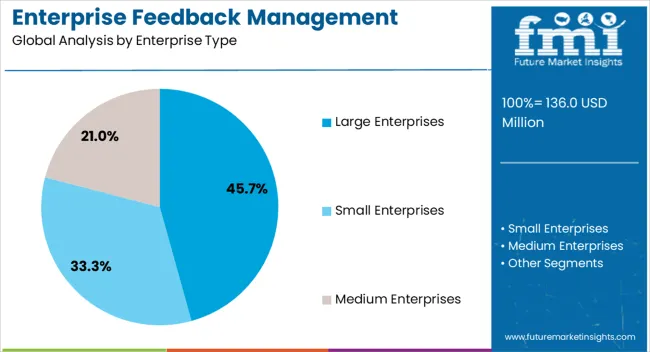
The large enterprises segment, holding 45.70% of the enterprise type category, has emerged as the leading contributor due to the scale of operations that demand sophisticated and integrated feedback solutions. Adoption has been driven by the need for structured systems to manage diverse customer bases, as well as compliance with regulatory standards that require transparency in service delivery.
Large enterprises have been able to leverage advanced analytics, predictive insights, and automation to improve customer satisfaction and retention. Market share has also been reinforced by investment capacity, enabling integration of cloud platforms and AI-powered tools.
Continued focus on digital transformation and customer-centric strategies is expected to sustain the dominance of this segment and support further adoption in highly competitive sectors such as telecommunications, retail, and financial services.
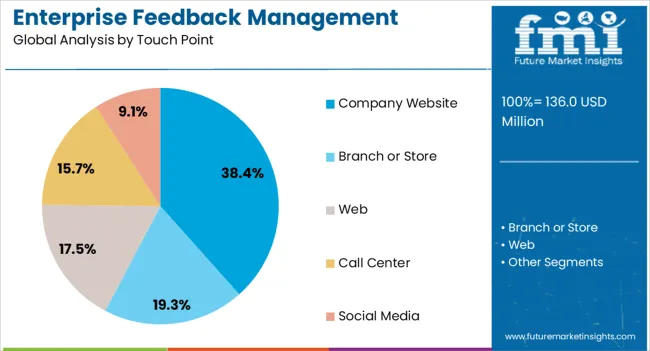
The company website segment, accounting for 38.40% of the touch point category, has remained dominant as enterprises increasingly prioritize online channels to capture real-time customer insights. Its leadership position has been driven by the shift to digital-first interactions and the reliability of websites as primary communication and engagement platforms.
Feedback captured through websites provides actionable insights into customer behavior, service quality, and product performance. Integration of chatbots, AI assistants, and seamless survey tools has further enhanced efficiency and response rates.
With growing mobile accessibility and personalization, company websites continue to serve as cost-effective and scalable feedback touchpoints Market growth is expected to be sustained by ongoing advancements in digital interfaces, improved user experience design, and enhanced security frameworks that protect sensitive consumer data while supporting feedback collection.
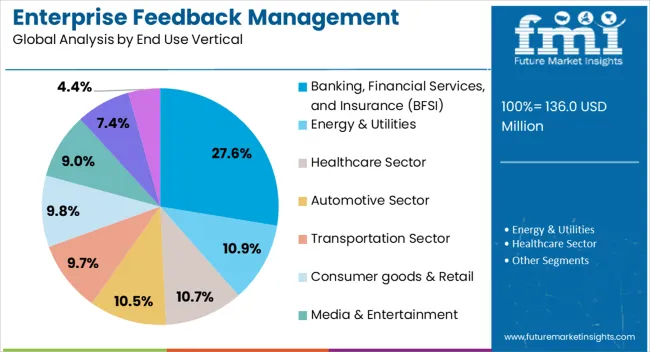
The banking, financial services, and insurance (BFSI) segment, representing 27.60% of the end use vertical category, has led the market due to the industry’s dependence on customer trust, transparency, and service quality. Adoption of enterprise feedback management solutions in this segment has been reinforced by regulatory frameworks mandating consumer grievance redressal and risk management practices.
Financial institutions are using structured feedback to personalize services, enhance customer experience, and improve cross-selling opportunities. Growing competition within Korea’s financial sector has accelerated the need for digital tools that monitor customer sentiment in real time.
Enhanced security protocols, data analytics integration, and omnichannel platforms are strengthening adoption across the BFSI sector Over the forecast period, the segment is expected to maintain its leadership as institutions prioritize customer satisfaction and retention as core strategic objectives in an increasingly competitive financial landscape.
The enterprise management industry in Korea is expected to witness a significant presence of large enterprises, exerting dominance over the sector during the forecast period. As of 2025, these large-scale corporations already command a substantial share of the industry, accounting for an impressive 61.2%.
The growing adoption of enterprise feedback solutions in large corporations for the ability to automate resource allocation and strategic decision-making is a primary factor. This indicates that the industry is currently being driven by the activities and initiatives of these key players, who possess the capacity to implement sophisticated feedback management systems on a substantial scale.
| Enterprise Feedback Management in Korea based on Enterprise Size | Large Enterprises |
|---|---|
| Total Share (2025) | 61.2% |
Large businesses are common in this industry, which can be linked to their innate ability to invest in cutting-edge technology and solutions. As a result, they can fully utilize corporate feedback management to boost customer engagement, operational effectiveness, and overall performance.
Their significant industry share indicates both their commitment to using cutting-edge procedures to keep a competitive advantage in Korea and their effect on the industry landscape.
Based on end user verticals that utilize enterprise feedback management solutions, the BFSI segment was figured out to leading demand generator in Korea. Given the complex nature of work in banking, financial services, and insurance firms, this segment is poised to garner higher traction in the coming days.
The BFSI sector places a high priority on customer satisfaction and experience. As a result, these institutions can obtain important information from their customers directly by using feedback management solutions. As a result, companies can be better able to tailor their services and products to satisfy customer requirements.
| Enterprise Feedback Management in Korea based on End User Verticals | Banking, Financial Services, and Insurance (BFSI) Sector |
|---|---|
| Total Share (2025) | 22.7% |
The BFSI industry operates in a highly competitive environment where it is crucial to remain aware of customer demands and act quickly to address grievances. These organizations are given the means and capacities to accomplish exactly that by enterprise feedback management, assuring their agility and responsiveness in a constantly changing industry.
Besides BFSI, the media and entertainment industry is a remarkably growing segment in Korea that is anticipated to boost the adoption in several media houses.
The demand for enterprise feedback management is relatively new in Korea, resulting in fewer service providers and less competition in the Korean landscape. The expansion of enterprise-wide digital transformation programs and the increasing integration of CRM software have opened up new opportunities for the feedback management system industry in Korea.
Many businesses in Korea are now placing emphasis on the development of cutting-edge enterprise feedback management technology solutions, such as real-time text and speech analytics capabilities. Therefore, the unrealized potential of this emerging economy combined with the growing use of artificial intelligence to enhance consumer interaction could lead to profitable development prospects.
Recent Developments in Enterprise Feedback Management in Korea
| Attribute | Details |
|---|---|
| Estimated Industry Size in 2025 | USD 136.0 million |
| Projected Industry Size by 2035 | USD 319.1 million |
| Anticipated CAGR between 2025 to 2035 | 8.9% CAGR |
| Historical Analysis of Demand for Enterprise Feedback Management in Korea | 2020 to 2025 |
| Demand Forecast for Enterprise Feedback Management in Korea | 2025 to 2035 |
| Report Coverage | Industry Size, Industry Trends, Analysis of key factors influencing Enterprise Feedback Management in Korea, Insights on Global Players and their Industry Strategy in Korea, Ecosystem Analysis of Local and Korea Providers |
| Key Cities Profiled | South Gyeongsang, North Jeolla, South Jeolla, Jeju |
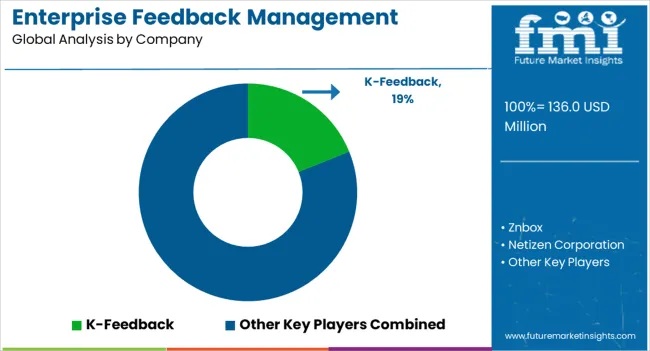
| Key Companies Profiled | K-Feedback; Znbox; Netizen Corporation; Prime Research; VOZGROW; CustomerGauge; FeedZ; GetFeedback; InMoment; Medallia; QuestionPro; Qualtrics; Survicate |
The global enterprise feedback management industry analysis in korea is estimated to be valued at USD 136.0 million in 2025.
The market size for the enterprise feedback management industry analysis in korea is projected to reach USD 319.1 million by 2035.
The enterprise feedback management industry analysis in korea is expected to grow at a 8.9% CAGR between 2025 and 2035.
The key product types in enterprise feedback management industry analysis in korea are large enterprises, small enterprises and medium enterprises.
In terms of touch point, company website segment to command 38.4% share in the enterprise feedback management industry analysis in korea in 2025.


Full Research Suite comprises of:
Market outlook & trends analysis
Interviews & case studies
Strategic recommendations
Vendor profiles & capabilities analysis
5-year forecasts
8 regions and 60+ country-level data splits
Market segment data splits
12 months of continuous data updates
DELIVERED AS:
PDF EXCEL ONLINE
Enterprise A2P SMS Market Size and Share Forecast Outlook 2025 to 2035
Enterprise-Class Hybrid Storage Market Size and Share Forecast Outlook 2025 to 2035
Enterprise Social Graph Market Size and Share Forecast Outlook 2025 to 2035
Enterprise File Sync And Share Platform Market Size and Share Forecast Outlook 2025 to 2035
Enterprise Mobility Market Size and Share Forecast Outlook 2025 to 2035
Enterprise LLM Market Size and Share Forecast Outlook 2025 to 2035
Enterprise VSAT Systems Market Size and Share Forecast Outlook 2025 to 2035
Enterprise AI Governance and Compliance Market Analysis - Size, Share, and Forecast Outlook 2025 to 2035
Enterprise IoT Market Size and Share Forecast Outlook 2025 to 2035
Enterprise WLAN Market Size and Share Forecast Outlook 2025 to 2035
Enterprise Network Equipment Market Size and Share Forecast Outlook 2025 to 2035
Enterprise Social Networks Market Size and Share Forecast Outlook 2025 to 2035
Enterprise Video Market Analysis - Size, Share, and Forecast 2025 to 2035
Enterprise-Grade DLT Market Size and Share Forecast Outlook 2025 to 2035
Enterprise Flash Storage Market
Enterprise Information Archiving (EIA) Market Size and Share Forecast Outlook 2025 to 2035
Enterprise File Sharing And Synchronization Market
Enterprise Manufacturing Intelligence Market Analysis by Deployment Type, Offering, End-use Industry, and Region Through 2035
Enterprise Laboratory Informatics Market Analysis by Type of Solution, Component, Delivery, Industry, and Region Through 2035
Enterprise Resource Planning (ERP) Software Market Size and Share Forecast Outlook 2025 to 2035

Thank you!
You will receive an email from our Business Development Manager. Please be sure to check your SPAM/JUNK folder too.
Chat With
MaRIA