Enterprise VSAT Systems Market Outlook (2023 to 2033)

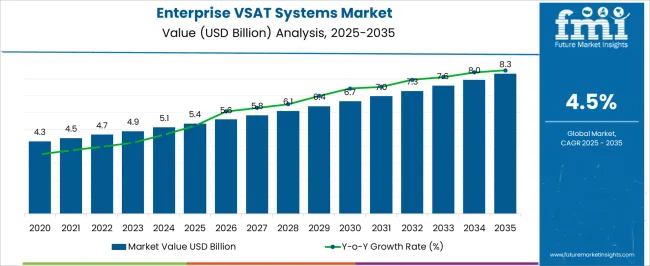
The global enterprise VSAT systems market was valued at US$ 4.9 billion in 2023 and is likely to expand at a rate of 4.5% from 2023 to 2033, reaching US$ 7.4 billion in 2033.

Increased adoption of VSAT systems in the maritime industry is a key factor that is anticipated to accelerate market growth during the forecast period. Other factors such as demand for a broadband data connection from business and government sectors are expected to augment the market size of the enterprise VSAT systems in the future.

Attribute Details
Market CAGR (2023 to 2033) 4.5%
Market (2023) US$ 4.9 billion
Market (2033) US$ 7.4 billion

Don't pay for what you don't need

Customize your report by selecting specific countries or regions and save 30%!

What Factors are Positively Swaying the Demand for Enterprise VSAT Systems?

The following factors are likely to surge the overall growth of the market:

  • Enterprise VSAT Systems are commonly installed on ships to provide fast broadband connectivity for both personal contact and business operations.
  • Advancements in satellite technology, leading to improved bandwidth, speed, and performance of VSAT systems.
  • Due to increased competitiveness, businesses are rapidly implementing enterprise VSAT technology innovations. As it can help them improve their product and service delivery and hence drive the growth of the market.
  • Enterprise VSAT systems find application in maritime surveillance operations. Providing compact, lightweight, and small equipment to support security forces and safeguard coastal areas, thereby driving the market for Enterprise VSAT systems.
  • The growth in space exploration missions, increasing interest in satellite-assisted warfare, increased deployment of small satellites, and cost-effective satellite launch operations.
  • Rising adoption of Internet of Things (IoT) devices and machine-to-machine (M2M) communications, driving the demand for robust connectivity solutions.
  • The expansion of public-private partnerships in space resources is providing new growth opportunities for the enterprise VSAT system market.

What Factors Impede the Enterprise VSAT Systems Industry Growth?

Emerging technologies such as high throughput satellite (HTS) technology are one of the key restraints to the growth of the global enterprise VSAT market.

Sea connectivity issues are further hindering the overall market in tandem with the high cost of installation and maintenance during the forecast period. The liability faced by several payment gateways in terms of security breaches and cyber-attacks has the potential to challenge the enterprise's very small aperture terminal (VSAT) market growth.

Other hindrances include the following:

  • Limited spectrum availability
  • Regulatory and licensing constraints
  • Infrastructure limitations
  • Competition from alternative technologies
  • Reliance on weather conditions
  • Security and privacy concerns
  • Limited scalability
Sudip Saha
Sudip Saha

Principal Consultant

Talk to Analyst

Find your sweet spots for generating winning opportunities in this market.

What are the Key Trends in the Market?

A few of the key trends exercising significant influence over the sales of enterprise VSAT systems in 2023 include the following:

  • The growing adoption of self-regulating communications networks, which connect multiple remote sites, is a significant driver for the enterprise VSAT market.
  • The increased use of satellite services across various industries for cross-vertical applications is creating opportunities and driving the demand for enterprise VSAT systems.
  • Showcase untapped segments and witness growing awareness among users, presenting further opportunities for market growth.
  • The high adoption of self-regulating communications networks, enabling connectivity among remote sites, strongly influences the growth of the enterprise VSAT market.
  • The growing use of satellite services across industries, coupled with the increasing use of remote sensing and GIS in disaster management.
  • The high demand for broadband data connections from government and business sectors acts as a key growth driver for the enterprise VSAT market.
  • The low investment and operating costs associated with enterprise VSAT systems contribute to the significant demand and market growth.
  • The surging demand for autonomous and connected vehicles, along with rising government initiatives to provide efficient communication services, presents new opportunities for the enterprise VSAT market.

Comparative Analysis of the Adjacent Market

Enterprise VSAT Systems Market:

Attributes Enterprise VSAT Systems Market
CAGR (2023 to 2033) 4.5%
Market Value (2033) US$ 7.4 billion
Growth Factor The ever-increasing need for communication is greatly influencing acceptance and driving market growth.
Opportunity The low investment and operating costs are also creating a huge demand for enterprise very small aperture terminals (VSAT). As well as lifting the growth of the enterprise's very small aperture terminal (VSAT) market.
Key Trends Businesses are rapidly implementing enterprise VSAT technology innovations, due to increased competitiveness, this can help them improve their product and service delivery.

Satellite Antenna Market:

Attributes Satellite Antenna Market
CAGR (2023 to 2033) 20%
Market Value (2033) US$ 20 billion
Growth Factor The growing fleet of autonomous and connected vehicles is used for various applications in the military and commercial sectors.
Opportunity The increasing investment in satellite antenna equipment enhances the defense and surveillance capabilities of the armed forces.
Key Trends The deployment of low earth orbit (LEO) satellites and constellations of satellites for communication applications has increased their demand across the globe.

Maritime Communication Market:

Attributes Maritime Communication Market
CAGR (2023 to 2033) 7.9%
Market Value (2033) US$ 10.08 billion
Growth Factor The need to attain improved connectivity between land and sea operations and realize benefits in faster repair times, preventative maintenance, fuel-saving, and real-time navigation.
Opportunity The growing investment across various regions to upgrade legacy systems in the naval fleet
Key Trends Escalating the need for enriched data communication to improve operation efficiency, onboard security & surveillance, and employee/passenger welfare in maritime is accelerating the growth of the market.

Get the data you need at a Fraction of the cost

Personalize your report by choosing insights you need
and save 40%!

How is the Enterprise VSAT Systems Market Segmented?

Segment Component
Top Sub-segment Hardware
CAGR (2023 to 2033) 54.3%
Segment Type
Top Sub-segment Shared Bandwidth VSAT Systems
CAGR (2023 to 2033) 59.7%

What can be Attributed to the Dominance of Hardware Sub-segment, Component-wise?

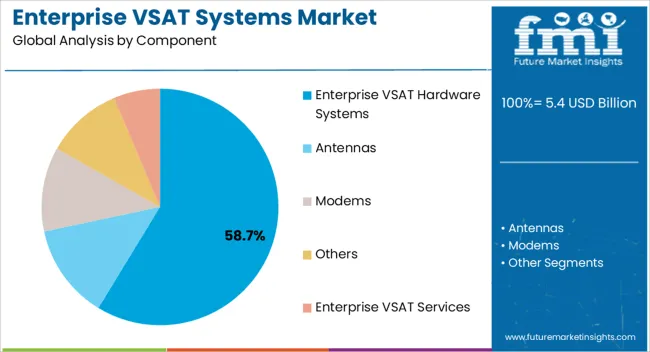
According to the FMI, the enterprise VSAT systems market by component for hardware was predicted to hold a value share of 54.3% in 2022, holding sway over the market.

Infrastructure Requirement: Hardware components form the backbone of VSAT systems, including satellite dishes, modems, antennas, and routers. These physical components are essential for establishing and maintaining satellite communication networks. Making them a critical part of enterprise VSAT systems.

Performance and Reliability: Hardware plays a crucial role in delivering reliable and high-performance satellite communication services. Enterprises require robust and efficient hardware to ensure seamless connectivity, data transmission, and network stability, making hardware a priority in their VSAT system investments.

Technological Advancements: Ongoing advancements in hardware technologies have enhanced the capabilities and efficiency of enterprise VSAT systems. The availability of advanced antenna systems, more powerful modems, and improved network management hardware has contributed to the dominance of the hardware sub-segment.

Driving Connectivity Transformation: How the Shared Bandwidth VSAT Systems Reign Supreme in the Enterprise VSAT Market?

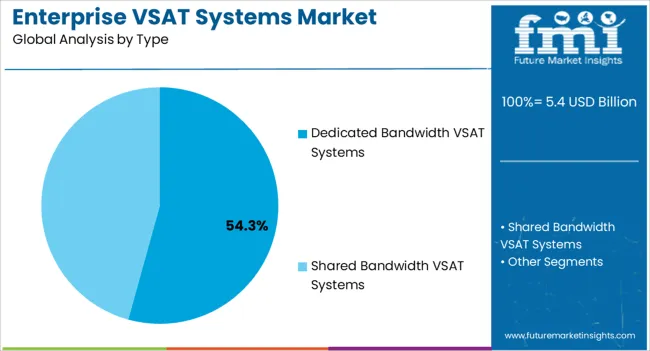
Throughout the research, the shared bandwidth VSAT systems were estimated to hold 59.7% in 2022.

Cost Efficiency: Shared bandwidth VSAT systems allow multiple users to share the same satellite capacity, resulting in cost savings compared to dedicated bandwidth systems. Enterprises can access satellite connectivity at a fraction of the cost, making shared bandwidth VSAT systems an attractive option for cost-conscious organizations.

Scalability and Flexibility: Shared bandwidth VSAT systems offer scalability, allowing enterprises to easily adjust their bandwidth requirements based on their evolving needs. It provides the flexibility to add or reduce capacity as required, enabling businesses to adapt to changing demands without significant infrastructure modifications.

Wide Coverage and Reach: Shared bandwidth VSAT systems provide wide coverage and reach, enabling connectivity in remote and underserved areas where terrestrial infrastructure is limited.
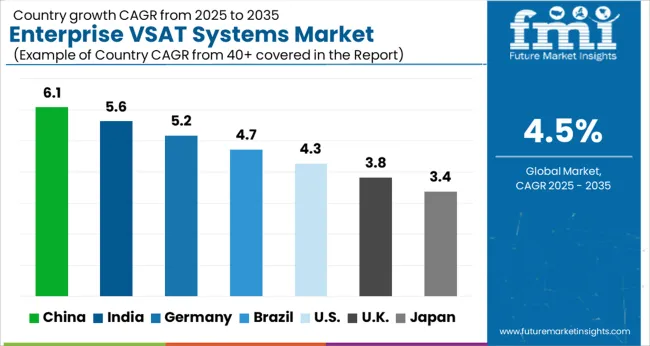
Which Region is Performing Better in the Enterprise VSAT Systems?

North American region is expected to dominate the market in enterprise VSAT systems during the forecast period. Attributed to the high adoption of satellite services for various applications such as inspection of vegetation identification, historical monuments, volcano monitoring, and disaster supervision in case of storms and hurricanes in this region.

The North America enterprise VSAT systems market held about a value share of 31.4% globally in 2022. The sale of enterprise VSAT systems in the United States of America is likely to soar to a significant extent, where the country held a value share of 19.3% in 2022.

Asia Pacific is expected to expand at a significant growth rate during the forecast period. Owing to the rapid increase in government initiatives to connect schools and colleges within this region. The rise in government initiatives to connect schools and colleges in countries like Australia, India, and China is likely to favor market growth in the region.

The value share of the enterprise VSAT systems market in Japan was expected to be 5.3% and the market in China is projected to advance at a CAGR of 5.9% during the forecast period. The market in India is expected to move forward at a rate of 6.2% from 2023 to 2033.

Who are the Key Competitors in the Enterprise VSAT Systems Market?

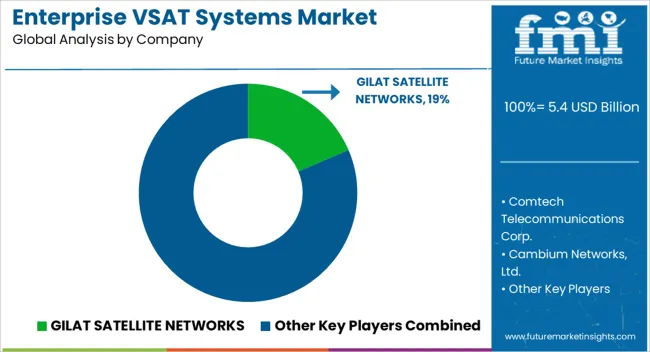
With a sizable enterprise VSAT systems market share, these main firms are concentrating on growing their consumer base in new countries. These businesses are making use of strategic collaboration initiatives to grow their market share and profits.

Mid-size and smaller businesses, on the other hand, are expanding their market presence by gaining new contracts and entering new markets, thanks to technical developments and product innovations.

Prominent Strategies Adopted by the Players:
  • Expansion of Satellite Network Coverage: Key players focus on expanding their satellite network coverage to reach more remote areas and expand their customer base.
  • Technological Advancements: Companies invest in research and development to enhance the performance, efficiency, and reliability of their VSAT systems, offering customers advanced features and capabilities.
  • Strategic Partnerships and Collaborations: Key players form strategic partnerships and collaborations with other companies, satellite operators, or service providers to strengthen their market position, expand their offerings, and leverage synergies.
  • Customized Solutions: Companies tailor their VSAT systems to meet specific customer requirements and provide customized solutions that address unique industry needs.
  • Pricing and Competitive Strategies: Companies adopt competitive pricing strategies to attract customers, differentiate themselves from competitors, and maintain a competitive edge in the market.
  • Mergers and Acquisitions: Key players actively pursue mergers, acquisitions, or strategic partnerships to consolidate their market position, acquire new technologies or capabilities, and expand their customer base.

Key Players

  • GILAT SATELLITE NETWORKS
  • Comtech Telecommunications Corp.
  • Cambium Networks, Ltd.
  • Telefónica, S.A.
  • Embratel
  • Ultra Electronics
  • Hughes Network Systems, LLC
  • Airtel India
  • Nelco

Recent Developments:

  • In March 2022, Hughes Network Systems, LLC (HUGHES) demonstrated two new technologies at the SATELLITE 2022 trade show in Washington, D.C. Hughes showcased new technology that seamlessly integrates Geostationary (GEO) satellite and LTE transports into a single, reliable, low-latency broadband internet connection for consumers. Hughes then revealed its new technology for electronically steerable, flat-panel antennas, including a prototype for delivering OneWeb Low Earth Orbit (LEO) connectivity services.
  • In February 2022, Gilat Satellite Networks Ltd., a worldwide leader in satellite networking technology, solutions, and services, expanded its strategic partnership with SES. SES had selected Gilat’s SkyEdge IV platform to operate with its SES-17 satellite, a very high throughput satellite (VHTS) to provide fixed services and mobility services.
  • In January 2022, KVH Industries announced that ScanReach, an innovator in onboard wireless connectivity solutions designed specifically for the steel vessel environment. It had joined the KVH Watch Solution Partner program to offer KVH Watch Cloud Connect services. ScanReach’s breakthrough onboard wireless connectivity technology enables data to travel anywhere on the vessel without cabling. Combined with KVH Watch Cloud Connect, the data may travel to the cloud for useful data analysis to improve vessel performance.

Segmentation Analysis of Enterprise VSAT Systems Market

By Component:

  • Enterprise VSAT Hardware Systems
    • Antennas
    • Modems
    • Others
  • Enterprise VSAT Services

By Type:

  • Dedicated Bandwidth VSAT Systems
  • Shared Bandwidth VSAT Systems

By Enterprise Size:

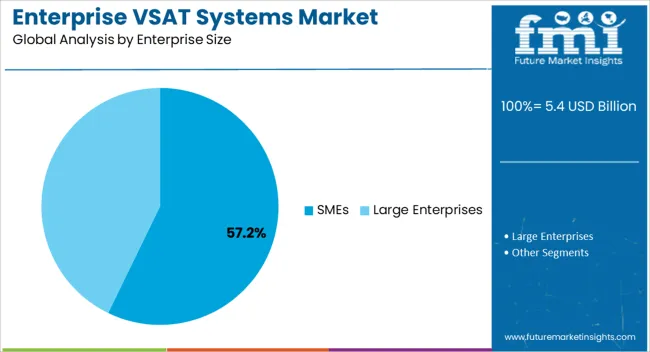
  • SMEs
  • Large Enterprises

By End-use Industry:

  • Industrial Enterprise VSAT Systems
    • Aerospace & Defense
    • Manufacturing
    • Energy
    • Oil & Gas
    • Maritime
  • Enterprise-based Enterprise VSAT Systems
    • BFSI
    • IT
    • Retail
    • Entertainment & Media
    • Education
    • Healthcare
    • Government

By Region:

  • North America
  • South America
  • Europe
  • Asia Pacific
  • The Middle East and Africa(MEA)

Frequently Asked Questions

How Global Enterprise VSAT Systems Market will Progress in the Coming Days?

The overall market is forecasted to progress at 4.5% CAGR between 2023 and 2033.

What will be the Overall Enterprise VSAT Systems Market Value in the Future?

The global enterprise VSAT systems market value could become US$ 7.4 billion by 2033.

Which Geographical Region dominates the Global Enterprise VSAT Systems Market?

North America held nearly 31.4% of the global market share in the year 2022.

Which Country has the More Demand Potential for Enterprise VSAT Systems?

The sales of enterprise VSAT systems in China could increase at 5.3% CAGR through 2033.

Which is the Most Notable Embedded Hypervisor Market Segment based on Type?

The shared bandwidth market segment contributes roughly 60% of the global market revenue.

Table of Content
1. Executive Summary

    1.1. Global Market Outlook

    1.2. Demand-side Trends

    1.3. Supply-side Trends

    1.4. Technology Roadmap Analysis

    1.5. Analysis and Recommendations

2. Market Overview

    2.1. Market Coverage / Taxonomy

    2.2. Market Definition / Scope / Limitations

3. Market Background

    3.1. Market Dynamics

        3.1.1. Drivers

        3.1.2. Restraints

        3.1.3. Opportunity

        3.1.4. Trends

    3.2. Scenario Forecast

        3.2.1. Demand in Optimistic Scenario

        3.2.2. Demand in Likely Scenario

        3.2.3. Demand in Conservative Scenario

    3.3. Opportunity Map Analysis

    3.4. Investment Feasibility Matrix

    3.5. PESTLE and Porter’s Analysis

    3.6. Regulatory Landscape

        3.6.1. By Key Regions

        3.6.2. By Key Countries

    3.7. Regional Parent Market Outlook

4. Global Market Analysis 2018 to 2022 and Forecast, 2023 to 2033

    4.1. Historical Market Size Value (US$ Million) Analysis, 2018 to 2022

    4.2. Current and Future Market Size Value (US$ Million) Projections, 2023 to 2033

        4.2.1. Y-o-Y Growth Trend Analysis

        4.2.2. Absolute $ Opportunity Analysis

5. Global Market Analysis 2018 to 2022 and Forecast 2023 to 2033, By Component

    5.1. Introduction / Key Findings

    5.2. Historical Market Size Value (US$ Million) Analysis By Component, 2018 to 2022

    5.3. Current and Future Market Size Value (US$ Million) Analysis and Forecast By Component, 2023 to 2033

        5.3.1. Enterprise VSAT Hardware Systems

            5.3.1.1. Antennas

            5.3.1.2. Modems

            5.3.1.3. Others

        5.3.2. Enterprise VSAT Services

    5.4. Y-o-Y Growth Trend Analysis By Component, 2018 to 2022

    5.5. Absolute $ Opportunity Analysis By Component, 2023 to 2033

6. Global Market Analysis 2018 to 2022 and Forecast 2023 to 2033, By Type

    6.1. Introduction / Key Findings

    6.2. Historical Market Size Value (US$ Million) Analysis By Type, 2018 to 2022

    6.3. Current and Future Market Size Value (US$ Million) Analysis and Forecast By Type, 2023 to 2033

        6.3.1. Dedicated Bandwidth VSAT Systems

        6.3.2. Shared Bandwidth VSAT Systems

    6.4. Y-o-Y Growth Trend Analysis By Type, 2018 to 2022

    6.5. Absolute $ Opportunity Analysis By Type, 2023 to 2033

7. Global Market Analysis 2018 to 2022 and Forecast 2023 to 2033, By Enterprise Size

    7.1. Introduction / Key Findings

    7.2. Historical Market Size Value (US$ Million) Analysis By Enterprise Size , 2018 to 2022

    7.3. Current and Future Market Size Value (US$ Million) Analysis and Forecast By Enterprise Size , 2023 to 2033

        7.3.1. SMEs

        7.3.2. Large Enterprises

    7.4. Y-o-Y Growth Trend Analysis By Enterprise Size , 2018 to 2022

    7.5. Absolute $ Opportunity Analysis By Enterprise Size , 2023 to 2033

8. Global Market Analysis 2018 to 2022 and Forecast 2023 to 2033, By End-Use Industry

    8.1. Introduction / Key Findings

    8.2. Historical Market Size Value (US$ Million) Analysis By End-Use Industry, 2018 to 2022

    8.3. Current and Future Market Size Value (US$ Million) Analysis and Forecast By End-Use Industry, 2023 to 2033

        8.3.1. Industrial

            8.3.1.1. Aerospace & Defense

            8.3.1.2. Manufacturing

            8.3.1.3. Energy

            8.3.1.4. Oil & Gas

            8.3.1.5. Maritime

        8.3.2. Enterprise-based

            8.3.2.1. BFSI

            8.3.2.2. IT

            8.3.2.3. Retail

            8.3.2.4. Entertainment & Media

            8.3.2.5. Education

            8.3.2.6. Healthcare

            8.3.2.7. Government

    8.4. Y-o-Y Growth Trend Analysis By End-Use Industry, 2018 to 2022

    8.5. Absolute $ Opportunity Analysis By End-Use Industry, 2023 to 2033

9. Global Market Analysis 2018 to 2022 and Forecast 2023 to 2033, By Region

    9.1. Introduction

    9.2. Historical Market Size Value (US$ Million) Analysis By Region, 2018 to 2022

    9.3. Current Market Size Value (US$ Million) Analysis and Forecast By Region, 2023 to 2033

        9.3.1. North America

        9.3.2. Latin America

        9.3.3. Europe

        9.3.4. South Asia

        9.3.5. East Asia

        9.3.6. Oceania

        9.3.7. MEA

    9.4. Market Attractiveness Analysis By Region

10. North America Market Analysis 2018 to 2022 and Forecast 2023 to 2033, By Country

    10.1. Historical Market Size Value (US$ Million) Trend Analysis By Market Taxonomy, 2018 to 2022

    10.2. Market Size Value (US$ Million) Forecast By Market Taxonomy, 2023 to 2033

        10.2.1. By Country

            10.2.1.1. The USA

            10.2.1.2. Canada

        10.2.2. By Component

        10.2.3. By Type

        10.2.4. By Enterprise Size

        10.2.5. By End-Use Industry

    10.3. Market Attractiveness Analysis

        10.3.1. By Country

        10.3.2. By Component

        10.3.3. By Type

        10.3.4. By Enterprise Size

        10.3.5. By End-Use Industry

    10.4. Key Takeaways

11. Latin America Market Analysis 2018 to 2022 and Forecast 2023 to 2033, By Country

    11.1. Historical Market Size Value (US$ Million) Trend Analysis By Market Taxonomy, 2018 to 2022

    11.2. Market Size Value (US$ Million) Forecast By Market Taxonomy, 2023 to 2033

        11.2.1. By Country

            11.2.1.1. Brazil

            11.2.1.2. Mexico

            11.2.1.3. Rest of Latin America

        11.2.2. By Component

        11.2.3. By Type

        11.2.4. By Enterprise Size

        11.2.5. By End-Use Industry

    11.3. Market Attractiveness Analysis

        11.3.1. By Country

        11.3.2. By Component

        11.3.3. By Type

        11.3.4. By Enterprise Size

        11.3.5. By End-Use Industry

    11.4. Key Takeaways

12. Europe Market Analysis 2018 to 2022 and Forecast 2023 to 2033, By Country

    12.1. Historical Market Size Value (US$ Million) Trend Analysis By Market Taxonomy, 2018 to 2022

    12.2. Market Size Value (US$ Million) Forecast By Market Taxonomy, 2023 to 2033

        12.2.1. By Country

            12.2.1.1. Germany

            12.2.1.2. United Kingdom

            12.2.1.3. France

            12.2.1.4. Spain

            12.2.1.5. Italy

            12.2.1.6. Rest of Europe

        12.2.2. By Component

        12.2.3. By Type

        12.2.4. By Enterprise Size

        12.2.5. By End-Use Industry

    12.3. Market Attractiveness Analysis

        12.3.1. By Country

        12.3.2. By Component

        12.3.3. By Type

        12.3.4. By Enterprise Size

        12.3.5. By End-Use Industry

    12.4. Key Takeaways

13. South Asia Market Analysis 2018 to 2022 and Forecast 2023 to 2033, By Country

    13.1. Historical Market Size Value (US$ Million) Trend Analysis By Market Taxonomy, 2018 to 2022

    13.2. Market Size Value (US$ Million) Forecast By Market Taxonomy, 2023 to 2033

        13.2.1. By Country

            13.2.1.1. India

            13.2.1.2. Malaysia

            13.2.1.3. Singapore

            13.2.1.4. Thailand

            13.2.1.5. Rest of South Asia

        13.2.2. By Component

        13.2.3. By Type

        13.2.4. By Enterprise Size

        13.2.5. By End-Use Industry

    13.3. Market Attractiveness Analysis

        13.3.1. By Country

        13.3.2. By Component

        13.3.3. By Type

        13.3.4. By Enterprise Size

        13.3.5. By End-Use Industry

    13.4. Key Takeaways

14. East Asia Market Analysis 2018 to 2022 and Forecast 2023 to 2033, By Country

    14.1. Historical Market Size Value (US$ Million) Trend Analysis By Market Taxonomy, 2018 to 2022

    14.2. Market Size Value (US$ Million) Forecast By Market Taxonomy, 2023 to 2033

        14.2.1. By Country

            14.2.1.1. China

            14.2.1.2. Japan

            14.2.1.3. South Korea

        14.2.2. By Component

        14.2.3. By Type

        14.2.4. By Enterprise Size

        14.2.5. By End-Use Industry

    14.3. Market Attractiveness Analysis

        14.3.1. By Country

        14.3.2. By Component

        14.3.3. By Type

        14.3.4. By Enterprise Size

        14.3.5. By End-Use Industry

    14.4. Key Takeaways

15. Oceania Market Analysis 2018 to 2022 and Forecast 2023 to 2033, By Country

    15.1. Historical Market Size Value (US$ Million) Trend Analysis By Market Taxonomy, 2018 to 2022

    15.2. Market Size Value (US$ Million) Forecast By Market Taxonomy, 2023 to 2033

        15.2.1. By Country

            15.2.1.1. Australia

            15.2.1.2. New Zealand

        15.2.2. By Component

        15.2.3. By Type

        15.2.4. By Enterprise Size

        15.2.5. By End-Use Industry

    15.3. Market Attractiveness Analysis

        15.3.1. By Country

        15.3.2. By Component

        15.3.3. By Type

        15.3.4. By Enterprise Size

        15.3.5. By End-Use Industry

    15.4. Key Takeaways

16. MEA Market Analysis 2018 to 2022 and Forecast 2023 to 2033, By Country

    16.1. Historical Market Size Value (US$ Million) Trend Analysis By Market Taxonomy, 2018 to 2022

    16.2. Market Size Value (US$ Million) Forecast By Market Taxonomy, 2023 to 2033

        16.2.1. By Country

            16.2.1.1. GCC Countries

            16.2.1.2. South Africa

            16.2.1.3. Israel

            16.2.1.4. Rest of MEA

        16.2.2. By Component

        16.2.3. By Type

        16.2.4. By Enterprise Size

        16.2.5. By End-Use Industry

    16.3. Market Attractiveness Analysis

        16.3.1. By Country

        16.3.2. By Component

        16.3.3. By Type

        16.3.4. By Enterprise Size

        16.3.5. By End-Use Industry

    16.4. Key Takeaways

17. Key Countries Market Analysis

    17.1. USA

        17.1.1. Pricing Analysis

        17.1.2. Market Share Analysis, 2022

            17.1.2.1. By Component

            17.1.2.2. By Type

            17.1.2.3. By Enterprise Size

            17.1.2.4. By End-Use Industry

    17.2. Canada

        17.2.1. Pricing Analysis

        17.2.2. Market Share Analysis, 2022

            17.2.2.1. By Component

            17.2.2.2. By Type

            17.2.2.3. By Enterprise Size

            17.2.2.4. By End-Use Industry

    17.3. Brazil

        17.3.1. Pricing Analysis

        17.3.2. Market Share Analysis, 2022

            17.3.2.1. By Component

            17.3.2.2. By Type

            17.3.2.3. By Enterprise Size

            17.3.2.4. By End-Use Industry

    17.4. Mexico

        17.4.1. Pricing Analysis

        17.4.2. Market Share Analysis, 2022

            17.4.2.1. By Component

            17.4.2.2. By Type

            17.4.2.3. By Enterprise Size

            17.4.2.4. By End-Use Industry

    17.5. Germany

        17.5.1. Pricing Analysis

        17.5.2. Market Share Analysis, 2022

            17.5.2.1. By Component

            17.5.2.2. By Type

            17.5.2.3. By Enterprise Size

            17.5.2.4. By End-Use Industry

    17.6. United Kingdom

        17.6.1. Pricing Analysis

        17.6.2. Market Share Analysis, 2022

            17.6.2.1. By Component

            17.6.2.2. By Type

            17.6.2.3. By Enterprise Size

            17.6.2.4. By End-Use Industry

    17.7. France

        17.7.1. Pricing Analysis

        17.7.2. Market Share Analysis, 2022

            17.7.2.1. By Component

            17.7.2.2. By Type

            17.7.2.3. By Enterprise Size

            17.7.2.4. By End-Use Industry

    17.8. Spain

        17.8.1. Pricing Analysis

        17.8.2. Market Share Analysis, 2022

            17.8.2.1. By Component

            17.8.2.2. By Type

            17.8.2.3. By Enterprise Size

            17.8.2.4. By End-Use Industry

    17.9. Italy

        17.9.1. Pricing Analysis

        17.9.2. Market Share Analysis, 2022

            17.9.2.1. By Component

            17.9.2.2. By Type

            17.9.2.3. By Enterprise Size

            17.9.2.4. By End-Use Industry

    17.10. India

        17.10.1. Pricing Analysis

        17.10.2. Market Share Analysis, 2022

            17.10.2.1. By Component

            17.10.2.2. By Type

            17.10.2.3. By Enterprise Size

            17.10.2.4. By End-Use Industry

    17.11. Malaysia

        17.11.1. Pricing Analysis

        17.11.2. Market Share Analysis, 2022

            17.11.2.1. By Component

            17.11.2.2. By Type

            17.11.2.3. By Enterprise Size

            17.11.2.4. By End-Use Industry

    17.12. Singapore

        17.12.1. Pricing Analysis

        17.12.2. Market Share Analysis, 2022

            17.12.2.1. By Component

            17.12.2.2. By Type

            17.12.2.3. By Enterprise Size

            17.12.2.4. By End-Use Industry

    17.13. Thailand

        17.13.1. Pricing Analysis

        17.13.2. Market Share Analysis, 2022

            17.13.2.1. By Component

            17.13.2.2. By Type

            17.13.2.3. By Enterprise Size

            17.13.2.4. By End-Use Industry

    17.14. China

        17.14.1. Pricing Analysis

        17.14.2. Market Share Analysis, 2022

            17.14.2.1. By Component

            17.14.2.2. By Type

            17.14.2.3. By Enterprise Size

            17.14.2.4. By End-Use Industry

    17.15. Japan

        17.15.1. Pricing Analysis

        17.15.2. Market Share Analysis, 2022

            17.15.2.1. By Component

            17.15.2.2. By Type

            17.15.2.3. By Enterprise Size

            17.15.2.4. By End-Use Industry

    17.16. South Korea

        17.16.1. Pricing Analysis

        17.16.2. Market Share Analysis, 2022

            17.16.2.1. By Component

            17.16.2.2. By Type

            17.16.2.3. By Enterprise Size

            17.16.2.4. By End-Use Industry

    17.17. Australia

        17.17.1. Pricing Analysis

        17.17.2. Market Share Analysis, 2022

            17.17.2.1. By Component

            17.17.2.2. By Type

            17.17.2.3. By Enterprise Size

            17.17.2.4. By End-Use Industry

    17.18. New Zealand

        17.18.1. Pricing Analysis

        17.18.2. Market Share Analysis, 2022

            17.18.2.1. By Component

            17.18.2.2. By Type

            17.18.2.3. By Enterprise Size

            17.18.2.4. By End-Use Industry

    17.19. GCC Countries

        17.19.1. Pricing Analysis

        17.19.2. Market Share Analysis, 2022

            17.19.2.1. By Component

            17.19.2.2. By Type

            17.19.2.3. By Enterprise Size

            17.19.2.4. By End-Use Industry

    17.20. South Africa

        17.20.1. Pricing Analysis

        17.20.2. Market Share Analysis, 2022

            17.20.2.1. By Component

            17.20.2.2. By Type

            17.20.2.3. By Enterprise Size

            17.20.2.4. By End-Use Industry

    17.21. Israel

        17.21.1. Pricing Analysis

        17.21.2. Market Share Analysis, 2022

            17.21.2.1. By Component

            17.21.2.2. By Type

            17.21.2.3. By Enterprise Size

            17.21.2.4. By End-Use Industry

18. Market Structure Analysis

    18.1. Competition Dashboard

    18.2. Competition Benchmarking

    18.3. Market Share Analysis of Top Players

        18.3.1. By Regional

        18.3.2. By Component

        18.3.3. By Type

        18.3.4. By Enterprise Size

        18.3.5. By End-Use Industry

19. Competition Analysis

    19.1. Competition Deep Dive

        19.1.1. GILAT SATELLITE NETWORKS

            19.1.1.1. Overview

            19.1.1.2. Product Portfolio

            19.1.1.3. Profitability by Market Segments

            19.1.1.4. Sales Footprint

            19.1.1.5. Strategy Overview

                19.1.1.5.1. Marketing Strategy

        19.1.2. Comtech Telecommunications Corp.

            19.1.2.1. Overview

            19.1.2.2. Product Portfolio

            19.1.2.3. Profitability by Market Segments

            19.1.2.4. Sales Footprint

            19.1.2.5. Strategy Overview

                19.1.2.5.1. Marketing Strategy

        19.1.3. Cambium Networks, Ltd.

            19.1.3.1. Overview

            19.1.3.2. Product Portfolio

            19.1.3.3. Profitability by Market Segments

            19.1.3.4. Sales Footprint

            19.1.3.5. Strategy Overview

                19.1.3.5.1. Marketing Strategy

        19.1.4. Telefónica, S.A.

            19.1.4.1. Overview

            19.1.4.2. Product Portfolio

            19.1.4.3. Profitability by Market Segments

            19.1.4.4. Sales Footprint

            19.1.4.5. Strategy Overview

                19.1.4.5.1. Marketing Strategy

        19.1.5. Embratel

            19.1.5.1. Overview

            19.1.5.2. Product Portfolio

            19.1.5.3. Profitability by Market Segments

            19.1.5.4. Sales Footprint

            19.1.5.5. Strategy Overview

                19.1.5.5.1. Marketing Strategy

        19.1.6. Ultra Electronics

            19.1.6.1. Overview

            19.1.6.2. Product Portfolio

            19.1.6.3. Profitability by Market Segments

            19.1.6.4. Sales Footprint

            19.1.6.5. Strategy Overview

                19.1.6.5.1. Marketing Strategy

        19.1.7. Hughes Network Systems, LLC

            19.1.7.1. Overview

            19.1.7.2. Product Portfolio

            19.1.7.3. Profitability by Market Segments

            19.1.7.4. Sales Footprint

            19.1.7.5. Strategy Overview

                19.1.7.5.1. Marketing Strategy

        19.1.8. Airtel India

            19.1.8.1. Overview

            19.1.8.2. Product Portfolio

            19.1.8.3. Profitability by Market Segments

            19.1.8.4. Sales Footprint

            19.1.8.5. Strategy Overview

                19.1.8.5.1. Marketing Strategy

        19.1.9. Nelco

            19.1.9.1. Overview

            19.1.9.2. Product Portfolio

            19.1.9.3. Profitability by Market Segments

            19.1.9.4. Sales Footprint

            19.1.9.5. Strategy Overview

                19.1.9.5.1. Marketing Strategy

        19.1.10. ND SatCom

            19.1.10.1. Overview

            19.1.10.2. Product Portfolio

            19.1.10.3. Profitability by Market Segments

            19.1.10.4. Sales Footprint

            19.1.10.5. Strategy Overview

                19.1.10.5.1. Marketing Strategy

        19.1.11. Newtec

            19.1.11.1. Overview

            19.1.11.2. Product Portfolio

            19.1.11.3. Profitability by Market Segments

            19.1.11.4. Sales Footprint

            19.1.11.5. Strategy Overview

                19.1.11.5.1. Marketing Strategy

        19.1.12. Link Communications Systems

            19.1.12.1. Overview

            19.1.12.2. Product Portfolio

            19.1.12.3. Profitability by Market Segments

            19.1.12.4. Sales Footprint

            19.1.12.5. Strategy Overview

                19.1.12.5.1. Marketing Strategy

        19.1.13. SageNet LLC

            19.1.13.1. Overview

            19.1.13.2. Product Portfolio

            19.1.13.3. Profitability by Market Segments

            19.1.13.4. Sales Footprint

            19.1.13.5. Strategy Overview

                19.1.13.5.1. Marketing Strategy

        19.1.14. KVH Industries, Inc.

            19.1.14.1. Overview

            19.1.14.2. Product Portfolio

            19.1.14.3. Profitability by Market Segments

            19.1.14.4. Sales Footprint

            19.1.14.5. Strategy Overview

                19.1.14.5.1. Marketing Strategy

        19.1.15. OmniAccess

            19.1.15.1. Overview

            19.1.15.2. Product Portfolio

            19.1.15.3. Profitability by Market Segments

            19.1.15.4. Sales Footprint

            19.1.15.5. Strategy Overview

                19.1.15.5.1. Marketing Strategy

        19.1.16. Vizocom

            19.1.16.1. Overview

            19.1.16.2. Product Portfolio

            19.1.16.3. Profitability by Market Segments

            19.1.16.4. Sales Footprint

            19.1.16.5. Strategy Overview

                19.1.16.5.1. Marketing Strategy

        19.1.17. Orion Satellite Systems

            19.1.17.1. Overview

            19.1.17.2. Product Portfolio

            19.1.17.3. Profitability by Market Segments

            19.1.17.4. Sales Footprint

            19.1.17.5. Strategy Overview

                19.1.17.5.1. Marketing Strategy

        19.1.18. Skycasters, LLC

            19.1.18.1. Overview

            19.1.18.2. Product Portfolio

            19.1.18.3. Profitability by Market Segments

            19.1.18.4. Sales Footprint

            19.1.18.5. Strategy Overview

                19.1.18.5.1. Marketing Strategy

        19.1.19. Viasat, Inc.

            19.1.19.1. Overview

            19.1.19.2. Product Portfolio

            19.1.19.3. Profitability by Market Segments

            19.1.19.4. Sales Footprint

            19.1.19.5. Strategy Overview

                19.1.19.5.1. Marketing Strategy

        19.1.20. ST Engineering iDirect, Inc.

            19.1.20.1. Overview

            19.1.20.2. Product Portfolio

            19.1.20.3. Profitability by Market Segments

            19.1.20.4. Sales Footprint

            19.1.20.5. Strategy Overview

                19.1.20.5.1. Marketing Strategy

20. Assumptions & Acronyms Used

21. Research Methodology
Recommendations

Technology

Data Center Transformation Market

January 2023

REP-GB-16522

324 pages

Technology

MEA Enterprise Software Market

September 2024

REP-MA-33

Upcoming

Explore Technology Insights

View Reports
Future Market Insights

Enterprise VSAT Systems Market