Enterprise Content Management Market Outlook (2023 to 2033)

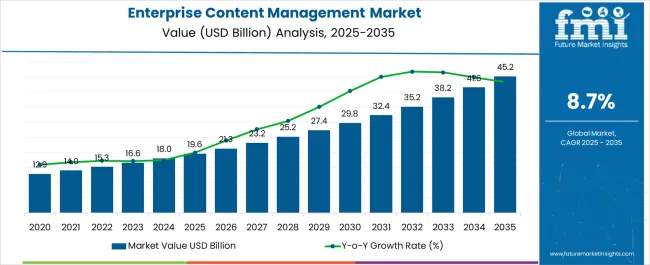
The enterprise content management market is estimated to value at USD 16.6 Billion in 2023 and is likely to reach USD 38.3 Billion by 2033. The enterprise content management market is likely to grow at a promising CAGR of 8.7% between 2023 and 2033.

Attributes Details
Enterprise Content Management Market CAGR (2023 to 2033) 8.7%
Enterprise Content Management Market Value (2023) USD 16.6 Billion
Enterprise Content Management Market Value (2033) US 38.3 Billion

Rising standard of compliance and audit management, increasing control and visibility over corporate information that integrates and optimizes the business processes are fueling the demand for enterprise content management market.

Multiple industries ask for more optimized and compliance-friendly management programs that help their corporate structure in strengthening different distribution channels and supply chains. Here is where enterprise content management systems come into play. From BFSI to IT, the use of these content management systems is booming and expected to hold a huge market in the forecast period.

What are the Key Drivers and Restraints for Growth of the Enterprise Content Management Market?

The increased need for regulatory, compliance, and audit management amongst enterprises are fueling the sales of enterprise content management. The IT systems integrating with content management tools strengthen the corporate information governance.

The major factors driving the enterprise content management market are frequent audits, rising security risks, and regular compliance policies. Business enterprises demand maintenance of multiple documents and data required at the time of audits and protect the information from frauds and cyber-attacks.

Enterprise content management systems are used while integrating these solutions with cloud-based storage. Cloud-based solutions are easily available, while the on-premise type of content management is gaining popularity in enterprise content management.

The latest cutting-edge technological advancements have changed the way enterprise content management tools work, integrating with artificial intelligence, machine learning, and predictive learning.

Business platforms are using enterprise content management systems in order to provide solutions for record management, audit trail, content collaboration, and dashboard analytics. This enhances the operability of multiple sections of a corporate structure, increasing the productivity of the company.

COVID-19 has boosted content creation, especially social media content, due to high internet and 4G/5G networks. The transformation through the rising trend of AI – Integrated ECM systems are classifying, analyzing, and categorizing the data and information. AI-based technologies like image recognition, voice recognition, and machine learning.

Enterprise content management tools are used in 80% of unstructured data, and 70% of data is from written documents and comments. This pushes the sales of enterprise content management systems.

Data security and compliance while shifting and transferring data and information is the biggest concern in the enterprise content management market, restricting the sales of enterprise content management solutions. Company's content is largely confidential data that is very important such as accounts, recruitment data, and framework data.

Another factor that challenges the enterprise's content management is the lack of a skilled workforce and poor management. Employees need to go through skilled training programs that cost huge capital investment of the companies. Especially, covid-19 has decreased the per year revenue that can be invested.

What is the Segmentation Outlook for the Enterprise Content Management Market?

The enterprise content management market is categorized by component, enterprise size, solution and industry vertical. These categories are further divided into small segments that expand their channels in multiple market spaces. These segments perform differently in multiple markets as they have a strong hold in multiple regions.

The deployment category is segmented into software and services while enterprise size is segmented into small & medium enterprises (SME’s), large enterprises. The solution category is divided into document management, content management, case management, workflow management, record management, digital asset management, eDiscovery and industry vertical category hold segments; BFSI, Education, Government & Public, Healthcare, Manufacturing, Media & Entertainment, Retail and Telecom & IT.

Which Segment is likely to Lead the Enterprise Content Management Market by Component?

By component, the FMI study finds that the software type of deployment has the highest sales potential through 2033. The adoption of software systems is likely to grow at a CAGR of 8.8% during the forecast period.

Consumer demand for software systems is attributed to their characteristics like easy implementation, better availability, and low maintenance cost. In the future, sales of software-based enterprise content management systems are estimated to grow excessively in order to provide better end-user experience, security, and management tools. This pushes the sales of enterprise content management systems in the new regions.

Which Segment is likely to Lead the Enterprise Content Management Market by Enterprise Size?

By solutions, large enterprises are the biggest segment in the enterprise content management market and are expected to hold the largest portion in the forecast period. The segment is thriving at a strong CAGR of 8.2%.

The factors behind the growth of this segment are excessive use of enterprise content management and longer shelf life as these enterprises keep on upgrading the software. Small and medium sized enterprises also perform better than before as covid-19 has triggered the demand for enterprise content management solutions.

What is the Regional Analysis for the Enterprise Content Management Market?

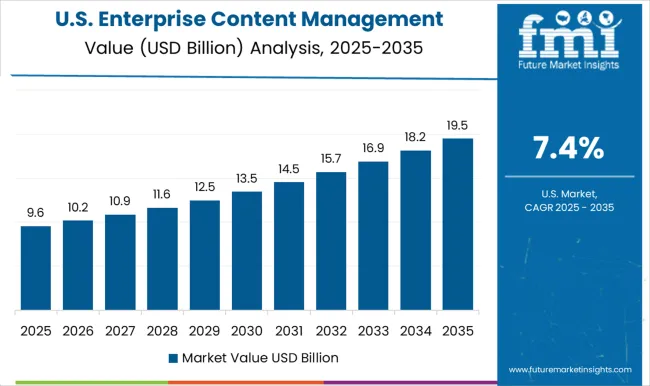
The enterprise content management market is divided into regions; North America, Latin America, Asia Pacific, Middle East and Africa (MEA) and Europe. The biggest market is United States, thriving at a CAGR of 8.4% between 2023 to 2033.

The region is expected to hold a market revenue of USD 10.5 Billion by the end of 2033. US holds the biggest forecasted revenue share as it has almost completed the digitization phase while India is the highest growing market for enterprise content management market due to excessively growing corporate spaces. India region will hold USD 2.5 Billion by the end of 2033 as it thrives on a promising CAGR of 10.4% between 2023 to 2033.

Japan also grows along with India the forecasted value of USD 2 Billion (2033) at a CAGR of 9.6% between 2023 to 2033 while China has the second biggest forecasted revenue of USD 3.2 Billion (2033) at a CAGR of 9.1%.

Regions CAGR (2023 to 2033)
United States 8.4%
United Kingdom 8.4%
China 9.1%
Japan 9.6%
India 10.4%

United States hold the biggest portion in the enterprise content management market.

India is the highest growing market in the making the Asian region the highest growing region, adding Japan that is the second highest growing market for enterprise content management market with a CAGR of 9.6% between (2023 to 2033).

Growing management sector, rising IT & corporate and advent of new cutting-edge technologies like AI and ML in Asian countries like India, China and Japan are pushing the demand for enterprise content management system in the region.
How is the Competition in the Enterprise Content Management Market?

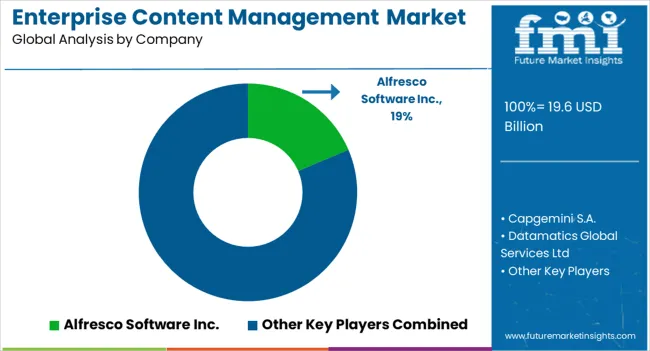
The competitive landscape of enterprise content management is diversified and makes the market more exclusive for new players. Companies also release their new updated enterprise content management systems that help in enlarging their customer base. The vendor companies focus on mergers and collaborations to expand their distribution channels in new regions.

Recent Developments in the Enterprise Content Management Market

  • Alfresco software Inc. has launched its ECM solutions like have citizen services, claims management, policy & procedure and case management, fueling the sales of enterprise content management system.
  • Capgemini S.A. has upgraded its enterprise content management solution that covers industries such as automotive, BFSI, energy and utilities etc., fueling the demand for enterprise content management system.

Scope Of Report

Attributes Details
Forecast Period 2023 to 2033
Historical Data Available for 2018 to 2022
Market Analysis USD Billion for Value
Key Regions Covered North America; Latin America; Europe; East Asia; South Asia & Pacific; Middle East & Africa
Key Countries Covered The USA, Canada, Brazil, Mexico, Germany, the United Kingdom, France, Italy, Spain, Russia, China, Japan, South Korea, India, Malaysia, Indonesia, Singapore, Australia & New Zealand, GCC Countries, Turkey, North Africa, and South Africa
Key Segments Covered Component, Enterprise Size, Solution, Industry, and Region
Key Companies Profiled Alfresco Software Inc.; Capgemini; Datamatics Global Services Ltd; EMC Corporation; Hyland Software Inc.; IBM Corporation; Laserfiche; M-files Inc.; Newgen Software; OpenText Corporation; Pennywise Solutions; SAP; Systemware Inc.; TCS
Report Coverage Market Forecast, Company Share Analysis, Competition Intelligence, DROT Analysis, Market Dynamics and Challenges, and Strategic Growth Initiatives
Customization & Pricing Available upon Request

Enterprise Content Management Key Segments

By Component:

  • ECM Software
    • On-premise
    • Cloud based
  • Services
    • Consulting
    • System Integration
    • Operation & Maintenance

By Enterprise Size:

  • Small & Medium Enterprise (SME’s)
  • Large Enterprises

By Solution:

  • Document Management
  • Content Management
  • Case Management
  • Workflow Management
  • Record Management
  • Digital Asset Management
  • eDiscovery

By Industry Vertical:

  • Banking, Financial Institutions, and Insurance (BFSI)
  • Education
  • Government & Public
  • Healthcare
  • Media & Entertainment
  • Retail
  • Telecom & IT
  • Manufacturing

By Region:

  • North America
  • Latin America
  • Asia Pacific
  • Middle East and Africa
  • Europe

Table of Content

  • 1. Executive Summary
  • 2. Market Overview
  • 3. Key Market Trends
  • 4. Pricing Analysis
  • 5. Global Market Demand (Value in USD Million) Analysis 2018 to 2022 and Forecast, 2023 to 2033
  • 6. Market Background
  • 7. Global Market Analysis 2018 to 2022 and Forecast 2023 to 2033, By Component
    • 7.1. ECM Software
      • 7.1.1. On-premise
      • 7.1.2. Cloud based
    • 7.2. Services
      • 7.2.1. Consulting
      • 7.2.2. System Integration
      • 7.2.3. Operation & Maintenance
  • 8. Global Market Analysis 2018 to 2022 and Forecast 2023 to 2033, By Enterprise Size
    • 8.1. Large Enterprises
    • 8.2. Small and Mid-sized Enterprises (SMEs)
  • 9. Global Market Analysis 2018 to 2022 and Forecast 2023 to 2033, By Solution
    • 9.1. Document Management
    • 9.2. Content Management
    • 9.3. Case Management
    • 9.4. Workflow Management
    • 9.5. Record Management
    • 9.6. Digital Asset Management
    • 9.7. eDiscovery
  • 10. Global Market Analysis 2018 to 2022 and Forecast 2023 to 2033, By Industry Vertical
    • 10.1. Banking, Financial Institutions, and Insurance (BFSI)
    • 10.2. Education
    • 10.3. Government & Public
    • 10.4. Healthcare
    • 10.5. Media & Entertainment
    • 10.6. Retail
    • 10.7. Telecom & IT
    • 10.8. Manufacturing
  • 11. Global Market Analysis 2018 to 2022 and Forecast 2023 to 2033, by Region
    • 11.1. North America
    • 11.2. Latin America
    • 11.3. Europe
    • 11.4. East Asia
    • 11.5. South Asia Pacific
    • 11.6. Middle East and Africa
  • 12. North America Market Analysis 2018 to 2022 and Forecast 2023 to 2033
  • 13. Latin America Market Analysis 2018 to 2022 and Forecast 2023 to 2033
  • 14. Europe Market Analysis 2018 to 2022 and Forecast 2023 to 2033
  • 15. South Asia & Pacific Market Analysis 2018 to 2022 and Forecast 2023 to 2033
  • 16. East Asia Market Analysis 2018 to 2022 and Forecast 2023 to 2033
  • 17. Middle East and Africa Market Analysis 2018 to 2022 and Forecast 2023 to 2033
  • 18. Key Countries Analysis- Market
  • 19. Market Structure Analysis
  • 20. Competition Analysis
    • 20.1. Alfresco Software Inc.
    • 20.2. Capgemini S.A.
    • 20.3. Datamatics Global Services Ltd
    • 20.4. EMC Corporation
    • 20.5. Hyland Software Inc.
    • 20.6. IBM Corporation
    • 20.7. Laserfiche
    • 20.8. M-files Inc.
    • 20.9. Newgen Software
    • 20.10. OpenText Corporation
    • 20.11. Pennywise Solutions
    • 20.12. SAP
    • 20.13. Systemware Inc.
    • 20.14. TCS
  • 21. Assumptions and Acronyms Used
  • 22. Research Methodology

List of Tables

Table 1: Global Market Value (US$ Million) Analysis (2018 to 2022) By Component

Table 2: Global Market Value (US$ Million) Forecast (2023 to 2033) By Component

Table 3: Global Market Value (US$ Million) Analysis (2018 to 2022) By Enterprise Size

Table 4: Global Market Value (US$ Million) Forecast (2023 to 2033) By Enterprise Size

Table 5: Global Market Value (US$ Million) Analysis (2018 to 2022) By Solution

Table 6: Global Market Value (US$ Million) Forecast (2023 to 2033) By Solution

Table 7: Global Market Value (US$ Million) Analysis (2018 to 2022) By Industry Vertical

Table 8: Global Market Value (US$ Million) Forecast (2023 to 2033) By Industry Vertical

Table 9: Global Market Value (US$ Million) Analysis (2018 to 2022) By Sales Channel

Table 10: Global Market Value (US$ Million) Forecast (2018 to 2022) By Sales Channel

Table 11: Global Market Value (US$ Million) Analysis (2018 to 2022) By Region

Table 12: Global Market Value (US$ Million) Forecast (2023 to 2033) By Region

Table 13: North America Market Value (US$ Million) Analysis (2018 to 2022) By Component

Table 14: North America Market Value (US$ Million) Forecast (2023 to 2033) By Component

Table 15: North America Market Value (US$ Million) Analysis (2018 to 2022) By Enterprise Size

Table 16: North America Market Value (US$ Million) Forecast (2023 to 2033) By Enterprise Size

Table 17: North America Market Value (US$ Million) Analysis (2018 to 2022) By Solution

Table 18: North America Market Value (US$ Million) Forecast (2023 to 2033) By Solution

Table 19: North America Market Value (US$ Million) Analysis (2018 to 2022) By Industry Vertical

Table 20: North America Market Value (US$ Million) Forecast (2023 to 2033) By Industry Vertical

Table 21: North America Market Value (US$ Million) Analysis (2018 to 2022) By Sales Channel

Table 22: North America Market Value (US$ Million) Forecast (2023 to 2033) By Sales Channel

Table 23: North America Market Value (US$ Million) Analysis (2018 to 2022) by Country

Table 24: North America Market Value (US$ Million) Forecast (2023 to 2033) by Country

Table 25: Latin America Market Value (US$ Million) Analysis (2018 to 2022) By Component

Table 26: Latin America Market Value (US$ Million) Forecast (2023 to 2033) By Component

Table 27: Latin America Market Value (US$ Million) Analysis (2018 to 2022) By Enterprise Size

Table 28: Latin America Market Value (US$ Million) Forecast (2023 to 2033) By Enterprise Size

Table 29: Latin America Market Value (US$ Million) Analysis (2018 to 2022) By Solution

Table 30: Latin America Market Value (US$ Million) Forecast (2023 to 2033) By Solution

Table 31: Latin America Market Value (US$ Million) Analysis (2018 to 2022) By Industry Vertical

Table 32: Latin America Market Value (US$ Million) Forecast (2023 to 2033) By Industry Vertical

Table 33: Lain America Market Value (US$ Million) Analysis (2018 to 2022) By Sales Channel

Table 34: Latin America Market Value (US$ Million) Forecast (2023 to 2033) By Sales Channel

Table 35: Latin America Market Value (US$ Million) Analysis (2018 to 2022) by Country

Table 36: Latin America Market Value (US$ Million) Forecast (2023 to 2033) by Country

Table 37: Europe Market Value (US$ Million) Analysis (2018 to 2022) By Component

Table 38: Europe Market Value (US$ Million) Forecast (2023 to 2033) By Component

Table 39: Europe Market Value (US$ Million) Analysis (2018 to 2022) By Enterprise Size

Table 40: Europe Market Value (US$ Million) Forecast (2023 to 2033) By Enterprise Size

Table 41: Europe Market Value (US$ Million) Analysis (2018 to 2022) By Solution

Table 42: Europe Market Value (US$ Million) Forecast (2023 to 2033) By Solution

Table 43: Europe Market Value (US$ Million) Analysis (2018 to 2022) By Industry Vertical

Table 44: Europe Market Value (US$ Million) Forecast (2023 to 2033) By Industry Vertical

Table 45: Europe Market Value (US$ Million) Analysis (2018 to 2022) By Sales Channel

Table 46: Europe Market Value (US$ Million) Forecast (2023 to 2033) By Sales Channel

Table 47: Europe Market Value (US$ Million) Analysis (2018 to 2022) by Country

Table 48: Europe Market Value (US$ Million) Forecast (2023 to 2033) by Country

Table 49: South Asia & Pacific Market Value (US$ Million) Analysis (2018 to 2022) By Component

Table 50: South Asia & Pacific Market Value (US$ Million) Forecast (2023 to 2033) By Component

Table 51: South Asia & Pacific Market Value (US$ Million) Analysis (2018 to 2022) By Enterprise Size

Table 52: South Asia & Pacific Market Value (US$ Million) Forecast (2023 to 2033) By Enterprise Size

Table 53: South Asia & Pacific Market Value (US$ Million) Analysis (2018 to 2022) By Solution

Table 54: South Asia & Pacific Market Value (US$ Million) Forecast (2023 to 2033) By Solution

Table 55: South Asia & Pacific Market Value (US$ Million) Analysis (2018 to 2022) By Industry Vertical

Table 56: East Asia Market Value (US$ Million) Analysis (2018 to 2022) By Component

Table 57: East Asia Market Value (US$ Million) Forecast (2023 to 2033) By Component

Table 58: East Asia Market Value (US$ Million) Analysis (2018 to 2022) By Enterprise Size

Table 59: East Asia Market Value (US$ Million) Forecast (2023 to 2033) By Enterprise Size

Table 60: East Asia Market Value (US$ Million) Analysis (2018 to 2022) By Solution

Table 61: East Asia Market Value (US$ Million) Forecast (2023 to 2033) By Solution

Table 62: East Asia Market Value (US$ Million) Analysis (2018 to 2022) By Industry Vertical

Table 63: East Asia Market Value (US$ Million) Forecast (2023 to 2033) By Industry Vertical

Table 64: East Asia Market Value (US$ Million) Analysis (2018 to 2022) By Sales Channel

Table 65: East Asia Market Value (US$ Million) Forecast (2023 to 2033) By Sales Channel

Table 66: East Asia Market Value (US$ Million) Analysis (2018 to 2022) By Country

Table 67: East Asia market Value (US$ Million) Forecast (2023 to 2033) By Country

Table 68: Middle East and Africa Market Value (US$ Million) Analysis (2018 to 2022) By Component

Table 69: Middle East and Africa Market Value (US$ Million) Forecast (2023 to 2033) By Component

Table 70: Middle East and Africa Market Value (US$ Million) Analysis (2018 to 2022) By Enterprise Size

Table 71: Middle East and Africa Market Value (US$ Million) Forecast (2023 to 2033) By Enterprise Size

Table 72: Middle East and Africa Market Value (US$ Million) Analysis (2018 to 2022) By Solution

Table 73: Middle East and Africa Market Value (US$ Million) Forecast (2023 to 2033) By Solution

Table 74: Middle East and Africa Market Value (US$ Million) Analysis (2018 to 2022) By Industry Vertical

Table 75: Middle East and Africa Market Value (US$ Million) Forecast (2023 to 2033) By Industry Vertical

Table 76: Middle East and Africa Market Value (US$ Million) Analysis (2018 to 2022) By Sales Channel

Table 77: Middle East and Africa Market Value (US$ Million) Forecast (2023 to 2033) By Sales Channel

Table 78: Middle East and Africa Market Value (US$ Million) Analysis (2018 to 2022) By Country

Table 79: Middle East and Africa Market Value (US$ Million) Forecast (2023 to 2033) By Countryc

List of Figures

Figure 1: Global Market Size (US$ Million) and Y-o-Y Growth Rate from 2023 to 2033

Figure 2: Global Market Size and Y-o-Y Growth Rate from 2023 to 2033

Figure 3: Global Market Value (US$ Million), 2018 to 2022

Figure 4: Global Market Value (US$ Million), 2023 to 2033

Figure 5: Global Market Value Share Analysis (2023 to 2033) By Component

Figure 6: Global Market Value Y-o-Y Growth Trend Analysis (2018 to 2033) By Component

Figure 7: Global Market Attractiveness By Component

Figure 8: Global Market Value Share Analysis (2023 to 2033) By Enterprise Size

Figure 9: Global Market Value Y-o-Y Growth Trend Analysis (2018 to 2033) By Enterprise Size

Figure 10: Global Market Attractiveness By Enterprise Size

Figure 11: Global Market Value Share Analysis (2023 to 2033) By Solution

Figure 12: Global Market Value Y-o-Y Growth Trend Analysis (2018 to 2033) By Solution

Figure 13: Global Market Attractiveness By Solution

Figure 14: Global Market Value Share Analysis (2023 to 2033) By Industry Vertical

Figure 15: Global Market Value Y-o-Y Growth Trend Analysis (2018 to 2033) By Industry Vertical

Figure 16: Global Market Attractiveness By Region

Figure 17: North America Market Absolute $ Opportunity (US$ Million), 2018 to 2033

Figure 18: Latin America Market Absolute $ Opportunity (US$ Million), 2018 to 2033

Figure 19: Europe Market Absolute $ Opportunity (US$ Million), 2018 to 2033

Figure 20: East Asia Market Absolute $ Opportunity (US$ Million), 2018 to 2033

Figure 21: South Asia & Pacific Market Absolute $ Opportunity (US$ Million), 2018 to 2033

Figure 22: Middle East & Africa Market Absolute $ Opportunity (US$ Million), 2018 to 2033

Figure 23: North America Market V1 alue (US$ Million), 2018 to 2022

Figure 24: North America Market V2 alue (US$ Million), 2023 to 2033

Figure 25: North America Market V3 alue Share Analysis (2023 to 2033) By Component

Figure 26: North America Market V4 alue Y-o-Y Growth Trend Analysis (2018 to 2033) By Component

Figure 27: North America Market A5 ttractiveness By Component

Figure 28: North America Market V6 alue Share Analysis (2023 to 2033) By Enterprise Size

Figure 29: North America Market V7 alue Y-o-Y Growth Trend Analysis (2018 to 2033) By Enterprise Size

Figure 30: North America Market A8 ttractiveness By Enterprise Size

Figure 31: North America Market V9 alue Share Analysis (2023 to 2033) By Solution

Figure 32: North America Market V10 alue Y-o-Y Growth Trend Analysis (2018 to 2033) By Solution

Figure 33: North America Market A11 ttractiveness By Solution

Figure 34: North America Market V12 alue Share Analysis (2023 to 2033) By Industry Vertical

Figure 35: North America Market V13 alue Y-o-Y Growth Trend Analysis (2018 to 2033) By Industry Vertical

Figure 36: North America Attracti14 veness By Industry Vertical

Figure 37: North America Market V15 alue Share Analysis (2023 to 2033) By Sales Channel

Figure 38: North America Market V16 alue Y-o-Y Growth Trend Analysis (2018 to 2033) By Sales Channel

Figure 39: North America Market A17 ttractiveness By Sales Channel

Figure 40: North America Market A18 ttractiveness By Country

Figure 41: USA Market Absolute $ 19 Opportunity (US$ Million), 2018 to 2033

Figure 42: Canada Market Absolute20 $ Opportunity (US$ Million), 2018 to 2033

Figure 43: Latin America Market V21 alue (US$ Million), 2018 to 2022

Figure 44: Latin America Market V22 alue (US$ Million), 2023 to 2033

Figure 45: Latin America Market V23 alue Share Analysis (2023 to 2033) By Component

Figure 46: Latin America Market V24 alue Y-o-Y Growth Trend Analysis (2018 to 2033) By Component

Figure 47: Latin America Market A25 ttractiveness By Component

Figure 48: Latin America Market V26 alue Share Analysis (2023 to 2033) By Enterprise Size

Figure 49: Latin America Market V27 alue Y-o-Y Growth Trend Analysis (2018 to 2033) By Enterprise Size

Figure 50: Latin America Market A28 ttractiveness By Enterprise Size

Figure 51: Latin America Market V29 alue Share Analysis (2023 to 2033) By Solution

Figure 52: Latin America Market V30 alue Y-o-Y Growth Trend Analysis (2018 to 2033) By Solution

Figure 53: Latin America Market A31 ttractiveness By Solution

Figure 54: Latin America Market V32 alue Share Analysis (2023 to 2033) By Industry Vertical

Figure 55: Latin America Market V33 alue Y-o-Y Growth Trend Analysis (2018 to 2033) By Industry Vertical

Figure 56: Latin America Market A34 ttractiveness By Industry Vertical

Figure 57: Latin America Market V35 alue Share Analysis (2023 to 2033) By Sales Channel

Figure 58: Latin America Market V36 alue Y-o-Y Growth Trend Analysis (2018 to 2033) By Sales Channel

Figure 59: Latin America Market A37 ttractiveness By Sales Channel

Figure 60: Latin America Market A38 ttractiveness By Country

Figure 61: Brazil Market Ab39 solute $ Opportunity (US$ Million), 2018 to 2033

Figure 62: Mexico Market Absolute40 $ Opportunity (US$ Million), 2018 to 2033

Figure 63: Rest of Latin A41 merica Market Absolute $ Opportunity (US$ Million), 2018 to 2033

Figure 64: Europe Market Value (U42 S$ Million), 2018 to 2022

Figure 65: Europe Market Value (U43 S$ Million), 2023 to 2033

Figure 66: Europe Market Value Sh44 are Analysis (2023 to 2033) By Component

Figure 67: Europe Market Value Y-45 o-Y Growth Trend Analysis (2018 to 2033) By Component

Figure 68: Europe Market Attracti46 veness By Component

Figure 69: Europe Market Value Sh47 are Analysis (2023 to 2033) By Enterprise Size

Figure 70: Europe Market Value Y-48 o-Y Growth Trend Analysis (2018 to 2033) By Enterprise Size

Figure 71: Europe Market Attracti49 veness By Enterprise Size

Figure 72: Europe Market Value Sh50 are Analysis (2023 to 2033) By Solution

Figure 73: Europe Market Value Y-51 o-Y Growth Trend Analysis (2018 to 2033) By Solution

Figure 74: Europe Market Attracti52 veness By Solution

Figure 75: Europe Market Value Sh53 are Analysis (2023 to 2033) By Industry Vertical

Figure 76: Europe Market Value Y-54 o-Y Growth Trend Analysis (2018 to 2033) By Industry Vertical

Figure 77: Europe Market Attracti55 veness By Industry Vertical

Figure 78: Europe Market Value Sh56 are Analysis (2023 to 2033) By Sales Channel

Figure 79: Europe Market Value Y-57 o-Y Growth Trend Analysis (2018 to 2033) By Sales Channel

Figure 80: Europe Market Attracti58 veness By Sales Channel

Figure 81: Europe Market Attracti59 veness By Country

Figure 82: Germany Market Absolut60 e $ Opportunity (US$ Million), 2018 to 2033

Figure 83: Italy Market Absolute 61 $ Opportunity (US$ Million), 2018 to 2033

Figure 84: France Market Absolute62 $ Opportunity (US$ Million), 2018 to 2033

Figure 85: United Kingdom Market 63 Absolute $ Opportunity (US$ Million), 2018 to 2033

Figure 86: Spain Market Absolute 64 $ Opportunity (US$ Million), 2018 to 2033

Figure 87: BENELUX Market Absolut65 e $ Opportunity (US$ Million), 2018 to 2033

Figure 88: Russia Market Absolute66 $ Opportunity (US$ Million), 2018 to 2033

Figure 89: Rest of Europe Market 67 Absolute $ Opportunity (US$ Million), 2018 to 2033

Figure 90: South Asia & Pacif68 ic Market Value (US$ Million), 2018 to 2022

Figure 91: South Asia & Pacif69 ic Market Value (US$ Million), 2023 to 2033

Figure 92: South Asia & Pacif70 ic Market Value Share Analysis (2023 to 2033) By Component

Figure 93: South Asia & Pacif71 ic Market Value Y-o-Y Growth Trend Analysis (2018 to 2033) By Component

Figure 94: South Asia & Pacif72 ic Market Attractiveness By Component

Figure 95: South Asia & Pacif73 ic Market Value Share Analysis (2023 to 2033) By Enterprise Size

Figure 96: South Asia & Pacif74 ic Market Value Y-o-Y Growth Trend Analysis (2018 to 2033) By Enterprise Size

Figure 97: South Asia & Paci75 fic Market Attractiveness By Enterprise Size

Figure 98: South Asia & Paci76 fic Market Value Share Analysis (2023 to 2033) By Solution

Figure 99: South Asia & Paci77 fic Market Value Y-o-Y Growth Trend Analysis (2018 to 2033) By Solution

Figure 100: South Asia & Paci78 fic Market Attractiveness By Solution

Figure 101: South Asia & Paci79 fic Market Value Share Analysis (2023 to 2033) By Industry Vertical

Figure 102: South Asia & Paci80 fic Market Value Y-o-Y Growth Trend Analysis (2018 to 2033) By Industry Vertical

Figure 103: South Asia & paci81 fic Market Attractiveness By Industry Vertical

Figure 104: South Asia & Paci82 fic Market Value Share Analysis (2023 to 2033) By Sales Channel

Figure 105: South Asia & Paci83 fic Market Value Y-o-Y Growth Trend Analysis (2018 to 2033) By Sales Channel

Figure 106: South Asia & Paci84 fic Market Attractiveness By Sales Channel

Figure 107: South Asia & Paci85 fic Market Attractiveness By Country

Figure 108: India Market Absolute86 $ Opportunity (US$ Million), 2018 to 2033

Figure 109: Indonesia Market Abso87 lute $ Opportunity (US$ Million), 2018 to 2033

Figure 110: Malaysia Market Absol88 ute $ Opportunity (US$ Million), 2018 to 2033

Figure 111: Singapore Market Abso89 lute $ Opportunity (US$ Million), 2018 to 2033

Figure 112: Australia& New Ze90 aland Market Absolute $ Opportunity (US$ Million), 2018 to 2033

Figure 113: Rest of South Asia &a91 mp; Pacific Market Absolute $ Opportunity (US$ Million), 2018 to 2033

Figure 114: East Asia Market Valu92 e (US$ Million), 2018 to 2022

Figure 115: East Asia Market Valu93 e (US$ Million), 2023 to 2033

Figure 116: East Asia Market Valu94 e Share Analysis (2023 to 2033) By Component

Figure 117: East Asia Market Valu95 e Y-o-Y Growth Trend Analysis (2018 to 2033) By Component

Figure 118: East Asia Market Attr96 activeness By Component

Figure 119: East Asia Market Valu97 e Share Analysis (2023 to 2033) By Enterprise Size

Figure 120: East Asia Market Valu98 e Y-o-Y Growth Trend Analysis (2018 to 2033) By Enterprise Size

Figure 121: East Asia Market Attr99 activeness By Enterprise Size

Figure 122: East Asia Market Valu100e Share Analysis (2023 to 2033) By Solution

Figure 123: East Asia Market Valu101e Y-o-Y Growth Trend Analysis (2018 to 2033) By Solution

Figure 124: East Asia Market Attr102activeness By Solution

Figure 125: East Asia Market Valu103e Share Analysis (2023 to 2033) By Industry Vertical

Figure 126: East Asia Market Valu104e Y-o-Y Growth Trend Analysis (2018 to 2033) By Industry Vertical

Figure 127: East Asia Market Attr105activeness By Industry Vertical

Figure 128: East Asia Market Valu106e Share Analysis (2023 to 2033) By Sales Channel

Figure 129: East Asia Market Valu107e Y-o-Y Growth Trend Analysis (2018 to 2033) By Sales Channel

Figure 130: East Asia Market Attr108activeness By Sales Channel

Figure 131: East Asia Market Attr109activeness By Country

Figure 132: China Market Absolute110 $ Opportunity (US$ Million), 2018 to 2033

Figure 133: Japan Market Absolute111 $ Opportunity (US$ Million), 2018 to 2033

Figure 134: South Korea Market Ab112solute $ Opportunity (US$ Million), 2018 to 2033

Figure 135: Middle East and Afric113a Market Value (US$ Million), 2018 to 2022

Figure 136: Middle East and Afric114a Market Value (US$ Million), 2023 to 2033

Figure 137: Middle East and Afric115a Market Value Share Analysis (2023 to 2033) By Component

Figure 138: Middle East and Afric116a Market Value Y-o-Y Growth Trend Analysis (2018 to 2033) By Component

Figure 139: Middle East and Afric117a Market Attractiveness By Component

Figure 140: Middle East and Afric118a Market Value Share Analysis (2023 to 2033) By Enterprise Size

Figure 141: Middle East and Afric119a Market Value Y-o-Y Growth Trend Analysis (2018 to 2033) By Enterprise Size

Figure 142: Middle East and Afric120a Market Attractiveness By Enterprise Size

Figure 143: Middle East and Afric121a Market Value Share Analysis (2023 to 2033) By Solution

Figure 144: Middle East and Afric122a Market Value Y-o-Y Growth Trend Analysis (2018 to 2033) By Solution

Figure 145: Middle East and Afric123a Market Attractiveness By Solution

Figure 146: Middle East and Afric124a Market Value Share Analysis (2023 to 2033) By Industry Vertical

Figure 147: Middle East and Afric125a Market Value Y-o-Y Growth Trend Analysis (2018 to 2033) By Industry Vertical

Figure 148: Middle East and Afric126a Market Attractiveness By Industry Vertical

Figure 149: Middle East and Afric127a Market Value Share Analysis (2023 to 2033) By Sales Channel

Figure 150: Middle East and Afric128a Market Value Y-o-Y Growth Trend Analysis (2018 to 2033) By Sales Channel

Figure 151: Middle East and Afric129a Market Attractiveness By Sales Channel

Figure 152: Middle East and Afric130a Market Attractiveness By Country

Figure 153: GCC Countries Market 131Absolute $ Opportunity (US$ Million), 2018 to 2033

Figure 154: Turkey Market Absolut132e $ Opportunity (US$ Million), 2018 to 2033

Figure 155: South Africa Market A133bsolute $ Opportunity (US$ Million), 2018 to 2033

Figure 156: Rest of Middle East a134nd Africa Market Absolute $ Opportunity (US$ Million), 2018 to 2033

Frequently Asked Questions

What is the estimated market size for the Enterprise Content Management market?

The market is valued at USD 16.6 billion in 2023.

By component, which segment is leading the market?

The software segment is expected to lead the market.

Which region has the highest growth potential for the market?

Asia Pacific is expected to exhibit the highest growth potential in the market.

What is the United States’ market value?

The United States will reach USD 10.5 billion by 2033.

What are key opportunities for market players?

Increasing workflow efficiency, and security to provide key opportunities.

Explore Vertical Solution Insights

Future Market Insights

Enterprise Content Management Market