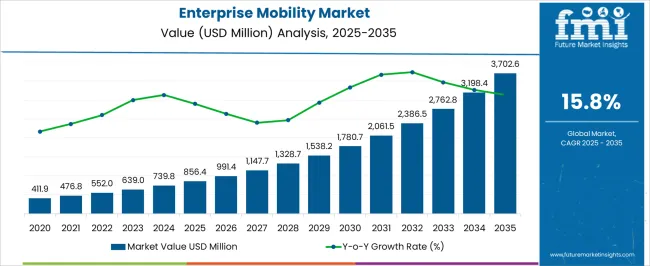
The overall market is anticipated to have a steady CAGR of 16.5% during the forecast period. The enterprise mobility market is predicted to grow from USD 630,994 million in 2023 to USD 2,913,487 million by 2033.
The expansion of the worldwide corporate mobility market is fuelled by an increase in data and mobile devices in enterprises and an increase in cloud and mobile applications in various industries.
The growing mobile workforce and enterprise adoption of BYOD initiatives to improve worker productivity. Allowing employees to work from anywhere, anytime, and corporate access data on the go, have increased demand for enterprise mobility solutions. Furthermore, the growth of new mobile devices on the market encourages regions to install mobile device management solutions.
Unified employee communications and increased cooperation are two key enterprise mobility industry drivers. By safeguarding data, apps, and devices and simplifying mobile strategy, enterprise mobility has enticed firms to adopt trends such as bring your device (BYOD), resulting in lower costs and higher productivity.
However, issues affecting the market include identity and access management (IAM), which entails granting access to sensitive information only to authorized sources. Security and risk, which involves cross-platform security controls such as different modules or programs for other devices. Mobile app development, which entails user-friendly, up-to-date, and well-designed apps. Whereas, collaboration and content, which entails syncing of laptop and mobile software.
Attributes | Details |
---|---|
Enterprise Mobility Market Valuation in 2022 | USD 510,100.2 million |
Estimated Global Market Share in 2023 | USD 630,994 million |
Forecasted Global Market Size by 2033 | USD 2,913,487 million |
Projected Global Market Growth Rate from 2023 to 2033 | 16.5% CAGR |
The net valuation of the market was merely USD 221,060 million by the end of the year 2018. Though the market progressed moderately in the following years, the sudden pandemic outbreak proved to be bliss for at least this market. With a steep growth in adopting enterprise mobility services, the average market recorded a CAGR of 23.2% until 2022.
As per the market study, employers are obligated to provide remote access alternatives to their employees in response to the widespread transmission of COVID-19, allowing them to work outside of the company infrastructure. Providing employees with the option of working from home is an intelligent way to avoid the spread of viruses in the office.
To maintain company continuity during this pandemic, many firms adopted a BYOD policy allowing employees to use their devices for work. Organizations that utilize a remote workforce ensure that employees have access to company resources while working from home and that they have the tools they need to stay productive. As a result of these factors, large corporations are using enterprise mobility solutions.
Enterprise mobility is becoming more popular because it allows businesses to operate remotely, update, and delete data from devices. As per the critical enterprise mobility adoption trends, remote workforces and MDM are more vital than ever. Unmanaged remote endpoints are among the most severe threats to a company's cyber-security today.
Enterprises have invested significant sums of money in recent months to roll out more robust VPN solutions and mobile devices (laptops and tablets) to allow employees to work remotely, but security appears to have taken a backseat to these more extensive efforts to keep workers employed and productive.
Another element of market solutions is remote wiping, which may permanently delete any files on a gadget via a trigger if it is damaged or destroyed, preventing the loss of critical data. Enterprise mobility and the capacity to detect and mitigate vulnerabilities on distant endpoints are no longer a luxury but a necessity.
Enterprise Mobility Systems can Meet any Business Demand for a Consistent End-user Experience
Providers of enterprise mobility solutions need help to customize the solution to fit unique company requirements. Enterprises commonly express unhappiness with the enterprise mobility solution's inability to meet multi-user connections' speed and adaptability.
Vendors face various challenges when implementing enterprise mobility into an organization's existing vulnerability management compliance. For mobile devices that connect to the internal network, each firm has its own set of security needs. By allowing an IT administrator to administer and monitor systems from a single place, the right enterprise mobility solution may increase quality and reliability.
Every organization has business requirements, and gaining a good grasp of what a corporation requires is quite challenging. Enterprise mobility systems should be implemented uniquely for each company's needs to guarantee a consistent end-user interface.
On-premise enterprise mobility solutions ensure that company data is secure and in compliance with all industry laws while allowing for safe employee mobility.
The cloud enterprise mobility segment is predicted to grow at a faster rate than the deployment segment. The Software-as-a-Service (SaaS) concept is used in cloud-based solutions, and customers can access enterprise mobility solutions digitally via the Internet.
Cloud-based EMM solutions, on the other hand, have several drawbacks, including a lack of control over apps, tight government laws, and private content. Because of the linked functionality and critical features, the general adoption of cloud enterprise mobility solutions is expected to rise and be high during the forecast period.
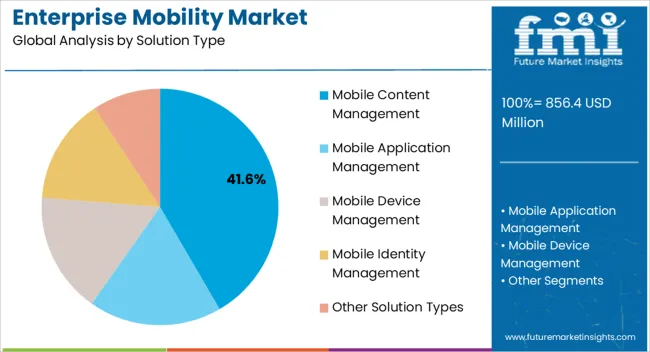
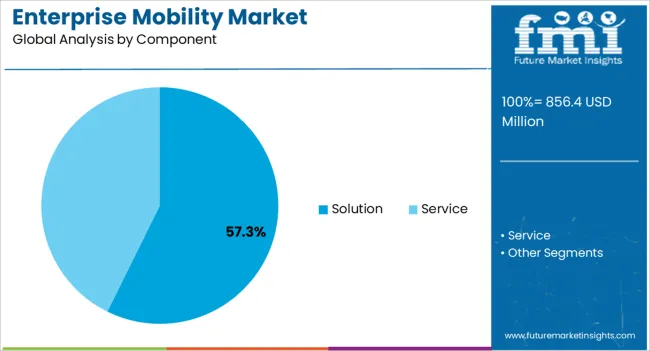
Category | By Component |
---|---|
Top Segment | Solution |
Market Share in Percentage | 62.3% |
Category | By Deployment |
---|---|
Top Segment | On-premise |
Market Share in Percentage | 62.2% |
The usage of enterprise mobility systems has risen in response to the growing BYOD trend in the BFSI industry. Several BFSI firms are increasingly emphasizing workplace mobility as a means of promoting employee productivity and satisfaction.
Enterprise mobility solutions are offered via the cloud in this deployment style. Flexibility, scalability, affordability, operational efficiency, and minimal expenses are all advantages of using cloud-based enterprise mobility solutions. ABANCA, for example, one of the central banks in Galicia (Spain), needed a versatile, extendable platform that allows its IT department to handle COPE devices.
Regional Market Comparison | Global Market Share in Percentage |
---|---|
North America | 28.4% |
Europe | 21.3% |
The existence of top enterprise mobility solution vendors in the region can be credited for this increase. Increased usage of enterprise mobility solutions in leading industries like retail, BFSI, and others to support remote working and real-time data analysis and management are driving market expansion.
As per the market study, the on-premise segment in Brazil is expected to grow at a CAGR of roughly 15% through 2026, owing to increasing concerns about enterprise data security and tight compliance rules.
Regional Market Comparison | Global Market Share in Percentage |
---|---|
United States | 15.4% |
Germany | 9.2% |
Japan | 5.3% |
Australia | 4.1% |
Rising investments in the development of enterprise mobility technologies are likely to have a beneficial impact on market growth over the next few years. Employee productivity is increased by allowing them to work in more pleasant locations outside of the organization's walls.
Failure to connect mobile devices with complicated systems may result in information silos, which occur when essential data is only available on one device and is not shared with the company's network. An information silo can be created by an employee who works from home on occasion and fails to transmit vital files after switching to another organization. This creates an essential need for enterprise mobility systems to be in place in an organization.
Regions | CAGR (2023 to 2033) |
---|---|
United Kingdom | 12.1% |
China | 14.3% |
India | 18.5% |
There are several prominent companies in the enterprise mobility management industry, which is moderately competitive. Few big firms currently dominate the market in terms of market share. Companies in this field invest a lot of money in research and development.
Collaboration, joint ventures, and mergers and acquisitions are among the business tactics that have allowed enterprise mobility management enterprises to remain competitive in the market.
The key enterprise mobility management market trends indicate that many businesses feel that by updating their current portfolio, they are likely to attract more clients. Firms are looking at the solutions given by corporate mobility companies to gain a much sought-after competitive advantage.
Some Recent Developments in the Enterprise Mobility Market
IBM introduced Watson Works in June 2020 to address the barriers to returning to work. Watson Works is a selected group of products that incorporate Watson AI models and applications to assist businesses in navigating many parts of the return-to-work problem following COVID-19 lockdowns.
During the COVID-19 epidemic, Citrix and Microsoft teamed up in July 2020 to create future flexible workspaces. Citrix Workspace can be chosen as a preferred digital workspace solution by Microsoft. Microsoft Azure is likely to be selected from Citrix as a preferred cloud platform, allowing Citrix's existing on-premises clients to work anywhere, on any device.
Cisco announced an agreement to buy IMImobile in December 2020. Both businesses have agreed to the parameters of a proposed cash offer in which Cisco may pay 595 pence per share for each share of IMImobile, for a total purchase price of roughly USD 730 million (assuming fully diluted shares, net of cash and debt).
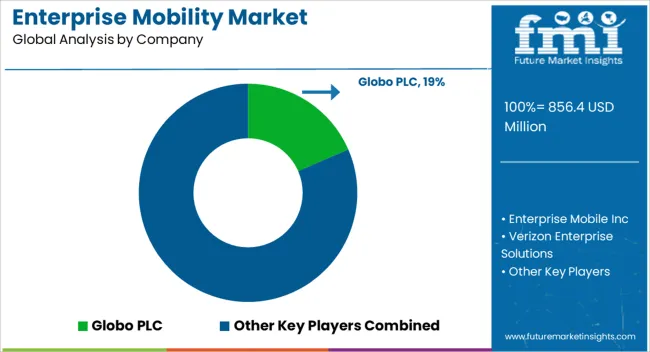
Table 1: Global Market Value (US$ Million) Forecast by Region, 2018 to 2033
Table 2: Global Market Value (US$ Million) Forecast by Component, 2018 to 2033
Table 3: Global Market Value (US$ Million) Forecast by Deployment, 2018 to 2033
Table 4: Global Market Value (US$ Million) Forecast by Enterprise Size, 2018 to 2033
Table 5: Global Market Value (US$ Million) Forecast by Device Type, 2018 to 2033
Table 6: Global Market Value (US$ Million) Forecast by Vertical, 2018 to 2033
Table 7: North America Market Value (US$ Million) Forecast by Country, 2018 to 2033
Table 8: North America Market Value (US$ Million) Forecast by Component, 2018 to 2033
Table 9: North America Market Value (US$ Million) Forecast by Deployment, 2018 to 2033
Table 10: North America Market Value (US$ Million) Forecast by Enterprise Size, 2018 to 2033
Table 11: North America Market Value (US$ Million) Forecast by Device Type, 2018 to 2033
Table 12: North America Market Value (US$ Million) Forecast by Vertical, 2018 to 2033
Table 13: Latin America Market Value (US$ Million) Forecast by Country, 2018 to 2033
Table 14: Latin America Market Value (US$ Million) Forecast by Component, 2018 to 2033
Table 15: Latin America Market Value (US$ Million) Forecast by Deployment, 2018 to 2033
Table 16: Latin America Market Value (US$ Million) Forecast by Enterprise Size, 2018 to 2033
Table 17: Latin America Market Value (US$ Million) Forecast by Device Type, 2018 to 2033
Table 18: Latin America Market Value (US$ Million) Forecast by Vertical, 2018 to 2033
Table 19: Europe Market Value (US$ Million) Forecast by Country, 2018 to 2033
Table 20: Europe Market Value (US$ Million) Forecast by Component, 2018 to 2033
Table 21: Europe Market Value (US$ Million) Forecast by Deployment, 2018 to 2033
Table 22: Europe Market Value (US$ Million) Forecast by Enterprise Size, 2018 to 2033
Table 23: Europe Market Value (US$ Million) Forecast by Device Type, 2018 to 2033
Table 24: Europe Market Value (US$ Million) Forecast by Vertical, 2018 to 2033
Table 25: South Asia Market Value (US$ Million) Forecast by Country, 2018 to 2033
Table 26: South Asia Market Value (US$ Million) Forecast by Component, 2018 to 2033
Table 27: South Asia Market Value (US$ Million) Forecast by Deployment, 2018 to 2033
Table 28: South Asia Market Value (US$ Million) Forecast by Enterprise Size, 2018 to 2033
Table 29: South Asia Market Value (US$ Million) Forecast by Device Type, 2018 to 2033
Table 30: South Asia Market Value (US$ Million) Forecast by Vertical, 2018 to 2033
Table 31: East Asia Market Value (US$ Million) Forecast by Country, 2018 to 2033
Table 32: East Asia Market Value (US$ Million) Forecast by Component, 2018 to 2033
Table 33: East Asia Market Value (US$ Million) Forecast by Deployment, 2018 to 2033
Table 34: East Asia Market Value (US$ Million) Forecast by Enterprise Size, 2018 to 2033
Table 35: East Asia Market Value (US$ Million) Forecast by Device Type, 2018 to 2033
Table 36: East Asia Market Value (US$ Million) Forecast by Vertical, 2018 to 2033
Table 37: Oceania Market Value (US$ Million) Forecast by Country, 2018 to 2033
Table 38: Oceania Market Value (US$ Million) Forecast by Component, 2018 to 2033
Table 39: Oceania Market Value (US$ Million) Forecast by Deployment, 2018 to 2033
Table 40: Oceania Market Value (US$ Million) Forecast by Enterprise Size, 2018 to 2033
Table 41: Oceania Market Value (US$ Million) Forecast by Device Type, 2018 to 2033
Table 42: Oceania Market Value (US$ Million) Forecast by Vertical, 2018 to 2033
Table 43: MEA Market Value (US$ Million) Forecast by Country, 2018 to 2033
Table 44: MEA Market Value (US$ Million) Forecast by Component, 2018 to 2033
Table 45: MEA Market Value (US$ Million) Forecast by Deployment, 2018 to 2033
Table 46: MEA Market Value (US$ Million) Forecast by Enterprise Size, 2018 to 2033
Table 47: MEA Market Value (US$ Million) Forecast by Device Type, 2018 to 2033
Table 48: MEA Market Value (US$ Million) Forecast by Vertical, 2018 to 2033
Figure 1: Global Market Value (US$ Million) by Component, 2023 to 2033
Figure 2: Global Market Value (US$ Million) by Deployment, 2023 to 2033
Figure 3: Global Market Value (US$ Million) by Enterprise Size, 2023 to 2033
Figure 4: Global Market Value (US$ Million) by Device Type, 2023 to 2033
Figure 5: Global Market Value (US$ Million) by Vertical, 2023 to 2033
Figure 6: Global Market Value (US$ Million) by Region, 2023 to 2033
Figure 7: Global Market Value (US$ Million) Analysis by Region, 2018 to 2033
Figure 8: Global Market Value Share (%) and BPS Analysis by Region, 2023 to 2033
Figure 9: Global Market Y-o-Y Growth (%) Projections by Region, 2023 to 2033
Figure 10: Global Market Value (US$ Million) Analysis by Component, 2018 to 2033
Figure 11: Global Market Value Share (%) and BPS Analysis by Component, 2023 to 2033
Figure 12: Global Market Y-o-Y Growth (%) Projections by Component, 2023 to 2033
Figure 13: Global Market Value (US$ Million) Analysis by Deployment, 2018 to 2033
Figure 14: Global Market Value Share (%) and BPS Analysis by Deployment, 2023 to 2033
Figure 15: Global Market Y-o-Y Growth (%) Projections by Deployment, 2023 to 2033
Figure 16: Global Market Value (US$ Million) Analysis by Enterprise Size, 2018 to 2033
Figure 17: Global Market Value Share (%) and BPS Analysis by Enterprise Size, 2023 to 2033
Figure 18: Global Market Y-o-Y Growth (%) Projections by Enterprise Size, 2023 to 2033
Figure 19: Global Market Value (US$ Million) Analysis by Device Type, 2018 to 2033
Figure 20: Global Market Value Share (%) and BPS Analysis by Device Type, 2023 to 2033
Figure 21: Global Market Y-o-Y Growth (%) Projections by Device Type, 2023 to 2033
Figure 22: Global Market Value (US$ Million) Analysis by Vertical, 2018 to 2033
Figure 23: Global Market Value Share (%) and BPS Analysis by Vertical, 2023 to 2033
Figure 24: Global Market Y-o-Y Growth (%) Projections by Vertical, 2023 to 2033
Figure 25: Global Market Attractiveness by Component, 2023 to 2033
Figure 26: Global Market Attractiveness by Deployment, 2023 to 2033
Figure 27: Global Market Attractiveness by Enterprise Size, 2023 to 2033
Figure 28: Global Market Attractiveness by Device Type, 2023 to 2033
Figure 29: Global Market Attractiveness by Vertical, 2023 to 2033
Figure 30: Global Market Attractiveness by Region, 2023 to 2033
Figure 31: North America Market Value (US$ Million) by Component, 2023 to 2033
Figure 32: North America Market Value (US$ Million) by Deployment, 2023 to 2033
Figure 33: North America Market Value (US$ Million) by Enterprise Size, 2023 to 2033
Figure 34: North America Market Value (US$ Million) by Device Type, 2023 to 2033
Figure 35: North America Market Value (US$ Million) by Vertical, 2023 to 2033
Figure 36: North America Market Value (US$ Million) by Country, 2023 to 2033
Figure 37: North America Market Value (US$ Million) Analysis by Country, 2018 to 2033
Figure 38: North America Market Value Share (%) and BPS Analysis by Country, 2023 to 2033
Figure 39: North America Market Y-o-Y Growth (%) Projections by Country, 2023 to 2033
Figure 40: North America Market Value (US$ Million) Analysis by Component, 2018 to 2033
Figure 41: North America Market Value Share (%) and BPS Analysis by Component, 2023 to 2033
Figure 42: North America Market Y-o-Y Growth (%) Projections by Component, 2023 to 2033
Figure 43: North America Market Value (US$ Million) Analysis by Deployment, 2018 to 2033
Figure 44: North America Market Value Share (%) and BPS Analysis by Deployment, 2023 to 2033
Figure 45: North America Market Y-o-Y Growth (%) Projections by Deployment, 2023 to 2033
Figure 46: North America Market Value (US$ Million) Analysis by Enterprise Size, 2018 to 2033
Figure 47: North America Market Value Share (%) and BPS Analysis by Enterprise Size, 2023 to 2033
Figure 48: North America Market Y-o-Y Growth (%) Projections by Enterprise Size, 2023 to 2033
Figure 49: North America Market Value (US$ Million) Analysis by Device Type, 2018 to 2033
Figure 50: North America Market Value Share (%) and BPS Analysis by Device Type, 2023 to 2033
Figure 51: North America Market Y-o-Y Growth (%) Projections by Device Type, 2023 to 2033
Figure 52: North America Market Value (US$ Million) Analysis by Vertical, 2018 to 2033
Figure 53: North America Market Value Share (%) and BPS Analysis by Vertical, 2023 to 2033
Figure 54: North America Market Y-o-Y Growth (%) Projections by Vertical, 2023 to 2033
Figure 55: North America Market Attractiveness by Component, 2023 to 2033
Figure 56: North America Market Attractiveness by Deployment, 2023 to 2033
Figure 57: North America Market Attractiveness by Enterprise Size, 2023 to 2033
Figure 58: North America Market Attractiveness by Device Type, 2023 to 2033
Figure 59: North America Market Attractiveness by Vertical, 2023 to 2033
Figure 60: North America Market Attractiveness by Country, 2023 to 2033
Figure 61: Latin America Market Value (US$ Million) by Component, 2023 to 2033
Figure 62: Latin America Market Value (US$ Million) by Deployment, 2023 to 2033
Figure 63: Latin America Market Value (US$ Million) by Enterprise Size, 2023 to 2033
Figure 64: Latin America Market Value (US$ Million) by Device Type, 2023 to 2033
Figure 65: Latin America Market Value (US$ Million) by Vertical, 2023 to 2033
Figure 66: Latin America Market Value (US$ Million) by Country, 2023 to 2033
Figure 67: Latin America Market Value (US$ Million) Analysis by Country, 2018 to 2033
Figure 68: Latin America Market Value Share (%) and BPS Analysis by Country, 2023 to 2033
Figure 69: Latin America Market Y-o-Y Growth (%) Projections by Country, 2023 to 2033
Figure 70: Latin America Market Value (US$ Million) Analysis by Component, 2018 to 2033
Figure 71: Latin America Market Value Share (%) and BPS Analysis by Component, 2023 to 2033
Figure 72: Latin America Market Y-o-Y Growth (%) Projections by Component, 2023 to 2033
Figure 73: Latin America Market Value (US$ Million) Analysis by Deployment, 2018 to 2033
Figure 74: Latin America Market Value Share (%) and BPS Analysis by Deployment, 2023 to 2033
Figure 75: Latin America Market Y-o-Y Growth (%) Projections by Deployment, 2023 to 2033
Figure 76: Latin America Market Value (US$ Million) Analysis by Enterprise Size, 2018 to 2033
Figure 77: Latin America Market Value Share (%) and BPS Analysis by Enterprise Size, 2023 to 2033
Figure 78: Latin America Market Y-o-Y Growth (%) Projections by Enterprise Size, 2023 to 2033
Figure 79: Latin America Market Value (US$ Million) Analysis by Device Type, 2018 to 2033
Figure 80: Latin America Market Value Share (%) and BPS Analysis by Device Type, 2023 to 2033
Figure 81: Latin America Market Y-o-Y Growth (%) Projections by Device Type, 2023 to 2033
Figure 82: Latin America Market Value (US$ Million) Analysis by Vertical, 2018 to 2033
Figure 83: Latin America Market Value Share (%) and BPS Analysis by Vertical, 2023 to 2033
Figure 84: Latin America Market Y-o-Y Growth (%) Projections by Vertical, 2023 to 2033
Figure 85: Latin America Market Attractiveness by Component, 2023 to 2033
Figure 86: Latin America Market Attractiveness by Deployment, 2023 to 2033
Figure 87: Latin America Market Attractiveness by Enterprise Size, 2023 to 2033
Figure 88: Latin America Market Attractiveness by Device Type, 2023 to 2033
Figure 89: Latin America Market Attractiveness by Vertical, 2023 to 2033
Figure 90: Latin America Market Attractiveness by Country, 2023 to 2033
Figure 91: Europe Market Value (US$ Million) by Component, 2023 to 2033
Figure 92: Europe Market Value (US$ Million) by Deployment, 2023 to 2033
Figure 93: Europe Market Value (US$ Million) by Enterprise Size, 2023 to 2033
Figure 94: Europe Market Value (US$ Million) by Device Type, 2023 to 2033
Figure 95: Europe Market Value (US$ Million) by Vertical, 2023 to 2033
Figure 96: Europe Market Value (US$ Million) by Country, 2023 to 2033
Figure 97: Europe Market Value (US$ Million) Analysis by Country, 2018 to 2033
Figure 98: Europe Market Value Share (%) and BPS Analysis by Country, 2023 to 2033
Figure 99: Europe Market Y-o-Y Growth (%) Projections by Country, 2023 to 2033
Figure 100: Europe Market Value (US$ Million) Analysis by Component, 2018 to 2033
Figure 101: Europe Market Value Share (%) and BPS Analysis by Component, 2023 to 2033
Figure 102: Europe Market Y-o-Y Growth (%) Projections by Component, 2023 to 2033
Figure 103: Europe Market Value (US$ Million) Analysis by Deployment, 2018 to 2033
Figure 104: Europe Market Value Share (%) and BPS Analysis by Deployment, 2023 to 2033
Figure 105: Europe Market Y-o-Y Growth (%) Projections by Deployment, 2023 to 2033
Figure 106: Europe Market Value (US$ Million) Analysis by Enterprise Size, 2018 to 2033
Figure 107: Europe Market Value Share (%) and BPS Analysis by Enterprise Size, 2023 to 2033
Figure 108: Europe Market Y-o-Y Growth (%) Projections by Enterprise Size, 2023 to 2033
Figure 109: Europe Market Value (US$ Million) Analysis by Device Type, 2018 to 2033
Figure 110: Europe Market Value Share (%) and BPS Analysis by Device Type, 2023 to 2033
Figure 111: Europe Market Y-o-Y Growth (%) Projections by Device Type, 2023 to 2033
Figure 112: Europe Market Value (US$ Million) Analysis by Vertical, 2018 to 2033
Figure 113: Europe Market Value Share (%) and BPS Analysis by Vertical, 2023 to 2033
Figure 114: Europe Market Y-o-Y Growth (%) Projections by Vertical, 2023 to 2033
Figure 115: Europe Market Attractiveness by Component, 2023 to 2033
Figure 116: Europe Market Attractiveness by Deployment, 2023 to 2033
Figure 117: Europe Market Attractiveness by Enterprise Size, 2023 to 2033
Figure 118: Europe Market Attractiveness by Device Type, 2023 to 2033
Figure 119: Europe Market Attractiveness by Vertical, 2023 to 2033
Figure 120: Europe Market Attractiveness by Country, 2023 to 2033
Figure 121: South Asia Market Value (US$ Million) by Component, 2023 to 2033
Figure 122: South Asia Market Value (US$ Million) by Deployment, 2023 to 2033
Figure 123: South Asia Market Value (US$ Million) by Enterprise Size, 2023 to 2033
Figure 124: South Asia Market Value (US$ Million) by Device Type, 2023 to 2033
Figure 125: South Asia Market Value (US$ Million) by Vertical, 2023 to 2033
Figure 126: South Asia Market Value (US$ Million) by Country, 2023 to 2033
Figure 127: South Asia Market Value (US$ Million) Analysis by Country, 2018 to 2033
Figure 128: South Asia Market Value Share (%) and BPS Analysis by Country, 2023 to 2033
Figure 129: South Asia Market Y-o-Y Growth (%) Projections by Country, 2023 to 2033
Figure 130: South Asia Market Value (US$ Million) Analysis by Component, 2018 to 2033
Figure 131: South Asia Market Value Share (%) and BPS Analysis by Component, 2023 to 2033
Figure 132: South Asia Market Y-o-Y Growth (%) Projections by Component, 2023 to 2033
Figure 133: South Asia Market Value (US$ Million) Analysis by Deployment, 2018 to 2033
Figure 134: South Asia Market Value Share (%) and BPS Analysis by Deployment, 2023 to 2033
Figure 135: South Asia Market Y-o-Y Growth (%) Projections by Deployment, 2023 to 2033
Figure 136: South Asia Market Value (US$ Million) Analysis by Enterprise Size, 2018 to 2033
Figure 137: South Asia Market Value Share (%) and BPS Analysis by Enterprise Size, 2023 to 2033
Figure 138: South Asia Market Y-o-Y Growth (%) Projections by Enterprise Size, 2023 to 2033
Figure 139: South Asia Market Value (US$ Million) Analysis by Device Type, 2018 to 2033
Figure 140: South Asia Market Value Share (%) and BPS Analysis by Device Type, 2023 to 2033
Figure 141: South Asia Market Y-o-Y Growth (%) Projections by Device Type, 2023 to 2033
Figure 142: South Asia Market Value (US$ Million) Analysis by Vertical, 2018 to 2033
Figure 143: South Asia Market Value Share (%) and BPS Analysis by Vertical, 2023 to 2033
Figure 144: South Asia Market Y-o-Y Growth (%) Projections by Vertical, 2023 to 2033
Figure 145: South Asia Market Attractiveness by Component, 2023 to 2033
Figure 146: South Asia Market Attractiveness by Deployment, 2023 to 2033
Figure 147: South Asia Market Attractiveness by Enterprise Size, 2023 to 2033
Figure 148: South Asia Market Attractiveness by Device Type, 2023 to 2033
Figure 149: South Asia Market Attractiveness by Vertical, 2023 to 2033
Figure 150: South Asia Market Attractiveness by Country, 2023 to 2033
Figure 151: East Asia Market Value (US$ Million) by Component, 2023 to 2033
Figure 152: East Asia Market Value (US$ Million) by Deployment, 2023 to 2033
Figure 153: East Asia Market Value (US$ Million) by Enterprise Size, 2023 to 2033
Figure 154: East Asia Market Value (US$ Million) by Device Type, 2023 to 2033
Figure 155: East Asia Market Value (US$ Million) by Vertical, 2023 to 2033
Figure 156: East Asia Market Value (US$ Million) by Country, 2023 to 2033
Figure 157: East Asia Market Value (US$ Million) Analysis by Country, 2018 to 2033
Figure 158: East Asia Market Value Share (%) and BPS Analysis by Country, 2023 to 2033
Figure 159: East Asia Market Y-o-Y Growth (%) Projections by Country, 2023 to 2033
Figure 160: East Asia Market Value (US$ Million) Analysis by Component, 2018 to 2033
Figure 161: East Asia Market Value Share (%) and BPS Analysis by Component, 2023 to 2033
Figure 162: East Asia Market Y-o-Y Growth (%) Projections by Component, 2023 to 2033
Figure 163: East Asia Market Value (US$ Million) Analysis by Deployment, 2018 to 2033
Figure 164: East Asia Market Value Share (%) and BPS Analysis by Deployment, 2023 to 2033
Figure 165: East Asia Market Y-o-Y Growth (%) Projections by Deployment, 2023 to 2033
Figure 166: East Asia Market Value (US$ Million) Analysis by Enterprise Size, 2018 to 2033
Figure 167: East Asia Market Value Share (%) and BPS Analysis by Enterprise Size, 2023 to 2033
Figure 168: East Asia Market Y-o-Y Growth (%) Projections by Enterprise Size, 2023 to 2033
Figure 169: East Asia Market Value (US$ Million) Analysis by Device Type, 2018 to 2033
Figure 170: East Asia Market Value Share (%) and BPS Analysis by Device Type, 2023 to 2033
Figure 171: East Asia Market Y-o-Y Growth (%) Projections by Device Type, 2023 to 2033
Figure 172: East Asia Market Value (US$ Million) Analysis by Vertical, 2018 to 2033
Figure 173: East Asia Market Value Share (%) and BPS Analysis by Vertical, 2023 to 2033
Figure 174: East Asia Market Y-o-Y Growth (%) Projections by Vertical, 2023 to 2033
Figure 175: East Asia Market Attractiveness by Component, 2023 to 2033
Figure 176: East Asia Market Attractiveness by Deployment, 2023 to 2033
Figure 177: East Asia Market Attractiveness by Enterprise Size, 2023 to 2033
Figure 178: East Asia Market Attractiveness by Device Type, 2023 to 2033
Figure 179: East Asia Market Attractiveness by Vertical, 2023 to 2033
Figure 180: East Asia Market Attractiveness by Country, 2023 to 2033
Figure 181: Oceania Market Value (US$ Million) by Component, 2023 to 2033
Figure 182: Oceania Market Value (US$ Million) by Deployment, 2023 to 2033
Figure 183: Oceania Market Value (US$ Million) by Enterprise Size, 2023 to 2033
Figure 184: Oceania Market Value (US$ Million) by Device Type, 2023 to 2033
Figure 185: Oceania Market Value (US$ Million) by Vertical, 2023 to 2033
Figure 186: Oceania Market Value (US$ Million) by Country, 2023 to 2033
Figure 187: Oceania Market Value (US$ Million) Analysis by Country, 2018 to 2033
Figure 188: Oceania Market Value Share (%) and BPS Analysis by Country, 2023 to 2033
Figure 189: Oceania Market Y-o-Y Growth (%) Projections by Country, 2023 to 2033
Figure 190: Oceania Market Value (US$ Million) Analysis by Component, 2018 to 2033
Figure 191: Oceania Market Value Share (%) and BPS Analysis by Component, 2023 to 2033
Figure 192: Oceania Market Y-o-Y Growth (%) Projections by Component, 2023 to 2033
Figure 193: Oceania Market Value (US$ Million) Analysis by Deployment, 2018 to 2033
Figure 194: Oceania Market Value Share (%) and BPS Analysis by Deployment, 2023 to 2033
Figure 195: Oceania Market Y-o-Y Growth (%) Projections by Deployment, 2023 to 2033
Figure 196: Oceania Market Value (US$ Million) Analysis by Enterprise Size, 2018 to 2033
Figure 197: Oceania Market Value Share (%) and BPS Analysis by Enterprise Size, 2023 to 2033
Figure 198: Oceania Market Y-o-Y Growth (%) Projections by Enterprise Size, 2023 to 2033
Figure 199: Oceania Market Value (US$ Million) Analysis by Device Type, 2018 to 2033
Figure 200: Oceania Market Value Share (%) and BPS Analysis by Device Type, 2023 to 2033
Figure 201: Oceania Market Y-o-Y Growth (%) Projections by Device Type, 2023 to 2033
Figure 202: Oceania Market Value (US$ Million) Analysis by Vertical, 2018 to 2033
Figure 203: Oceania Market Value Share (%) and BPS Analysis by Vertical, 2023 to 2033
Figure 204: Oceania Market Y-o-Y Growth (%) Projections by Vertical, 2023 to 2033
Figure 205: Oceania Market Attractiveness by Component, 2023 to 2033
Figure 206: Oceania Market Attractiveness by Deployment, 2023 to 2033
Figure 207: Oceania Market Attractiveness by Enterprise Size, 2023 to 2033
Figure 208: Oceania Market Attractiveness by Device Type, 2023 to 2033
Figure 209: Oceania Market Attractiveness by Vertical, 2023 to 2033
Figure 210: Oceania Market Attractiveness by Country, 2023 to 2033
Figure 211: MEA Market Value (US$ Million) by Component, 2023 to 2033
Figure 212: MEA Market Value (US$ Million) by Deployment, 2023 to 2033
Figure 213: MEA Market Value (US$ Million) by Enterprise Size, 2023 to 2033
Figure 214: MEA Market Value (US$ Million) by Device Type, 2023 to 2033
Figure 215: MEA Market Value (US$ Million) by Vertical, 2023 to 2033
Figure 216: MEA Market Value (US$ Million) by Country, 2023 to 2033
Figure 217: MEA Market Value (US$ Million) Analysis by Country, 2018 to 2033
Figure 218: MEA Market Value Share (%) and BPS Analysis by Country, 2023 to 2033
Figure 219: MEA Market Y-o-Y Growth (%) Projections by Country, 2023 to 2033
Figure 220: MEA Market Value (US$ Million) Analysis by Component, 2018 to 2033
Figure 221: MEA Market Value Share (%) and BPS Analysis by Component, 2023 to 2033
Figure 222: MEA Market Y-o-Y Growth (%) Projections by Component, 2023 to 2033
Figure 223: MEA Market Value (US$ Million) Analysis by Deployment, 2018 to 2033
Figure 224: MEA Market Value Share (%) and BPS Analysis by Deployment, 2023 to 2033
Figure 225: MEA Market Y-o-Y Growth (%) Projections by Deployment, 2023 to 2033
Figure 226: MEA Market Value (US$ Million) Analysis by Enterprise Size, 2018 to 2033
Figure 227: MEA Market Value Share (%) and BPS Analysis by Enterprise Size, 2023 to 2033
Figure 228: MEA Market Y-o-Y Growth (%) Projections by Enterprise Size, 2023 to 2033
Figure 229: MEA Market Value (US$ Million) Analysis by Device Type, 2018 to 2033
Figure 230: MEA Market Value Share (%) and BPS Analysis by Device Type, 2023 to 2033
Figure 231: MEA Market Y-o-Y Growth (%) Projections by Device Type, 2023 to 2033
Figure 232: MEA Market Value (US$ Million) Analysis by Vertical, 2018 to 2033
Figure 233: MEA Market Value Share (%) and BPS Analysis by Vertical, 2023 to 2033
Figure 234: MEA Market Y-o-Y Growth (%) Projections by Vertical, 2023 to 2033
Figure 235: MEA Market Attractiveness by Component, 2023 to 2033
Figure 236: MEA Market Attractiveness by Deployment, 2023 to 2033
Figure 237: MEA Market Attractiveness by Enterprise Size, 2023 to 2033
Figure 238: MEA Market Attractiveness by Device Type, 2023 to 2033
Figure 239: MEA Market Attractiveness by Vertical, 2023 to 2033
Figure 240: MEA Market Attractiveness by Country, 2023 to 2033
The global demand for enterprise mobility management may generate USD 630,994 million revenue in 2023.
Adoption of enterprise mobility services is poised to witness 16.5% CAGR through 2033.
The solution segment had almost 62.3% of the total market share in 2022.
The country could retain its top position by following roughly 15% CAGR till 2033.
India is currently the most lucrative market that could exhibit 18.5% CAGR through 2033.
Explore Similar Insights
Thank you!
You will receive an email from our Business Development Manager. Please be sure to check your SPAM/JUNK folder too.