Reports
- Global Locations -
Headquarters
Future Market Insights, Inc.
Christiana Corporate, 200
Continental Drive, Suite 401,
Newark, Delaware - 19713,
United States
Americas
Future Market Insights, Inc.
616 Corporate Way, Suite 2-9018,
Valley Cottage, NY 10989, United States
MEA
Future Market Insights
1602-6 Jumeirah Bay X2 Tower, Plot No: JLT-PH2-X2A,
Jumeirah Lakes Towers, Dubai,
United Arab Emirates
Europe
Future Market Insights
3rd Floor, 207 Regent Street,
W1B 3HH London
United Kingdom
Asia Pacific
Future Market Insights
Office No. 401-A, 4th Floor,
VANTAGE 9, S.No. 36/1/1,
Baner, Pune 411045, India
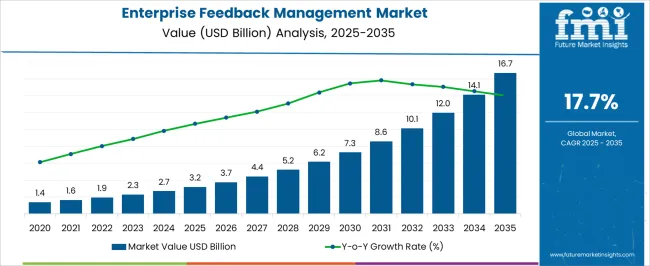
[306 Pages Report] The global enterprise feedback management market is expected to be valued at US$ 1,935 Million in 2022, and is projected to reach US$ 10,400 Million by 2032. A CAGR worth 18.3% is expected for the market during the 2022-2032 forecast period.
Enterprise feedback management software collects and maintains client input, combines data, generates results, and assists in gaining consumer insights into the goods or services given by various enterprises. Modern corporate feedback management comprises features such as the consolidation of business input from many channels and areas such as workers, partners, and social media, among others.
Many businesses utilize survey software to provide reports and insights that are essential for a successful customer relationship management (CRM) strategy. Many small and medium-sized firms utilize Enterprise Feedback Management systems to collect feedback from conversions, assess the information, and standardize customer care solutions.
Innovative enterprise feedback management technology solutions, such as real-time speech and text analytics capabilities, assist organizations in taking customer survey technologies and tools to the next level, allowing organizations to react to customer feedback easily and influence them at critical points of business.
These management solutions may assist incumbents in a variety of industries, including manufacturing and BFSI, in gaining useful insights from historical and present data, as well as forecasting market developments that may influence the clients' requirements. EDM solutions may help these firms by assuring information accuracy and risk control.
Report Attribute | Details |
---|---|
Expected Market Value (2022) | US$ 1,935 Million |
Projected Forecast Value (2032) | US$ 10,400 Million |
Anticipated Growth Rate (2022-2032) | 1 8.3% |
Don't pay for what you don't need
Customize your report by selecting specific countries or regions and save 30%!
The advent of social media and real-time consumer insights on smartphones and other electronic devices are driving forces in the business feedback management industry. As consumers are hesitant to provide private information to several suppliers, privacy concerns are limiting the growth of the corporate feedback management industry.
Acceptance of different channels and innovation, as well as shifting service goals, are boosting interest and adoption, which will provide chances for the enterprise feedback management market in the future years. As this software aids in the creation of a method for producing useful insights from unstructured or duplicated data, the rising need for customer input is projected to rise. It aids in data management amongst departments within a company. Demand for EDM solutions is expected to rise as organizations place a greater focus on ensuring timely and accurate information.
It benefits a variety of enterprises and organizations since it enables seamless interaction with consuming apps, data management, enhanced transparency, and assistance for continuing regulations and compliance. During the forecast period, these factors are projected to fuel the expansion of the worldwide corporate feedback management market.
In case of the feedback software, the entire software runs on the basis of the various feedbacks obtained from the customers. Now, there are some feedback sandwiches as well. This means a negative comment embedded between two positive comments. Such kind of feedbacks can be quite complicated and confusing.
These kinds of complicated feedbacks can lead on to defected algorithms which in turn can disrupt an entire set of feedbacks, with no effective data insight generated from it. Such kind of feedbacks can impede the overall growth of the enterprise feedback management market during the forecast period.
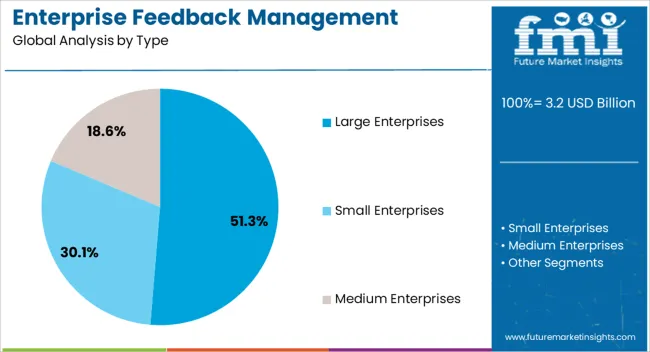
During the projected period of 2022-2032, the large segment is expected to grow steadily with a 5.6% CAGR during the forecast period. In 2022, the large enterprise sector is predicted to have the greatest market share of 67.5%. This might be linked to major enterprises' increasing desire for strong monitoring systems and automation abilities for resource allocation and strategic decision-making.
Large organizations' feedback processes and operations necessitate the use of high-tech tools such as process blueprints, advanced analytical engines, and real-time data gathering tools, which drives the use of business feedback solutions. Large organizations place a great emphasis on using effective data methodologies to categorize and anticipate potential dangers, and then using this feedback data to make faster business choices. These elements are expected to boost demand for business feedback management systems.
In terms of market share and revenue, the North American market is expected to be the dominant market for enterprise feedback management during the projection period of 2022-2032. The analysts at Future Market Insights predict that by 2022, the market of enterprise feedback management in North America is expected to acquire a global market size of 32.9%.
The increase can be attributed to the rising demand for feedback handling solutions as well as the increased demand for timely authentic information. Several corporations in the region, including Oracle, Amazon Web Service, and IBM, place a high value on digital transformation.
They are frequently regarded as early adopters of next-generation innovations like IoT, AI, big data analytics, and machine learning in order to acquire important insights from diverse feedback datasets. The region's firms' ongoing embrace of these cutting-edge technologies bodes well for the growth of the regional market. Such advances are expected to propel the market in North America during the forecast period.
Get the data you need at a Fraction of the cost
Personalize your report by choosing insights you need
and save 40%!
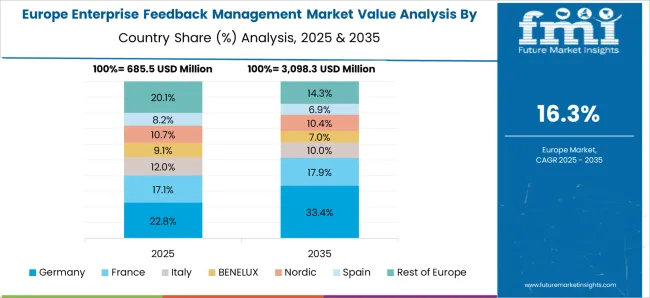
By 2022, Europe will hold approximately 23.6% of the global market share. This region is expected to be one of the fastest growing markets for the enterprise feedback management during the forecast period, 2022-2032.
The increased popularity of cloud computing, as well as the growing need to enhance operational efficiency in major organizations and SMEs, are likely to drive up demand for corporate feedback management.
Various governments in the area are pushing software businesses to create and build free and open-source software for remotely managing and accessing massive amounts of data, which is expected to drive demand for Enterprise feedback management solutions throughout the projected period.
The Asia Pacific region is expected to develop at a CAGR of 18.2% during the forecast period. The rising need for feedback data management solutions, as well as the increased need for timely authentic information, are driving the demand for enterprise feedback management solutions in the APAC region.
The government's emphasis on implementing big data tactics to foresee or uncover upcoming customer trends and detect possible dangers is projected to boost the expansion of enterprise feedback management throughout the area.
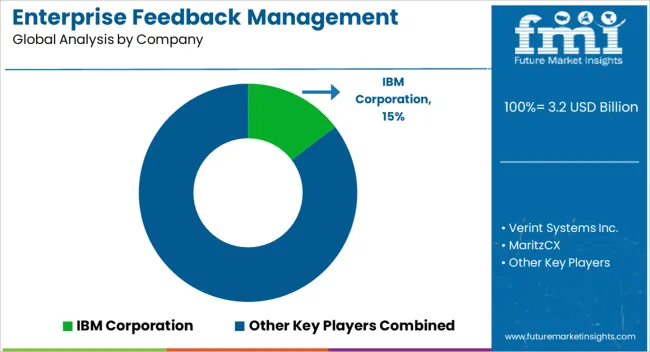
The key players of this market include IBM Corporation, Verint Systems Inc., MaritzCX, MirrorWave, Qualtrics, LLC, SIS International Research, Momentive, Ipsos SA, InMoment, Inc., Cvent, Inc., Confirmit, Inc., and Ambivista etc.
Report Attribute | Details |
---|---|
Growth Rate | CAGR of 18.3% from 2022 to 2032 |
Market value in 2022 | US$ 1,935 Million |
Market value in 2032 | US$ 10,400 Million |
Base Year for Estimation | 2021 |
Historical Data | 2016-2021 |
Forecast Period | 2022-2032 |
Quantitative Units | US$ Million for Value |
Report Coverage | Revenue Forecast, Volume Forecast, Company Ranking, Competitive Landscape, Growth Factors, Trends, and Pricing Analysis |
Segments Covered |
|
Regions Covered |
|
Key Countries Profiled |
|
Key Companies Profiled |
|
Customization Scope | Available on Request |
1. Executive Summary 1.1. Global Market Outlook 1.2. Demand-side Trends 1.3. Supply-side Trends 1.4. Technology Roadmap Analysis 1.5. Analysis and Recommendations 2. Market Overview 2.1. Market Coverage / Taxonomy 2.2. Market Definition / Scope / Limitations 3. Market Background 3.1. Market Dynamics 3.1.1. Drivers 3.1.2. Restraints 3.1.3. Opportunity 3.1.4. Trends 3.2. Scenario Forecast 3.2.1. Demand in Optimistic Scenario 3.2.2. Demand in Likely Scenario 3.2.3. Demand in Conservative Scenario 3.3. Opportunity Map Analysis 3.4. Investment Feasibility Matrix 3.5. PESTLE and Porter’s Analysis 3.6. Regulatory Landscape 3.6.1. By Key Regions 3.6.2. By Key Countries 3.7. Regional Parent Market Outlook 4. Global Enterprise Feedback Management Market Analysis 2016-2021 and Forecast, 2022-2032 4.1. Historical Market Size Value (US$ Mn) Analysis, 2016-2021 4.2. Current and Future Market Size Value (US$ Mn) Projections, 2022-2032 4.2.1. Y-o-Y Growth Trend Analysis 4.2.2. Absolute $ Opportunity Analysis 5. Global Enterprise Feedback Management Market Analysis 2016-2021 and Forecast 2022-2032, By Enterprise Type 5.1. Introduction / Key Findings 5.2. Historical Market Size Value (US$ Mn) Analysis By Enterprise Type, 2016-2021 5.3. Current and Future Market Size Value (US$ Mn) Analysis and Forecast By Enterprise Type, 2022-2032 5.3.1. Small 5.3.2. Medium 5.3.3. Large 5.4. Y-o-Y Growth Trend Analysis By Enterprise Type, 2016-2021 5.5. Absolute $ Opportunity Analysis By Enterprise Type, 2022-2032 6. Global Enterprise Feedback Management Market Analysis 2016-2021 and Forecast 2022-2032, By Touch Point 6.1. Introduction / Key Findings 6.2. Historical Market Size Value (US$ Mn) Analysis By Touch Point, 2016-2021 6.3. Current and Future Market Size Value (US$ Mn) Analysis and Forecast By Touch Point, 2022-2032 6.3.1. Company Website 6.3.2. Branch/Store 6.3.3. Web 6.3.4. Call Center 6.3.5. Social Media 6.4. Y-o-Y Growth Trend Analysis By Touch Point, 2016-2021 6.5. Absolute $ Opportunity Analysis By Touch Point, 2022-2032 7. Global Enterprise Feedback Management Market Analysis 2016-2021 and Forecast 2022-2032, By Verticals 7.1. Introduction / Key Findings 7.2. Historical Market Size Value (US$ Mn) Analysis By Verticals, 2016-2021 7.3. Current and Future Market Size Value (US$ Mn) Analysis and Forecast By Verticals, 2022-2032 7.3.1. Energy & Utilities 7.3.2. BFSI 7.3.3. Healthcare 7.3.4. Automotive 7.3.5. Transportation 7.3.6. Consumer Goods & Retail 7.3.7. Media & Entertainment 7.3.8. Hospitality 7.3.9. Manufacturing 7.4. Y-o-Y Growth Trend Analysis By Verticals, 2016-2021 7.5. Absolute $ Opportunity Analysis By Verticals, 2022-2032 8. Global Enterprise Feedback Management Market Analysis 2016-2021 and Forecast 2022-2032, By Region 8.1. Introduction 8.2. Historical Market Size Value (US$ Mn) Analysis By Region, 2016-2021 8.3. Current Market Size Value (US$ Mn) Analysis and Forecast By Region, 2022-2032 8.3.1. North America 8.3.2. Latin America 8.3.3. Europe 8.3.4. Asia Pacific 8.3.5. MEA 8.4. Market Attractiveness Analysis By Region 9. North America Enterprise Feedback Management Market Analysis 2016-2021 and Forecast 2022-2032, By Country 9.1. Historical Market Size Value (US$ Mn) Trend Analysis By Market Taxonomy, 2016-2021 9.2. Market Size Value (US$ Mn) Forecast By Market Taxonomy, 2022-2032 9.2.1. By Country 9.2.1.1. U.S. 9.2.1.2. Canada 9.2.2. By Enterprise Type 9.2.3. By Touch Point 9.2.4. By Verticals 9.3. Market Attractiveness Analysis 9.3.1. By Country 9.3.2. By Enterprise Type 9.3.3. By Touch Point 9.3.4. By Verticals 9.4. Key Takeaways 10. Latin America Enterprise Feedback Management Market Analysis 2016-2021 and Forecast 2022-2032, By Country 10.1. Historical Market Size Value (US$ Mn) Trend Analysis By Market Taxonomy, 2016-2021 10.2. Market Size Value (US$ Mn) Forecast By Market Taxonomy, 2022-2032 10.2.1. By Country 10.2.1.1. Brazil 10.2.1.2. Mexico 10.2.1.3. Rest of Latin America 10.2.2. By Enterprise Type 10.2.3. By Touch Point 10.2.4. By Verticals 10.3. Market Attractiveness Analysis 10.3.1. By Country 10.3.2. By Enterprise Type 10.3.3. By Touch Point 10.3.4. By Verticals 10.4. Key Takeaways 11. Europe Enterprise Feedback Management Market Analysis 2016-2021 and Forecast 2022-2032, By Country 11.1. Historical Market Size Value (US$ Mn) Trend Analysis By Market Taxonomy, 2016-2021 11.2. Market Size Value (US$ Mn) Forecast By Market Taxonomy, 2022-2032 11.2.1. By Country 11.2.1.1. Germany 11.2.1.2. U.K. 11.2.1.3. France 11.2.1.4. Spain 11.2.1.5. Italy 11.2.1.6. Rest of Europe 11.2.2. By Enterprise Type 11.2.3. By Touch Point 11.2.4. By Verticals 11.3. Market Attractiveness Analysis 11.3.1. By Country 11.3.2. By Enterprise Type 11.3.3. By Touch Point 11.3.4. By Verticals 11.4. Key Takeaways 12. Asia Pacific Enterprise Feedback Management Market Analysis 2016-2021 and Forecast 2022-2032, By Country 12.1. Historical Market Size Value (US$ Mn) Trend Analysis By Market Taxonomy, 2016-2021 12.2. Market Size Value (US$ Mn) Forecast By Market Taxonomy, 2022-2032 12.2.1. By Country 12.2.1.1. China 12.2.1.2. Japan 12.2.1.3. South Korea 12.2.1.4. Malaysia 12.2.1.5. Singapore 12.2.1.6. Australia 12.2.1.7. Rest of Asia Pacific 12.2.2. By Enterprise Type 12.2.3. By Touch Point 12.2.4. By Verticals 12.3. Market Attractiveness Analysis 12.3.1. By Country 12.3.2. By Enterprise Type 12.3.3. By Touch Point 12.3.4. By Verticals 12.4. Key Takeaways 13. MEA Enterprise Feedback Management Market Analysis 2016-2021 and Forecast 2022-2032, By Country 13.1. Historical Market Size Value (US$ Mn) Trend Analysis By Market Taxonomy, 2016-2021 13.2. Market Size Value (US$ Mn) Forecast By Market Taxonomy, 2022-2032 13.2.1. By Country 13.2.1.1. GCC Countries 13.2.1.2. South Africa 13.2.1.3. Israel 13.2.1.4. Rest of MEA 13.2.2. By Enterprise Type 13.2.3. By Touch Point 13.2.4. By Verticals 13.3. Market Attractiveness Analysis 13.3.1. By Country 13.3.2. By Enterprise Type 13.3.3. By Touch Point 13.3.4. By Verticals 13.4. Key Takeaways 14. Key Countries Enterprise Feedback Management Market Analysis 14.1. U.K. 14.1.1. Pricing Analysis 14.1.2. Market Share Analysis, 2021 14.1.2.1. By Enterprise Type 14.1.2.2. By Touch Point 14.1.2.3. By Verticals 14.2. Canada 14.2.1. Pricing Analysis 14.2.2. Market Share Analysis, 2021 14.2.2.1. By Enterprise Type 14.2.2.2. By Touch Point 14.2.2.3. By Verticals 14.3. Brazil 14.3.1. Pricing Analysis 14.3.2. Market Share Analysis, 2021 14.3.2.1. By Enterprise Type 14.3.2.2. By Touch Point 14.3.2.3. By Verticals 14.4. Mexico 14.4.1. Pricing Analysis 14.4.2. Market Share Analysis, 2021 14.4.2.1. By Enterprise Type 14.4.2.2. By Touch Point 14.4.2.3. By Verticals 14.5. Rest of Latin America 14.5.1. Pricing Analysis 14.5.2. Market Share Analysis, 2021 14.5.2.1. By Enterprise Type 14.5.2.2. By Touch Point 14.5.2.3. By Verticals 14.6. Germany 14.6.1. Pricing Analysis 14.6.2. Market Share Analysis, 2021 14.6.2.1. By Enterprise Type 14.6.2.2. By Touch Point 14.6.2.3. By Verticals 14.7. U.K. 14.7.1. Pricing Analysis 14.7.2. Market Share Analysis, 2021 14.7.2.1. By Enterprise Type 14.7.2.2. By Touch Point 14.7.2.3. By Verticals 14.8. France 14.8.1. Pricing Analysis 14.8.2. Market Share Analysis, 2021 14.8.2.1. By Enterprise Type 14.8.2.2. By Touch Point 14.8.2.3. By Verticals 14.9. Spain 14.9.1. Pricing Analysis 14.9.2. Market Share Analysis, 2021 14.9.2.1. By Enterprise Type 14.9.2.2. By Touch Point 14.9.2.3. By Verticals 14.10. Italy 14.10.1. Pricing Analysis 14.10.2. Market Share Analysis, 2021 14.10.2.1. By Enterprise Type 14.10.2.2. By Touch Point 14.10.2.3. By Verticals 14.11. Rest of Europe 14.11.1. Pricing Analysis 14.11.2. Market Share Analysis, 2021 14.11.2.1. By Enterprise Type 14.11.2.2. By Touch Point 14.11.2.3. By Verticals 14.12. China 14.12.1. Pricing Analysis 14.12.2. Market Share Analysis, 2021 14.12.2.1. By Enterprise Type 14.12.2.2. By Touch Point 14.12.2.3. By Verticals 14.13. Japan 14.13.1. Pricing Analysis 14.13.2. Market Share Analysis, 2021 14.13.2.1. By Enterprise Type 14.13.2.2. By Touch Point 14.13.2.3. By Verticals 14.14. South Korea 14.14.1. Pricing Analysis 14.14.2. Market Share Analysis, 2021 14.14.2.1. By Enterprise Type 14.14.2.2. By Touch Point 14.14.2.3. By Verticals 14.15. Malaysia 14.15.1. Pricing Analysis 14.15.2. Market Share Analysis, 2021 14.15.2.1. By Enterprise Type 14.15.2.2. By Touch Point 14.15.2.3. By Verticals 14.16. Singapore 14.16.1. Pricing Analysis 14.16.2. Market Share Analysis, 2021 14.16.2.1. By Enterprise Type 14.16.2.2. By Touch Point 14.16.2.3. By Verticals 14.17. Australia 14.17.1. Pricing Analysis 14.17.2. Market Share Analysis, 2021 14.17.2.1. By Enterprise Type 14.17.2.2. By Touch Point 14.17.2.3. By Verticals 14.18. Rest of Asia Pacific 14.18.1. Pricing Analysis 14.18.2. Market Share Analysis, 2021 14.18.2.1. By Enterprise Type 14.18.2.2. By Touch Point 14.18.2.3. By Verticals 14.19. GCC Countries 14.19.1. Pricing Analysis 14.19.2. Market Share Analysis, 2021 14.19.2.1. By Enterprise Type 14.19.2.2. By Touch Point 14.19.2.3. By Verticals 14.20. South Africa 14.20.1. Pricing Analysis 14.20.2. Market Share Analysis, 2021 14.20.2.1. By Enterprise Type 14.20.2.2. By Touch Point 14.20.2.3. By Verticals 14.21. Israel 14.21.1. Pricing Analysis 14.21.2. Market Share Analysis, 2021 14.21.2.1. By Enterprise Type 14.21.2.2. By Touch Point 14.21.2.3. By Verticals 14.22. Rest of MEA 14.22.1. Pricing Analysis 14.22.2. Market Share Analysis, 2021 14.22.2.1. By Enterprise Type 14.22.2.2. By Touch Point 14.22.2.3. By Verticals 15. Market Structure Analysis 15.1. Competition Dashboard 15.2. Competition Benchmarking 15.3. Market Share Analysis of Top Players 15.3.1. By Regional 15.3.2. By Enterprise Type 15.3.3. By Touch Point 15.3.4. By Verticals 16. Competition Analysis 16.1. Competition Deep Dive 16.1.1. IBM Corporation 16.1.1.1. Overview 16.1.1.2. Product Portfolio 16.1.1.3. Profitability by Market Segments 16.1.1.4. Sales Footprint 16.1.1.5. Strategy Overview 16.1.1.5.1. Marketing Strategy 16.1.2. Verint Systems Inc. 16.1.2.1. Overview 16.1.2.2. Product Portfolio 16.1.2.3. Profitability by Market Segments 16.1.2.4. Sales Footprint 16.1.2.5. Strategy Overview 16.1.2.5.1. Marketing Strategy 16.1.3. MaritzCX 16.1.3.1. Overview 16.1.3.2. Product Portfolio 16.1.3.3. Profitability by Market Segments 16.1.3.4. Sales Footprint 16.1.3.5. Strategy Overview 16.1.3.5.1. Marketing Strategy 16.1.4. MirrorWave 16.1.4.1. Overview 16.1.4.2. Product Portfolio 16.1.4.3. Profitability by Market Segments 16.1.4.4. Sales Footprint 16.1.4.5. Strategy Overview 16.1.4.5.1. Marketing Strategy 16.1.5. Qualtrics, LLC 16.1.5.1. Overview 16.1.5.2. Product Portfolio 16.1.5.3. Profitability by Market Segments 16.1.5.4. Sales Footprint 16.1.5.5. Strategy Overview 16.1.5.5.1. Marketing Strategy 16.1.6. Ipsos SA 16.1.6.1. Overview 16.1.6.2. Product Portfolio 16.1.6.3. Profitability by Market Segments 16.1.6.4. Sales Footprint 16.1.6.5. Strategy Overview 16.1.6.5.1. Marketing Strategy 16.1.7. InMoment, Inc. 16.1.7.1. Overview 16.1.7.2. Product Portfolio 16.1.7.3. Profitability by Market Segments 16.1.7.4. Sales Footprint 16.1.7.5. Strategy Overview 16.1.7.5.1. Marketing Strategy 16.1.8. Cvent, Inc. 16.1.8.1. Overview 16.1.8.2. Product Portfolio 16.1.8.3. Profitability by Market Segments 16.1.8.4. Sales Footprint 16.1.8.5. Strategy Overview 16.1.8.5.1. Marketing Strategy 16.1.9. Confirmit, Inc. 16.1.9.1. Overview 16.1.9.2. Product Portfolio 16.1.9.3. Profitability by Market Segments 16.1.9.4. Sales Footprint 16.1.9.5. Strategy Overview 16.1.9.5.1. Marketing Strategy 16.1.10. Ambivista etc 16.1.10.1. Overview 16.1.10.2. Product Portfolio 16.1.10.3. Profitability by Market Segments 16.1.10.4. Sales Footprint 16.1.10.5. Strategy Overview 16.1.10.5.1. Marketing Strategy 17. Assumptions & Acronyms Used 18. Research Methodology
Don't pay for what you don't need
Customize your report by selecting specific countries or regions and save 30%!
Table 1: Global Enterprise Feedback Management Market Value (US$ Mn) Forecast by Region, 2016-2032 Table 2: Global Enterprise Feedback Management Market Value (US$ Mn) Forecast by Enterprise Type, 2016-2032 Table 3: Global Enterprise Feedback Management Market Value (US$ Mn) Forecast by Touch Point, 2016-2032 Table 4: Global Enterprise Feedback Management Market Value (US$ Mn) Forecast by Verticals, 2016-2032 Table 5: North America Enterprise Feedback Management Market Value (US$ Mn) Forecast by Country, 2016-2032 Table 6: North America Enterprise Feedback Management Market Value (US$ Mn) Forecast by Enterprise Type, 2016-2032 Table 7: North America Enterprise Feedback Management Market Value (US$ Mn) Forecast by Touch Point, 2016-2032 Table 8: North America Enterprise Feedback Management Market Value (US$ Mn) Forecast by Verticals, 2016-2032 Table 9: Latin America Enterprise Feedback Management Market Value (US$ Mn) Forecast by Country, 2016-2032 Table 10: Latin America Enterprise Feedback Management Market Value (US$ Mn) Forecast by Enterprise Type, 2016-2032 Table 11: Latin America Enterprise Feedback Management Market Value (US$ Mn) Forecast by Touch Point, 2016-2032 Table 12: Latin America Enterprise Feedback Management Market Value (US$ Mn) Forecast by Verticals, 2016-2032 Table 13: Europe Enterprise Feedback Management Market Value (US$ Mn) Forecast by Country, 2016-2032 Table 14: Europe Enterprise Feedback Management Market Value (US$ Mn) Forecast by Enterprise Type, 2016-2032 Table 15: Europe Enterprise Feedback Management Market Value (US$ Mn) Forecast by Touch Point, 2016-2032 Table 16: Europe Enterprise Feedback Management Market Value (US$ Mn) Forecast by Verticals, 2016-2032 Table 17: Asia Pacific Enterprise Feedback Management Market Value (US$ Mn) Forecast by Country, 2016-2032 Table 18: Asia Pacific Enterprise Feedback Management Market Value (US$ Mn) Forecast by Enterprise Type, 2016-2032 Table 19: Asia Pacific Enterprise Feedback Management Market Value (US$ Mn) Forecast by Touch Point, 2016-2032 Table 20: Asia Pacific Enterprise Feedback Management Market Value (US$ Mn) Forecast by Verticals, 2016-2032 Table 21: MEA Enterprise Feedback Management Market Value (US$ Mn) Forecast by Country, 2016-2032 Table 22: MEA Enterprise Feedback Management Market Value (US$ Mn) Forecast by Enterprise Type, 2016-2032 Table 23: MEA Enterprise Feedback Management Market Value (US$ Mn) Forecast by Touch Point, 2016-2032 Table 24: MEA Enterprise Feedback Management Market Value (US$ Mn) Forecast by Verticals, 2016-2032
Figure 1: Global Enterprise Feedback Management Market Value (US$ Mn) by Enterprise Type, 2022-2032 Figure 2: Global Enterprise Feedback Management Market Value (US$ Mn) by Touch Point, 2022-2032 Figure 3: Global Enterprise Feedback Management Market Value (US$ Mn) by Verticals, 2022-2032 Figure 4: Global Enterprise Feedback Management Market Value (US$ Mn) by Region, 2022-2032 Figure 5: Global Enterprise Feedback Management Market Value (US$ Mn) Analysis by Region, 2016-2032 Figure 6: Global Enterprise Feedback Management Market Value Share (%) and BPS Analysis by Region, 2022-2032 Figure 7: Global Enterprise Feedback Management Market Y-o-Y Growth (%) Projections by Region, 2022-2032 Figure 8: Global Enterprise Feedback Management Market Value (US$ Mn) Analysis by Enterprise Type, 2016-2032 Figure 9: Global Enterprise Feedback Management Market Value Share (%) and BPS Analysis by Enterprise Type, 2022-2032 Figure 10: Global Enterprise Feedback Management Market Y-o-Y Growth (%) Projections by Enterprise Type, 2022-2032 Figure 11: Global Enterprise Feedback Management Market Value (US$ Mn) Analysis by Touch Point, 2016-2032 Figure 12: Global Enterprise Feedback Management Market Value Share (%) and BPS Analysis by Touch Point, 2022-2032 Figure 13: Global Enterprise Feedback Management Market Y-o-Y Growth (%) Projections by Touch Point, 2022-2032 Figure 14: Global Enterprise Feedback Management Market Value (US$ Mn) Analysis by Verticals, 2016-2032 Figure 15: Global Enterprise Feedback Management Market Value Share (%) and BPS Analysis by Verticals, 2022-2032 Figure 16: Global Enterprise Feedback Management Market Y-o-Y Growth (%) Projections by Verticals, 2022-2032 Figure 17: Global Enterprise Feedback Management Market Attractiveness by Enterprise Type, 2022-2032 Figure 18: Global Enterprise Feedback Management Market Attractiveness by Touch Point, 2022-2032 Figure 19: Global Enterprise Feedback Management Market Attractiveness by Verticals, 2022-2032 Figure 20: Global Enterprise Feedback Management Market Attractiveness by Region, 2022-2032 Figure 21: North America Enterprise Feedback Management Market Value (US$ Mn) by Enterprise Type, 2022-2032 Figure 22: North America Enterprise Feedback Management Market Value (US$ Mn) by Touch Point, 2022-2032 Figure 23: North America Enterprise Feedback Management Market Value (US$ Mn) by Verticals, 2022-2032 Figure 24: North America Enterprise Feedback Management Market Value (US$ Mn) by Country, 2022-2032 Figure 25: North America Enterprise Feedback Management Market Value (US$ Mn) Analysis by Country, 2016-2032 Figure 26: North America Enterprise Feedback Management Market Value Share (%) and BPS Analysis by Country, 2022-2032 Figure 27: North America Enterprise Feedback Management Market Y-o-Y Growth (%) Projections by Country, 2022-2032 Figure 28: North America Enterprise Feedback Management Market Value (US$ Mn) Analysis by Enterprise Type, 2016-2032 Figure 29: North America Enterprise Feedback Management Market Value Share (%) and BPS Analysis by Enterprise Type, 2022-2032 Figure 30: North America Enterprise Feedback Management Market Y-o-Y Growth (%) Projections by Enterprise Type, 2022-2032 Figure 31: North America Enterprise Feedback Management Market Value (US$ Mn) Analysis by Touch Point, 2016-2032 Figure 32: North America Enterprise Feedback Management Market Value Share (%) and BPS Analysis by Touch Point, 2022-2032 Figure 33: North America Enterprise Feedback Management Market Y-o-Y Growth (%) Projections by Touch Point, 2022-2032 Figure 34: North America Enterprise Feedback Management Market Value (US$ Mn) Analysis by Verticals, 2016-2032 Figure 35: North America Enterprise Feedback Management Market Value Share (%) and BPS Analysis by Verticals, 2022-2032 Figure 36: North America Enterprise Feedback Management Market Y-o-Y Growth (%) Projections by Verticals, 2022-2032 Figure 37: North America Enterprise Feedback Management Market Attractiveness by Enterprise Type, 2022-2032 Figure 38: North America Enterprise Feedback Management Market Attractiveness by Touch Point, 2022-2032 Figure 39: North America Enterprise Feedback Management Market Attractiveness by Verticals, 2022-2032 Figure 40: North America Enterprise Feedback Management Market Attractiveness by Country, 2022-2032 Figure 41: Latin America Enterprise Feedback Management Market Value (US$ Mn) by Enterprise Type, 2022-2032 Figure 42: Latin America Enterprise Feedback Management Market Value (US$ Mn) by Touch Point, 2022-2032 Figure 43: Latin America Enterprise Feedback Management Market Value (US$ Mn) by Verticals, 2022-2032 Figure 44: Latin America Enterprise Feedback Management Market Value (US$ Mn) by Country, 2022-2032 Figure 45: Latin America Enterprise Feedback Management Market Value (US$ Mn) Analysis by Country, 2016-2032 Figure 46: Latin America Enterprise Feedback Management Market Value Share (%) and BPS Analysis by Country, 2022-2032 Figure 47: Latin America Enterprise Feedback Management Market Y-o-Y Growth (%) Projections by Country, 2022-2032 Figure 48: Latin America Enterprise Feedback Management Market Value (US$ Mn) Analysis by Enterprise Type, 2016-2032 Figure 49: Latin America Enterprise Feedback Management Market Value Share (%) and BPS Analysis by Enterprise Type, 2022-2032 Figure 50: Latin America Enterprise Feedback Management Market Y-o-Y Growth (%) Projections by Enterprise Type, 2022-2032 Figure 51: Latin America Enterprise Feedback Management Market Value (US$ Mn) Analysis by Touch Point, 2016-2032 Figure 52: Latin America Enterprise Feedback Management Market Value Share (%) and BPS Analysis by Touch Point, 2022-2032 Figure 53: Latin America Enterprise Feedback Management Market Y-o-Y Growth (%) Projections by Touch Point, 2022-2032 Figure 54: Latin America Enterprise Feedback Management Market Value (US$ Mn) Analysis by Verticals, 2016-2032 Figure 55: Latin America Enterprise Feedback Management Market Value Share (%) and BPS Analysis by Verticals, 2022-2032 Figure 56: Latin America Enterprise Feedback Management Market Y-o-Y Growth (%) Projections by Verticals, 2022-2032 Figure 57: Latin America Enterprise Feedback Management Market Attractiveness by Enterprise Type, 2022-2032 Figure 58: Latin America Enterprise Feedback Management Market Attractiveness by Touch Point, 2022-2032 Figure 59: Latin America Enterprise Feedback Management Market Attractiveness by Verticals, 2022-2032 Figure 60: Latin America Enterprise Feedback Management Market Attractiveness by Country, 2022-2032 Figure 61: Europe Enterprise Feedback Management Market Value (US$ Mn) by Enterprise Type, 2022-2032 Figure 62: Europe Enterprise Feedback Management Market Value (US$ Mn) by Touch Point, 2022-2032 Figure 63: Europe Enterprise Feedback Management Market Value (US$ Mn) by Verticals, 2022-2032 Figure 64: Europe Enterprise Feedback Management Market Value (US$ Mn) by Country, 2022-2032 Figure 65: Europe Enterprise Feedback Management Market Value (US$ Mn) Analysis by Country, 2016-2032 Figure 66: Europe Enterprise Feedback Management Market Value Share (%) and BPS Analysis by Country, 2022-2032 Figure 67: Europe Enterprise Feedback Management Market Y-o-Y Growth (%) Projections by Country, 2022-2032 Figure 68: Europe Enterprise Feedback Management Market Value (US$ Mn) Analysis by Enterprise Type, 2016-2032 Figure 69: Europe Enterprise Feedback Management Market Value Share (%) and BPS Analysis by Enterprise Type, 2022-2032 Figure 70: Europe Enterprise Feedback Management Market Y-o-Y Growth (%) Projections by Enterprise Type, 2022-2032 Figure 71: Europe Enterprise Feedback Management Market Value (US$ Mn) Analysis by Touch Point, 2016-2032 Figure 72: Europe Enterprise Feedback Management Market Value Share (%) and BPS Analysis by Touch Point, 2022-2032 Figure 73: Europe Enterprise Feedback Management Market Y-o-Y Growth (%) Projections by Touch Point, 2022-2032 Figure 74: Europe Enterprise Feedback Management Market Value (US$ Mn) Analysis by Verticals, 2016-2032 Figure 75: Europe Enterprise Feedback Management Market Value Share (%) and BPS Analysis by Verticals, 2022-2032 Figure 76: Europe Enterprise Feedback Management Market Y-o-Y Growth (%) Projections by Verticals, 2022-2032 Figure 77: Europe Enterprise Feedback Management Market Attractiveness by Enterprise Type, 2022-2032 Figure 78: Europe Enterprise Feedback Management Market Attractiveness by Touch Point, 2022-2032 Figure 79: Europe Enterprise Feedback Management Market Attractiveness by Verticals, 2022-2032 Figure 80: Europe Enterprise Feedback Management Market Attractiveness by Country, 2022-2032 Figure 81: Asia Pacific Enterprise Feedback Management Market Value (US$ Mn) by Enterprise Type, 2022-2032 Figure 82: Asia Pacific Enterprise Feedback Management Market Value (US$ Mn) by Touch Point, 2022-2032 Figure 83: Asia Pacific Enterprise Feedback Management Market Value (US$ Mn) by Verticals, 2022-2032 Figure 84: Asia Pacific Enterprise Feedback Management Market Value (US$ Mn) by Country, 2022-2032 Figure 85: Asia Pacific Enterprise Feedback Management Market Value (US$ Mn) Analysis by Country, 2016-2032 Figure 86: Asia Pacific Enterprise Feedback Management Market Value Share (%) and BPS Analysis by Country, 2022-2032 Figure 87: Asia Pacific Enterprise Feedback Management Market Y-o-Y Growth (%) Projections by Country, 2022-2032 Figure 88: Asia Pacific Enterprise Feedback Management Market Value (US$ Mn) Analysis by Enterprise Type, 2016-2032 Figure 89: Asia Pacific Enterprise Feedback Management Market Value Share (%) and BPS Analysis by Enterprise Type, 2022-2032 Figure 90: Asia Pacific Enterprise Feedback Management Market Y-o-Y Growth (%) Projections by Enterprise Type, 2022-2032 Figure 91: Asia Pacific Enterprise Feedback Management Market Value (US$ Mn) Analysis by Touch Point, 2016-2032 Figure 92: Asia Pacific Enterprise Feedback Management Market Value Share (%) and BPS Analysis by Touch Point, 2022-2032 Figure 93: Asia Pacific Enterprise Feedback Management Market Y-o-Y Growth (%) Projections by Touch Point, 2022-2032 Figure 94: Asia Pacific Enterprise Feedback Management Market Value (US$ Mn) Analysis by Verticals, 2016-2032 Figure 95: Asia Pacific Enterprise Feedback Management Market Value Share (%) and BPS Analysis by Verticals, 2022-2032 Figure 96: Asia Pacific Enterprise Feedback Management Market Y-o-Y Growth (%) Projections by Verticals, 2022-2032 Figure 97: Asia Pacific Enterprise Feedback Management Market Attractiveness by Enterprise Type, 2022-2032 Figure 98: Asia Pacific Enterprise Feedback Management Market Attractiveness by Touch Point, 2022-2032 Figure 99: Asia Pacific Enterprise Feedback Management Market Attractiveness by Verticals, 2022-2032 Figure 100: Asia Pacific Enterprise Feedback Management Market Attractiveness by Country, 2022-2032 Figure 101: MEA Enterprise Feedback Management Market Value (US$ Mn) by Enterprise Type, 2022-2032 Figure 102: MEA Enterprise Feedback Management Market Value (US$ Mn) by Touch Point, 2022-2032 Figure 103: MEA Enterprise Feedback Management Market Value (US$ Mn) by Verticals, 2022-2032 Figure 104: MEA Enterprise Feedback Management Market Value (US$ Mn) by Country, 2022-2032 Figure 105: MEA Enterprise Feedback Management Market Value (US$ Mn) Analysis by Country, 2016-2032 Figure 106: MEA Enterprise Feedback Management Market Value Share (%) and BPS Analysis by Country, 2022-2032 Figure 107: MEA Enterprise Feedback Management Market Y-o-Y Growth (%) Projections by Country, 2022-2032 Figure 108: MEA Enterprise Feedback Management Market Value (US$ Mn) Analysis by Enterprise Type, 2016-2032 Figure 109: MEA Enterprise Feedback Management Market Value Share (%) and BPS Analysis by Enterprise Type, 2022-2032 Figure 110: MEA Enterprise Feedback Management Market Y-o-Y Growth (%) Projections by Enterprise Type, 2022-2032 Figure 111: MEA Enterprise Feedback Management Market Value (US$ Mn) Analysis by Touch Point, 2016-2032 Figure 112: MEA Enterprise Feedback Management Market Value Share (%) and BPS Analysis by Touch Point, 2022-2032 Figure 113: MEA Enterprise Feedback Management Market Y-o-Y Growth (%) Projections by Touch Point, 2022-2032 Figure 114: MEA Enterprise Feedback Management Market Value (US$ Mn) Analysis by Verticals, 2016-2032 Figure 115: MEA Enterprise Feedback Management Market Value Share (%) and BPS Analysis by Verticals, 2022-2032 Figure 116: MEA Enterprise Feedback Management Market Y-o-Y Growth (%) Projections by Verticals, 2022-2032 Figure 117: MEA Enterprise Feedback Management Market Attractiveness by Enterprise Type, 2022-2032 Figure 118: MEA Enterprise Feedback Management Market Attractiveness by Touch Point, 2022-2032 Figure 119: MEA Enterprise Feedback Management Market Attractiveness by Verticals, 2022-2032 Figure 120: MEA Enterprise Feedback Management Market Attractiveness by Country, 2022-2032
Recommendations
Explore Technology Insights
View Reports