Reports

- Global Locations -

Headquarters

Future Market Insights, Inc.

Christiana Corporate, 200
Continental Drive, Suite 401,
Newark, Delaware - 19713,
United States

T: +1-845-579-5705

Americas

Future Market Insights, Inc.

616 Corporate Way, Suite 2-9018,
Valley Cottage, NY 10989, United States

T: +1-347-918-3531

MEA

Future Market Insights

1602-6 Jumeirah Bay X2 Tower, Plot No: JLT-PH2-X2A,
Jumeirah Lakes Towers, Dubai,
United Arab Emirates

Europe

Future Market Insights

3rd Floor, 207 Regent Street,
W1B 3HH London
United Kingdom

T: + 44 (0) 20 8123 9659
D: +44 (0) 20 3287 4268

Asia Pacific

Future Market Insights

IndiaLand Global Tech Park, Unit UG-1, Behind Grand HighStreet, Phase 1, Hinjawadi, MH, Pune – 411057, India

Enterprise Video Market Overview (2022 to 2032)

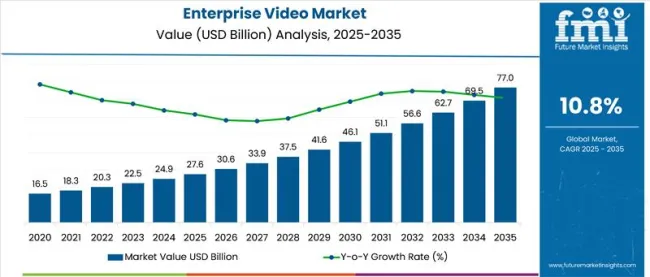
[306 Pages Report] According to Future Market Insights research, the global enterprise video market is likely to be worth US$ 21.23 Billion in 2022 and is expected to grow at a 13.8% CAGR from 2022 to 2032 and reach US$ 77.32 Billion by 2032. This growth can be attributed to the following factors:

  • The need to increase operational effectiveness and worker productivity
  • The desire to connect remote workers with the expanding global internet user population
  • The explosion in the utilization of enterprise video market technologies, and even marketing techniques

The enterprise video market has been growing as the demand for enterprise video market of enterprise collaboration and communication grows. The pandemic has also hampered business efficiency and employee productivity around the world for enterprise video market key trends and opportunities.

The adoption of enterprise video solutions and services has significantly accelerated the pandemic, positively impacting enterprise video market growth.

Attributes Details
Enterprise Video Market CAGR (2022 to 2032) 13.8%
Enterprise Video Market Size (2022) USD 21.23 billion
Enterprise Video Market Size (2032) US$ 77.32 billion

Don't pay for what you don't need

Customize your report by selecting specific countries or regions and save 30%!

Increased Usage of Various Kinds of Video Streaming and Advancements in Operations

The increased supply of on-demand video streaming for development and learning training throughout various companies is accelerating the market's growth even further. Employees may access in-depth knowledge that has already been recorded by colleagues, trainers, and executives thanks to the on-demand films. Additionally, a lot of companies use corporate video platforms to carry out external tasks including marketing, sales, educating clients and partners, and streaming public events.

Many educational institutions are also utilizing multimedia presentations and films more frequently to enhance learning through visual records of webinars and lectures. The adoption of video material for educational purposes has been encouraged by the rising adoption of smartphones and the accessibility of high-speed internet.

The rise of the industry is greatly aided by the continuous technological developments in video streaming, including the introduction of Application Programming Interfaces (APIs). Through the use of APIs, businesses may now merge several technical platforms to provide customers with an omnichannel experience. Additionally, APIs aid in the creation of apps for on-demand video content, thereby further boosting the market's expansion.

The Video Content Management Sector is pushing Demand

Since these solutions assist organizations in efficiently managing their video as well as other multimedia material, the video content management market is anticipated to grow at a CAGR of 14% during the projected period. In the upcoming years, the segment expansion is anticipated to be fueled by the increasing trend toward cloud-based content management across various industries.

To successfully satisfy client requests, several businesses involved with the creation of video content management software are now working together to create novel content management services. For instance, 2022, Brightcove Inc. bought Wicket Labs in February 2022. Wicket Labs, a well-known provider of audience insights, lets users make decisions using the information to enhance subscriber acquisition, conversions, engagement, and retention.

Sudip Saha
Sudip Saha

Principal Consultant

Talk to Analyst

Find your sweet spots for generating winning opportunities in this market.

North America and APAC to gain a Prominent Share of the Market

Due to the presence of significant market players like IBM, Adobe, Cisco Systems, Inc., and Microsoft in the area, the North American market contributed to a revenue share of over 44% in 2021. The availability of high-speed internet and the expanding demand for virtual meetings have opened up significant commercial potential in the USA. In addition, it is anticipated that in the future regional revenue growth would be fueled by the growing demands for virtual private networks (VPN) among several enterprises and academic institutions.

With rising media consumption in the area, the market in the Asia-Pacific region Pacific is anticipated to grow at a CAGR of 16% over the forecast period. The market is benefiting from the development of network infrastructures and the presence of numerous small and medium-sized enterprises in China and India. Additionally, the market participants have plenty of prospects because of the rising popularity of online learning and remote education in countries like China, Australia, Japan, India, and Singapore.

What Is Propelling The Enterprise Video Market?

The increased adoption of enterprise video solutions across organizations to improve collaboration among their global workforces is primarily responsible for the enterprise video market growth. Enterprise video has become an essential component of many companies' content marketing strategies.

Several enterprise video market companies are now focusing on developing Content Delivery Networks (CDNs) that accelerate the delivery of multimedia internet content and provide enterprises with improved video streaming capabilities, therefore, surging the enterprise video market future trends.

Several educational institutions are also increasingly using videos and multimedia presentations to improve learning experiences through visual recordings of webinars and courses which surges the enterprise video market key trends and opportunities.

Increased smartphone penetration and high-speed internet availability have boosted the use of video content for educational purposes thereby escalating the enterprise video market adoption trends.

Continuous technological advancements in video streaming, such as the introduction of APIs, are significantly favouring enterprise video market growth. APIs have enabled organizations to combine multiple technological platforms, providing their customers with an Omni channel experience.

APIs also aid in the development of apps for on-demand video content, which is propelling the enterprise video market opportunities and accelerating enterprise video market future trends.

The COVID-19 pandemic has benefited the enterprise video market by increasing demand for enterprise collaboration software, as several companies implemented remote working models during the pandemic. The growing popularity of remote working has resulted in a surge in demand for enterprise video as well as video conferencing and content management.

This prompted major technology companies such as Zoom Video Communications, Inc., and others to create video conferencing solutions in order to meet the growing demand for enterprise video as well as team collaboration tools.

Get the data you need at a Fraction of the cost

Personalize your report by choosing insights you need
and save 40%!

What Restrains The Enterprise Video Market?

Despite the fact that the majority of developed countries have highly developed communication infrastructure, some developing and underdeveloped countries lack essential communication infrastructure to support high-quality video communication which positively influences the enterprise video market future trends.

People in these countries rely more on audio-based communication to avoid the frustrations of poor video quality and intermittent disconnections which escalate their demand for enterprise video along with sales of enterprise video.

When compared to video communications, audio-based communication requires significantly less bandwidth and can be operated on significantly lower capacity communication infrastructure impacting the enterprise video market adoption trends. The absence of a robust communication infrastructure poses a significant barrier to the enterprise video market growth.

What Are The Trends In The Enterprise Video Market?

In recent years, many organizations have implemented Bring Your Own Device (BYOD) and Carry Your Own Device (CYOD) policies. These enterprise video solutions enable employees to interact with corporate data from remote locations.

As BYOD and CYOD policies, as well as enterprise video solutions, give employees more flexibility, they are complementary. Since many organizations have implemented BYOD and CYOD policies, they are likely to implement enterprise video solutions to enable their employees to communicate with one another or with clients.

The growing adoption of enterprise video mainly BYOD and CYOD policies by organizations is propelling the enterprise video market key trends and opportunities forward.

Comparative View Of Adjacent Enterprise Video Market

Enterprise Video Market:

Attributes Enterprise Video Market
CAGR (2022 to 2032) 13.8%
Market Value (2027) USD 35.60 billion
Growth Factor It is necessary to increase operational efficiency and employee productivity.
Opportunity The global enterprise video market is being driven by the need to improve operational efficiency and productivity.
Key Trends Increased use of BYOD and CYOD solutions

Video Streaming Software Market:

Attributes Video Streaming Software Market
CAGR (2022 to 2032) 18.5%
Market Value (2027) USD 20.77 billion
Growth Factor Increased use of mobile devices and internet users
Opportunity Preferences for online streaming services over traditional television are growing.
Key Trends Transcoding is becoming increasingly important in order to deliver videos to as many people as possible.

Video Surveillance Market:

Attributes Video Surveillance Market
CAGR (2022 to 2032) 10%
Market Value (2027) USD 76 billion
Growth Factor In response to COVID-19, the use of thermal cameras is increasing.
Opportunity Increased camera capabilities, maturing technology, features, and customized systems make it easier for integrators to meet the demand of end users looking to upgrade legacy surveillance systems to meet their security and operational requirements.
Key Trends Video cameras' hardware capabilities have been enhanced

Which Is The Leading Segment In The Enterprise Video Market By Solution?

The video conferencing segment accounted for more than 40% of total enterprise video market revenue. This is due to the growing demand for enterprise video along with video communication, which is being driven by geographically dispersed business operations and the adoption of remote working models.

The outbreak of the pandemic has resulted in a significant increase in the number of online workshops, conferences, and seminars, increasing the demand for enterprise video solutions. The global enterprise video market expansion of the telemedicine industry, as well as the increased penetration of online education, have created new enterprise video market growth and enterprise video market opportunities for the segment.

Which Is The Leading Segment In The Enterprise Video Market By Service?

Due to the constant demand for enterprise video experts to help organizations troubleshoot, integrate, and manage enterprise video solutions, the professional services segment accounted for more than 47% of revenue enterprise video market share in 2021.

The professional services enable users to address security issues and improve overall security measures for digital marketing software implementation. The primary benefits of enterprise video services include better resource utilization, lower administrative costs, and increased profitability.

Which Is The Leading Segment In The Enterprise Video Market By End Use?

The healthcare and life sciences segment is expected to grow at a CAGR of nearly 15.8% between 2022 and 2030, owing to the growing adoption of enterprise video systems to provide immediate medical assistance to patients in remote areas.

The enterprise video software facilitates collaboration between patients and healthcare teams by allowing hospital staff to provide patients with specific videos based on their medical records.

The growing emphasis of various healthcare organizations on delivering medical training through the demand for enterprise video solutions is favouring enterprise video market growth for the segment.

Which Is The Leading Segment In The Enterprise Video Market By Application?

Various retailers are using video-based advertising to provide personalized updates on products, offers, and discounts, and the marketing and client engagement segment for the enterprise video market is expected to grow at a CAGR of 14.5% during the forecast period.

Several gaming companies are now using videos to enterprise video market their games on social media platforms, which bodes well for the segment's enterprise video market growth.

The companies like SalesLoft and Pegasystems Inc. are incorporating webinar software for marketing and client engagement, which will help the segment grow in the coming years and surge the enterprise video market future trends as well as the enterprise video market opportunities.

Which Is The Leading Region In The Enterprise Video Market?

Due to the presence of major enterprise video market players in the region, the North American enterprise video market accounted for a revenue enterprise video market share of around 43% in 2022.

Access to high-quality internet, combined with rising demand for visual meetings, has created lucrative enterprise video market opportunities in the US enterprise video market. Furthermore, rising demand for virtual private networks across a variety of businesses and educational institutions is expected to drive regional enterprise video market growth in the coming years.

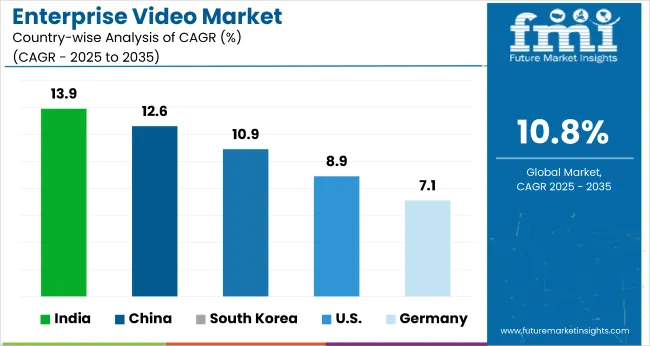
With rising media consumption in the region, the Asia Pacific enterprise video market is expected to grow at a CAGR of 15.7% during the forecast period. The expansions of network infrastructure, as well as the presence of several small and medium-sized businesses in India and China, are having a positive impact on the enterprise video market.

The growing popularity of distance education and e-learning in Australia, China, Japan, Singapore, and India is creating numerous enterprise video market opportunities for enterprise video market participants.

How Competition Influences The Enterprise Video Market?

The enterprise video market’s major players are primarily focused on developing and delivering innovative video streaming solutions in order to strengthen their position in the enterprise video market.

Adobe, Inc., Avaya Inc., Brightcove Inc., Cisco Systems, Inc., IBM Corporation, Kaltura, Microsoft Corporation, Polycom, Inc., VBrick Systems, and Vidyo Inc. are among the major vendors providing enterprise video solutions and services around the world.

RECENT DEVELOPMENTS

Expansion:

  • Avaya announced in November 2020 that the Avaya Cloud Office, a unified communications solution that includes team messaging, video meetings, and cloud PBX, would be expanded to five of Europe's largest economies - Austria, Belgium, Germany, Italy, and Spain - in December 2020.

Product Update:

  • Microsoft added a number of useful features to its Teams applications in October 2020, including virtual visits and Electronic Healthcare Record (EHR) integration, Teams policy packages, secure messaging, Teams templates, and care coordination and collaboration.

Acquisition:

  • Cisco announced the acquisition of BabbleLabs, a company that designs and develops communication software, in August 2020 in order to improve the user's video meeting experience.

Agreement:

  • Avaya and Tradewinds Brokerage signed a Master Agent agreement in October 2020 to expand Avaya's communications and collaboration solutions market in Australia and establish new, recurring revenue streams.

Launch:

  • In collaboration with Cisco, IBM will launch an extended free trial of its Video Streaming platform in May 2020. Customers will be able to live stream Cisco Webex meetings through IBM Watson Media's Video Streaming platform as a result of this collaboration.

Key Players

  • Adobe
  • Avaya Inc.
  • Brightcove Inc.
  • Cisco Systems, Inc.
  • IBM Corporation
  • Kaltura, Inc.
  • Microsoft
  • Polycom, Inc. (Plantronics, Inc.)
  • VBrick
  • Vidyo, Inc.

Key Segments

By Solution:

  • Video Conferencing
  • Video Content Management
  • Webcasting

By Services:

  • Integration & Deployment
  • Managed Service
  • Professional Service

By Deployment:

  • Cloud
  • On-premises

By Application:

  • Corporate Communications
  • Training & Development
  • Marketing & Client Engagement

By Delivery Technique:

  • Downloading/ Traditional Streaming
  • Adaptive Streaming
  • Progressive Downloading

By Organization Size:

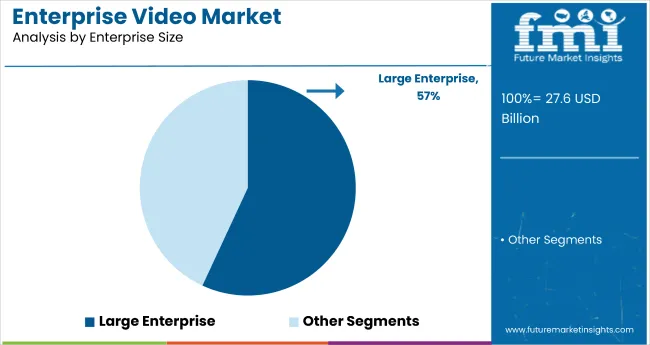
  • Large Enterprise
  • Small & Medium Enterprise (SME)

By End-use:

  • IT & Telecom
  • Banking, Financial Services, and Insurance (BFSI)
  • Healthcare & Life Sciences
  • Media & Entertainment
  • Education
  • Retail & Consumer Goods
  • Others

Frequently Asked Questions

What is the CAGR of the Enterprise Video Market?

The enterprise video market is projected to have a CAGR of 13.8% in 2032.

Which is the Leading Region in the Enterprise Video Market?

North America is the leading region in the enterprise video market, with revenue share of around 43% by 2032.

Which Segment Leads in the Enterprise Video Market by Application?

Marketing and client engagement segment leads the enterprise video market with the projected CAGR of 14.5% by 2032.

What is the Growth Estimated for the Enterprise Video Market by 2032?

The enterprise video market is predicted to grow US$ 77.32 Billion by 2032.

Which Segment Leads in the Enterprise Video Market by deployment?

On-premises enterprise video segment lead the enterprise video market with the a revenue share of 61.3% by 2032.

Table of Content

1. Executive Summary | Enterprise Video Market

    1.1. Global Market Outlook

    1.2. Demand-side Trends

    1.3. Supply-side Trends

    1.4. Technology Roadmap Analysis

    1.5. Analysis and Recommendations

2. Market Overview

    2.1. Market Coverage / Taxonomy

    2.2. Market Definition / Scope / Limitations

3. Market Background

    3.1. Market Dynamics

        3.1.1. Drivers

        3.1.2. Restraints

        3.1.3. Opportunity

        3.1.4. Trends

    3.2. Scenario Forecast

        3.2.1. Demand in Optimistic Scenario

        3.2.2. Demand in Likely Scenario

        3.2.3. Demand in Conservative Scenario

    3.3. Opportunity Map Analysis

    3.4. Investment Feasibility Matrix

    3.5. Value Chain Analysis

        3.5.1. Profit Margin Analysis

        3.5.2. Service Providers

    3.6. PESTLE and Porter’s Analysis

    3.7. Regulatory Landscape

        3.7.1. By Key Regions

        3.7.2. By Key Countries

    3.8. Regional Parent Market Outlook

4. Global Market Analysis 2017 to 2021 and Forecast, 2022 to 2032

    4.1. Historical Market Size Value (US$ Million) Analysis, 2017 to 2021

    4.2. Current and Future Market Size Value (US$ Million) Projections, 2022 to 2032

        4.2.1. Y-o-Y Growth Trend Analysis

        4.2.2. Absolute $ Opportunity Analysis

5. Global Market Analysis 2017 to 2021 and Forecast 2022 to 2032, By Solution

    5.1. Introduction / Key Findings

    5.2. Historical Market Size Value (US$ Million) Analysis By Solution, 2017 to 2021

    5.3. Current and Future Market Size Value (US$ Million) Analysis and Forecast By Solution, 2022 to 2032

        5.3.1. Video Conferencing

        5.3.2. Video Content Management

        5.3.3. Webcasting

    5.4. Y-o-Y Growth Trend Analysis By Solution, 2017 to 2021

    5.5. Absolute $ Opportunity Analysis By Solution, 2022 to 2032

6. Global Market Analysis 2017 to 2021 and Forecast 2022 to 2032, By Services

    6.1. Introduction / Key Findings

    6.2. Historical Market Size Value (US$ Million) Analysis By Services, 2017 to 2021

    6.3. Current and Future Market Size Value (US$ Million) Analysis and Forecast By Services, 2022 to 2032

        6.3.1. Integration & Deployment Services

        6.3.2. Managed Services

        6.3.3. Professional Services

    6.4. Y-o-Y Growth Trend Analysis By Services, 2017 to 2021

    6.5. Absolute $ Opportunity Analysis By Services, 2022 to 2032

7. Global Market Analysis 2017 to 2021 and Forecast 2022 to 2032, By Deployment

    7.1. Introduction / Key Findings

    7.2. Historical Market Size Value (US$ Million) Analysis By Deployment, 2017 to 2021

    7.3. Current and Future Market Size Value (US$ Million) Analysis and Forecast By Deployment, 2022 to 2032

        7.3.1. Cloud

        7.3.2. On-premises

    7.4. Y-o-Y Growth Trend Analysis By Deployment, 2017 to 2021

    7.5. Absolute $ Opportunity Analysis By Deployment, 2022 to 2032

8. Global Market Analysis 2017 to 2021 and Forecast 2022 to 2032, By Application

    8.1. Introduction / Key Findings

    8.2. Historical Market Size Value (US$ Million) Analysis By Application, 2017 to 2021

    8.3. Current and Future Market Size Value (US$ Million) Analysis and Forecast By Application, 2022 to 2032

        8.3.1. Corporate Communications

        8.3.2. Training & Development

        8.3.3. Marketing & Client Engagement

    8.4. Y-o-Y Growth Trend Analysis By Application, 2017 to 2021

    8.5. Absolute $ Opportunity Analysis By Application, 2022 to 2032

9. Global Market Analysis 2017 to 2021 and Forecast 2022 to 2032, By Delivery Technique

    9.1. Introduction / Key Findings

    9.2. Historical Market Size Value (US$ Million) Analysis By Delivery Technique, 2017 to 2021

    9.3. Current and Future Market Size Value (US$ Million) Analysis and Forecast By Delivery Technique, 2022 to 2032

        9.3.1. Downloading/ Traditional Streaming

        9.3.2. Adaptive Streaming

        9.3.3. Progressive Downloading

    9.4. Y-o-Y Growth Trend Analysis By Delivery Technique, 2017 to 2021

    9.5. Absolute $ Opportunity Analysis By Delivery Technique, 2022 to 2032

10. Global Market Analysis 2017 to 2021 and Forecast 2022 to 2032, By Organization Size

    10.1. Introduction / Key Findings

    10.2. Historical Market Size Value (US$ Million) Analysis By Organization Size, 2017 to 2021

    10.3. Current and Future Market Size Value (US$ Million) Analysis and Forecast By Organization Size, 2022 to 2032

        10.3.1. Large Enterprise

        10.3.2. Small & Medium Enterprise

    10.4. Y-o-Y Growth Trend Analysis By Organization Size, 2017 to 2021

    10.5. Absolute $ Opportunity Analysis By Organization Size, 2022 to 2032

11. Global Market Analysis 2017 to 2021 and Forecast 2022 to 2032, By End-use

    11.1. Introduction / Key Findings

    11.2. Historical Market Size Value (US$ Million) Analysis By End-use, 2017 to 2021

    11.3. Current and Future Market Size Value (US$ Million) Analysis and Forecast By End-use, 2022 to 2032

        11.3.1. IT & Telecom

        11.3.2. Banking, Financial Services, and Insurance

        11.3.3. Healthcare & Life Sciences

        11.3.4. Media & Entertainment

        11.3.5. Education

        11.3.6. Retail & Consumer Goods

        11.3.7. Others

    11.4. Y-o-Y Growth Trend Analysis By End-use, 2017 to 2021

    11.5. Absolute $ Opportunity Analysis By End-use, 2022 to 2032

12. Global Market Analysis 2017 to 2021 and Forecast 2022 to 2032, By Region

    12.1. Introduction

    12.2. Historical Market Size Value (US$ Million) Analysis By Region, 2017 to 2021

    12.3. Current Market Size Value (US$ Million) Analysis and Forecast By Region, 2022 to 2032

        12.3.1. North America

        12.3.2. Latin America

        12.3.3. Europe

        12.3.4. East Asia

        12.3.5. South Asia & Pacific

        12.3.6. Middle East and Africa (MEA)

    12.4. Market Attractiveness Analysis By Region

13. North America Market Analysis 2017 to 2021 and Forecast 2022 to 2032, By Country

    13.1. Historical Market Size Value (US$ Million) Trend Analysis By Market Taxonomy, 2017 to 2021

    13.2. Market Size Value (US$ Million) Forecast By Market Taxonomy, 2022 to 2032

        13.2.1. By Country

            13.2.1.1. United States of America

            13.2.1.2. Canada

        13.2.2. By Solution

        13.2.3. By Services

        13.2.4. By Deployment

        13.2.5. By Application

        13.2.6. By Delivery Technique

        13.2.7. By Organization Size

        13.2.8. By End-use

    13.3. Market Attractiveness Analysis

        13.3.1. By Country

        13.3.2. By Solution

        13.3.3. By Services

        13.3.4. By Deployment

        13.3.5. By Application

        13.3.6. By Delivery Technique

        13.3.7. By Organization Size

        13.3.8. By End-use

    13.4. Key Takeaways

14. Latin America Market Analysis 2017 to 2021 and Forecast 2022 to 2032, By Country

    14.1. Historical Market Size Value (US$ Million) Trend Analysis By Market Taxonomy, 2017 to 2021

    14.2. Market Size Value (US$ Million) Forecast By Market Taxonomy, 2022 to 2032

        14.2.1. By Country

            14.2.1.1. Mexico

            14.2.1.2. Brazil

            14.2.1.3. Rest of Latin America

        14.2.2. By Solution

        14.2.3. By Services

        14.2.4. By Deployment

        14.2.5. By Application

        14.2.6. By Delivery Technique

        14.2.7. By Organization Size

        14.2.8. By End-use

    14.3. Market Attractiveness Analysis

        14.3.1. By Country

        14.3.2. By Solution

        14.3.3. By Services

        14.3.4. By Deployment

        14.3.5. By Application

        14.3.6. By Delivery Technique

        14.3.7. By Organization Size

        14.3.8. By End-use

    14.4. Key Takeaways

15. Europe Market Analysis 2017 to 2021 and Forecast 2022 to 2032, By Country

    15.1. Historical Market Size Value (US$ Million) Trend Analysis By Market Taxonomy, 2017 to 2021

    15.2. Market Size Value (US$ Million) Forecast By Market Taxonomy, 2022 to 2032

        15.2.1. By Country

            15.2.1.1. Germany

            15.2.1.2. Italy

            15.2.1.3. France

            15.2.1.4. United Kingdom

            15.2.1.5. Spain

            15.2.1.6. BENELUX

            15.2.1.7. Russia

            15.2.1.8. Rest of Europe

        15.2.2. By Solution

        15.2.3. By Services

        15.2.4. By Deployment

        15.2.5. By Application

        15.2.6. By Delivery Technique

        15.2.7. By Organization Size

        15.2.8. By End-use

    15.3. Market Attractiveness Analysis

        15.3.1. By Country

        15.3.2. By Solution

        15.3.3. By Services

        15.3.4. By Deployment

        15.3.5. By Application

        15.3.6. By Delivery Technique

        15.3.7. By Organization Size

        15.3.8. By End-use

    15.4. Key Takeaways

16. East Asia Market Analysis 2017 to 2021 and Forecast 2022 to 2032, By Country

    16.1. Historical Market Size Value (US$ Million) Trend Analysis By Market Taxonomy, 2017 to 2021

    16.2. Market Size Value (US$ Million) Forecast By Market Taxonomy, 2022 to 2032

        16.2.1. By Country

            16.2.1.1. China

            16.2.1.2. Japan

            16.2.1.3. South Korea

        16.2.2. By Solution

        16.2.3. By Services

        16.2.4. By Deployment

        16.2.5. By Application

        16.2.6. By Delivery Technique

        16.2.7. By Organization Size

        16.2.8. By End-use

    16.3. Market Attractiveness Analysis

        16.3.1. By Country

        16.3.2. By Solution

        16.3.3. By Services

        16.3.4. By Deployment

        16.3.5. By Application

        16.3.6. By Delivery Technique

        16.3.7. By Organization Size

        16.3.8. By End-use

    16.4. Key Takeaways

17. South Asia & Pacific Market Analysis 2017 to 2021 and Forecast 2022 to 2032, By Country

    17.1. Historical Market Size Value (US$ Million) Trend Analysis By Market Taxonomy, 2017 to 2021

    17.2. Market Size Value (US$ Million) Forecast By Market Taxonomy, 2022 to 2032

        17.2.1. By Country

            17.2.1.1. India

            17.2.1.2. ASEAN

            17.2.1.3. Australia and New Zealand

            17.2.1.4. Rest of South Asia & Pacific

        17.2.2. By Solution

        17.2.3. By Services

        17.2.4. By Deployment

        17.2.5. By Application

        17.2.6. By Delivery Technique

        17.2.7. By Organization Size

        17.2.8. By End-use

    17.3. Market Attractiveness Analysis

        17.3.1. By Country

        17.3.2. By Solution

        17.3.3. By Services

        17.3.4. By Deployment

        17.3.5. By Application

        17.3.6. By Delivery Technique

        17.3.7. By Organization Size

        17.3.8. By End-use

    17.4. Key Takeaways

18. MEA Market Analysis 2017 to 2021 and Forecast 2022 to 2032, By Country

    18.1. Historical Market Size Value (US$ Million) Trend Analysis By Market Taxonomy, 2017 to 2021

    18.2. Market Size Value (US$ Million) Forecast By Market Taxonomy, 2022 to 2032

        18.2.1. By Country

            18.2.1.1. GCC Countries

            18.2.1.2. Turkey

            18.2.1.3. South Africa

            18.2.1.4. Rest of MEA

        18.2.2. By Solution

        18.2.3. By Services

        18.2.4. By Deployment

        18.2.5. By Application

        18.2.6. By Delivery Technique

        18.2.7. By Organization Size

        18.2.8. By End-use

    18.3. Market Attractiveness Analysis

        18.3.1. By Country

        18.3.2. By Solution

        18.3.3. By Services

        18.3.4. By Deployment

        18.3.5. By Application

        18.3.6. By Delivery Technique

        18.3.7. By Organization Size

        18.3.8. By End-use

    18.4. Key Takeaways

19. Key Countries Market Analysis

    19.1. United States of America

        19.1.1. Pricing Analysis

        19.1.2. Market Share Analysis, 2021

            19.1.2.1. By Solution

            19.1.2.2. By Services

            19.1.2.3. By Deployment

            19.1.2.4. By Application

            19.1.2.5. By Delivery Technique

            19.1.2.6. By Organization Size

            19.1.2.7. By End-use

    19.2. Canada

        19.2.1. Pricing Analysis

        19.2.2. Market Share Analysis, 2021

            19.2.2.1. By Solution

            19.2.2.2. By Services

            19.2.2.3. By Deployment

            19.2.2.4. By Application

            19.2.2.5. By Delivery Technique

            19.2.2.6. By Organization Size

            19.2.2.7. By End-use

    19.3. Mexico

        19.3.1. Pricing Analysis

        19.3.2. Market Share Analysis, 2021

            19.3.2.1. By Solution

            19.3.2.2. By Services

            19.3.2.3. By Deployment

            19.3.2.4. By Application

            19.3.2.5. By Delivery Technique

            19.3.2.6. By Organization Size

            19.3.2.7. By End-use

    19.4. Brazil

        19.4.1. Pricing Analysis

        19.4.2. Market Share Analysis, 2021

            19.4.2.1. By Solution

            19.4.2.2. By Services

            19.4.2.3. By Deployment

            19.4.2.4. By Application

            19.4.2.5. By Delivery Technique

            19.4.2.6. By Organization Size

            19.4.2.7. By End-use

    19.5. Germany

        19.5.1. Pricing Analysis

        19.5.2. Market Share Analysis, 2021

            19.5.2.1. By Solution

            19.5.2.2. By Services

            19.5.2.3. By Deployment

            19.5.2.4. By Application

            19.5.2.5. By Delivery Technique

            19.5.2.6. By Organization Size

            19.5.2.7. By End-use

    19.6. Italy

        19.6.1. Pricing Analysis

        19.6.2. Market Share Analysis, 2021

            19.6.2.1. By Solution

            19.6.2.2. By Services

            19.6.2.3. By Deployment

            19.6.2.4. By Application

            19.6.2.5. By Delivery Technique

            19.6.2.6. By Organization Size

            19.6.2.7. By End-use

    19.7. France

        19.7.1. Pricing Analysis

        19.7.2. Market Share Analysis, 2021

            19.7.2.1. By Solution

            19.7.2.2. By Services

            19.7.2.3. By Deployment

            19.7.2.4. By Application

            19.7.2.5. By Delivery Technique

            19.7.2.6. By Organization Size

            19.7.2.7. By End-use

    19.8. United Kingdom

        19.8.1. Pricing Analysis

        19.8.2. Market Share Analysis, 2021

            19.8.2.1. By Solution

            19.8.2.2. By Services

            19.8.2.3. By Deployment

            19.8.2.4. By Application

            19.8.2.5. By Delivery Technique

            19.8.2.6. By Organization Size

            19.8.2.7. By End-use

    19.9. Spain

        19.9.1. Pricing Analysis

        19.9.2. Market Share Analysis, 2021

            19.9.2.1. By Solution

            19.9.2.2. By Services

            19.9.2.3. By Deployment

            19.9.2.4. By Application

            19.9.2.5. By Delivery Technique

            19.9.2.6. By Organization Size

            19.9.2.7. By End-use

    19.10. BENELUX

        19.10.1. Pricing Analysis

        19.10.2. Market Share Analysis, 2021

            19.10.2.1. By Solution

            19.10.2.2. By Services

            19.10.2.3. By Deployment

            19.10.2.4. By Application

            19.10.2.5. By Delivery Technique

            19.10.2.6. By Organization Size

            19.10.2.7. By End-use

    19.11. Russia

        19.11.1. Pricing Analysis

        19.11.2. Market Share Analysis, 2021

            19.11.2.1. By Solution

            19.11.2.2. By Services

            19.11.2.3. By Deployment

            19.11.2.4. By Application

            19.11.2.5. By Delivery Technique

            19.11.2.6. By Organization Size

            19.11.2.7. By End-use

    19.12. China

        19.12.1. Pricing Analysis

        19.12.2. Market Share Analysis, 2021

            19.12.2.1. By Solution

            19.12.2.2. By Services

            19.12.2.3. By Deployment

            19.12.2.4. By Application

            19.12.2.5. By Delivery Technique

            19.12.2.6. By Organization Size

            19.12.2.7. By End-use

    19.13. Japan

        19.13.1. Pricing Analysis

        19.13.2. Market Share Analysis, 2021

            19.13.2.1. By Solution

            19.13.2.2. By Services

            19.13.2.3. By Deployment

            19.13.2.4. By Application

            19.13.2.5. By Delivery Technique

            19.13.2.6. By Organization Size

            19.13.2.7. By End-use

    19.14. South Korea

        19.14.1. Pricing Analysis

        19.14.2. Market Share Analysis, 2021

            19.14.2.1. By Solution

            19.14.2.2. By Services

            19.14.2.3. By Deployment

            19.14.2.4. By Application

            19.14.2.5. By Delivery Technique

            19.14.2.6. By Organization Size

            19.14.2.7. By End-use

    19.15. India

        19.15.1. Pricing Analysis

        19.15.2. Market Share Analysis, 2021

            19.15.2.1. By Solution

            19.15.2.2. By Services

            19.15.2.3. By Deployment

            19.15.2.4. By Application

            19.15.2.5. By Delivery Technique

            19.15.2.6. By Organization Size

            19.15.2.7. By End-use

    19.16. ASIAN

        19.16.1. Pricing Analysis

        19.16.2. Market Share Analysis, 2021

            19.16.2.1. By Solution

            19.16.2.2. By Services

            19.16.2.3. By Deployment

            19.16.2.4. By Application

            19.16.2.5. By Delivery Technique

            19.16.2.6. By Organization Size

            19.16.2.7. By End-use

    19.17. Australia and New Zealand

        19.17.1. Pricing Analysis

        19.17.2. Market Share Analysis, 2021

            19.17.2.1. By Solution

            19.17.2.2. By Services

            19.17.2.3. By Deployment

            19.17.2.4. By Application

            19.17.2.5. By Delivery Technique

            19.17.2.6. By Organization Size

            19.17.2.7. By End-use

    19.18. GCC Countries

        19.18.1. Pricing Analysis

        19.18.2. Market Share Analysis, 2021

            19.18.2.1. By Solution

            19.18.2.2. By Services

            19.18.2.3. By Deployment

            19.18.2.4. By Application

            19.18.2.5. By Delivery Technique

            19.18.2.6. By Organization Size

            19.18.2.7. By End-use

    19.19. Turkey

        19.19.1. Pricing Analysis

        19.19.2. Market Share Analysis, 2021

            19.19.2.1. By Solution

            19.19.2.2. By Services

            19.19.2.3. By Deployment

            19.19.2.4. By Application

            19.19.2.5. By Delivery Technique

            19.19.2.6. By Organization Size

            19.19.2.7. By End-use

    19.20. South Africa

        19.20.1. Pricing Analysis

        19.20.2. Market Share Analysis, 2021

            19.20.2.1. By Solution

            19.20.2.2. By Services

            19.20.2.3. By Deployment

            19.20.2.4. By Application

            19.20.2.5. By Delivery Technique

            19.20.2.6. By Organization Size

            19.20.2.7. By End-use

20. Market Structure Analysis

    20.1. Competition Dashboard

    20.2. Competition Benchmarking

    20.3. Market Share Analysis of Top Players

        20.3.1. By Regional

        20.3.2. By Solution

        20.3.3. By Services

        20.3.4. By Deployment

        20.3.5. By Application

        20.3.6. By Delivery Technique

        20.3.7. By Organization Size

        20.3.8. By End-use

21. Competition Analysis

    21.1. Competition Deep Dive

        21.1.1. Adobe, Inc.

            21.1.1.1. Overview

            21.1.1.2. Product Portfolio

            21.1.1.3. Profitability by Market Segments

            21.1.1.4. Sales Footprint

            21.1.1.5. Strategy Overview

                21.1.1.5.1. Marketing Strategy

                21.1.1.5.2. Product Strategy

                21.1.1.5.3. Channel Strategy

        21.1.2. Avaya Inc.

            21.1.2.1. Overview

            21.1.2.2. Product Portfolio

            21.1.2.3. Profitability by Market Segments

            21.1.2.4. Sales Footprint

            21.1.2.5. Strategy Overview

                21.1.2.5.1. Marketing Strategy

                21.1.2.5.2. Product Strategy

                21.1.2.5.3. Channel Strategy

        21.1.3. Brightcove Inc.

            21.1.3.1. Overview

            21.1.3.2. Product Portfolio

            21.1.3.3. Profitability by Market Segments

            21.1.3.4. Sales Footprint

            21.1.3.5. Strategy Overview

                21.1.3.5.1. Marketing Strategy

                21.1.3.5.2. Product Strategy

                21.1.3.5.3. Channel Strategy

        21.1.4. Cisco Systems, Inc.

            21.1.4.1. Overview

            21.1.4.2. Product Portfolio

            21.1.4.3. Profitability by Market Segments

            21.1.4.4. Sales Footprint

            21.1.4.5. Strategy Overview

                21.1.4.5.1. Marketing Strategy

                21.1.4.5.2. Product Strategy

                21.1.4.5.3. Channel Strategy

        21.1.5. IBM

            21.1.5.1. Overview

            21.1.5.2. Product Portfolio

            21.1.5.3. Profitability by Market Segments

            21.1.5.4. Sales Footprint

            21.1.5.5. Strategy Overview

                21.1.5.5.1. Marketing Strategy

                21.1.5.5.2. Product Strategy

                21.1.5.5.3. Channel Strategy

        21.1.6. Kaltura

            21.1.6.1. Overview

            21.1.6.2. Product Portfolio

            21.1.6.3. Profitability by Market Segments

            21.1.6.4. Sales Footprint

            21.1.6.5. Strategy Overview

                21.1.6.5.1. Marketing Strategy

                21.1.6.5.2. Product Strategy

                21.1.6.5.3. Channel Strategy

        21.1.7. Microsoft Corporation

            21.1.7.1. Overview

            21.1.7.2. Product Portfolio

            21.1.7.3. Profitability by Market Segments

            21.1.7.4. Sales Footprint

            21.1.7.5. Strategy Overview

                21.1.7.5.1. Marketing Strategy

                21.1.7.5.2. Product Strategy

                21.1.7.5.3. Channel Strategy

        21.1.8. Poly Inc.

            21.1.8.1. Overview

            21.1.8.2. Product Portfolio

            21.1.8.3. Profitability by Market Segments

            21.1.8.4. Sales Footprint

            21.1.8.5. Strategy Overview

                21.1.8.5.1. Marketing Strategy

                21.1.8.5.2. Product Strategy

                21.1.8.5.3. Channel Strategy

        21.1.9. VBrick Systems

            21.1.9.1. Overview

            21.1.9.2. Product Portfolio

            21.1.9.3. Profitability by Market Segments

            21.1.9.4. Sales Footprint

            21.1.9.5. Strategy Overview

                21.1.9.5.1. Marketing Strategy

                21.1.9.5.2. Product Strategy

                21.1.9.5.3. Channel Strategy

        21.1.10. Vidyo

            21.1.10.1. Overview

            21.1.10.2. Product Portfolio

            21.1.10.3. Profitability by Market Segments

            21.1.10.4. Sales Footprint

            21.1.10.5. Strategy Overview

                21.1.10.5.1. Marketing Strategy

                21.1.10.5.2. Product Strategy

                21.1.10.5.3. Channel Strategy

22. Assumptions & Acronyms Used

23. Research Methodology

Don't pay for what you don't need

Customize your report by selecting specific countries or regions and save 30%!

List of Tables

Table 01: Global Market Value (US$ Million) Forecast by Region, 2017 to 2032

Table 02: Global Market Value (US$ Million) Forecast by Solution, 2017 to 2032

Table 03: Global Market Value (US$ Million) Forecast by Services, 2017 to 2032

Table 04: Global Market Value (US$ Million) Forecast by Deployment, 2017 to 2032

Table 05: Global Market Value (US$ Million) Forecast by Application, 2017 to 2032

Table 06: Global Market Value (US$ Million) Forecast by Delivery Technique, 2017 to 2032

Table 07: Global Market Value (US$ Million) Forecast by Organization Size, 2017 to 2032

Table 08: Global Market Value (US$ Million) Forecast by End-use, 2017 to 2032

Table 09: North America Market Value (US$ Million) Forecast by Country, 2017 to 2032

Table 10: North America Market Value (US$ Million) Forecast by Solution, 2017 to 2032

Table 11: North America Market Value (US$ Million) Forecast by Services, 2017 to 2032

Table 12: North America Market Value (US$ Million) Forecast by Deployment, 2017 to 2032

Table 13: North America Market Value (US$ Million) Forecast by Application, 2017 to 2032

Table 14: North America Market Value (US$ Million) Forecast by Delivery Technique, 2017 to 2032

Table 15: North America Market Value (US$ Million) Forecast by Organization Size, 2017 to 2032

Table 16: North America Market Value (US$ Million) Forecast by End-use, 2017 to 2032

Table 17: Latin America Market Value (US$ Million) Forecast by Country, 2017 to 2032

Table 18: Latin America Market Value (US$ Million) Forecast by Solution, 2017 to 2032

Table 19: Latin America Market Value (US$ Million) Forecast by Services, 2017 to 2032

Table 20: Latin America Market Value (US$ Million) Forecast by Deployment, 2017 to 2032

Table 21: Latin America Market Value (US$ Million) Forecast by Application, 2017 to 2032

Table 22: Latin America Market Value (US$ Million) Forecast by Delivery Technique, 2017 to 2032

Table 23: Latin America Market Value (US$ Million) Forecast by Organization Size, 2017 to 2032

Table 24: Latin America Market Value (US$ Million) Forecast by End-use, 2017 to 2032

Table 25: Europe Market Value (US$ Million) Forecast by Country, 2017 to 2032

Table 26: Europe Market Value (US$ Million) Forecast by Solution, 2017 to 2032

Table 27: Europe Market Value (US$ Million) Forecast by Services, 2017 to 2032

Table 28: Europe Market Value (US$ Million) Forecast by Deployment, 2017 to 2032

Table 29: Europe Market Value (US$ Million) Forecast by Application, 2017 to 2032

Table 30: Europe Market Value (US$ Million) Forecast by Delivery Technique, 2017 to 2032

Table 31: Europe Market Value (US$ Million) Forecast by Organization Size, 2017 to 2032

Table 32: Europe Market Value (US$ Million) Forecast by End-use, 2017 to 2032

Table 33: East Asia Market Value (US$ Million) Forecast by Country, 2017 to 2032

Table 34: East Asia Market Value (US$ Million) Forecast by Solution, 2017 to 2032

Table 35: East Asia Market Value (US$ Million) Forecast by Services, 2017 to 2032

Table 36: East Asia Market Value (US$ Million) Forecast by Deployment, 2017 to 2032

Table 37: East Asia Market Value (US$ Million) Forecast by Application, 2017 to 2032

Table 38: East Asia Market Value (US$ Million) Forecast by Delivery Technique, 2017 to 2032

Table 39: East Asia Market Value (US$ Million) Forecast by Organization Size, 2017 to 2032

Table 40: East Asia Market Value (US$ Million) Forecast by End-use, 2017 to 2032

Table 41: South Asia & Pacific Market Value (US$ Million) Forecast by Country, 2017 to 2032

Table 42: South Asia & Pacific Market Value (US$ Million) Forecast by Solution, 2017 to 2032

Table 43: South Asia & Pacific Market Value (US$ Million) Forecast by Services, 2017 to 2032

Table 44: South Asia & Pacific Market Value (US$ Million) Forecast by Deployment, 2017 to 2032

Table 45: South Asia & Pacific Market Value (US$ Million) Forecast by Application, 2017 to 2032

Table 46: South Asia & Pacific Market Value (US$ Million) Forecast by Delivery Technique, 2017 to 2032

Table 47: South Asia & Pacific Market Value (US$ Million) Forecast by Organization Size, 2017 to 2032

Table 48: South Asia & Pacific Market Value (US$ Million) Forecast by End-use, 2017 to 2032

Table 49: MEA Market Value (US$ Million) Forecast by Country, 2017 to 2032

Table 50: MEA Market Value (US$ Million) Forecast by Solution, 2017 to 2032

Table 51: MEA Market Value (US$ Million) Forecast by Services, 2017 to 2032

Table 52: MEA Market Value (US$ Million) Forecast by Deployment, 2017 to 2032

Table 53: MEA Market Value (US$ Million) Forecast by Application, 2017 to 2032

Table 54: MEA Market Value (US$ Million) Forecast by Delivery Technique, 2017 to 2032

Table 55: MEA Market Value (US$ Million) Forecast by Organization Size, 2017 to 2032

Table 56: MEA Market Value (US$ Million) Forecast by End-use, 2017 to 2032
Sudip Saha
Sudip Saha

Principal Consultant

Talk to Analyst

Find your sweet spots for generating winning opportunities in this market.

List of Charts

Figure 01: Global Market Value (US$ Million) by Solution, 2022 to 2032

Figure 02: Global Market Value (US$ Million) by Services, 2022 to 2032

Figure 03: Global Market Value (US$ Million) by Deployment, 2022 to 2032

Figure 04: Global Market Value (US$ Million) by Application, 2022 to 2032

Figure 05: Global Market Value (US$ Million) by Delivery Technique, 2022 to 2032

Figure 06: Global Market Value (US$ Million) by Organization Size, 2022 to 2032

Figure 07: Global Market Value (US$ Million) by End-use, 2022 to 2032

Figure 08: Global Market Value (US$ Million) by Region, 2022 to 2032

Figure 09: Global Market Value (US$ Million) Analysis by Region, 2017 to 2032

Figure 10: Global Market Value Share (%) and BPS Analysis by Region, 2022 to 2032

Figure 11: Global Market Y-o-Y Growth (%) Projections by Region, 2022 to 2032

Figure 12: Global Market Value (US$ Million) Analysis by Solution, 2017 to 2032

Figure 13: Global Market Value Share (%) and BPS Analysis by Solution, 2022 to 2032

Figure 14: Global Market Y-o-Y Growth (%) Projections by Solution, 2022 to 2032

Figure 15: Global Market Value (US$ Million) Analysis by Services, 2017 to 2032

Figure 16: Global Market Value Share (%) and BPS Analysis by Services, 2022 to 2032

Figure 17: Global Market Y-o-Y Growth (%) Projections by Services, 2022 to 2032

Figure 18: Global Market Value (US$ Million) Analysis by Deployment, 2017 to 2032

Figure 19: Global Market Value Share (%) and BPS Analysis by Deployment, 2022 to 2032

Figure 20: Global Market Y-o-Y Growth (%) Projections by Deployment, 2022 to 2032

Figure 21: Global Market Value (US$ Million) Analysis by Application, 2017 to 2032

Figure 22: Global Market Value Share (%) and BPS Analysis by Application, 2022 to 2032

Figure 23: Global Market Y-o-Y Growth (%) Projections by Application, 2022 to 2032

Figure 24: Global Market Value (US$ Million) Analysis by Delivery Technique, 2017 to 2032

Figure 25: Global Market Value Share (%) and BPS Analysis by Delivery Technique, 2022 to 2032

Figure 26: Global Market Y-o-Y Growth (%) Projections by Delivery Technique, 2022 to 2032

Figure 27: Global Market Value (US$ Million) Analysis by Organization Size, 2017 to 2032

Figure 28: Global Market Value Share (%) and BPS Analysis by Organization Size, 2022 to 2032

Figure 29: Global Market Y-o-Y Growth (%) Projections by Organization Size, 2022 to 2032

Figure 30: Global Market Value (US$ Million) Analysis by End-use, 2017 to 2032

Figure 31: Global Market Value Share (%) and BPS Analysis by End-use, 2022 to 2032

Figure 32: Global Market Y-o-Y Growth (%) Projections by End-use, 2022 to 2032

Figure 33: Global Market Attractiveness by Solution, 2022 to 2032

Figure 34: Global Market Attractiveness by Services, 2022 to 2032

Figure 35: Global Market Attractiveness by Deployment, 2022 to 2032

Figure 36: Global Market Attractiveness by Application, 2022 to 2032

Figure 37: Global Market Attractiveness by Delivery Technique, 2022 to 2032

Figure 38: Global Market Attractiveness by Organization Size, 2022 to 2032

Figure 39: Global Market Attractiveness by End-use, 2022 to 2032

Figure 40: Global Market Attractiveness by Region, 2022 to 2032

Figure 41: North America Market Value (US$ Million) by Solution, 2022 to 2032

Figure 42: North America Market Value (US$ Million) by Services, 2022 to 2032

Figure 43: North America Market Value (US$ Million) by Deployment, 2022 to 2032

Figure 44: North America Market Value (US$ Million) by Application, 2022 to 2032

Figure 45: North America Market Value (US$ Million) by Delivery Technique, 2022 to 2032

Figure 46: North America Market Value (US$ Million) by Organization Size, 2022 to 2032

Figure 47: North America Market Value (US$ Million) by End-use, 2022 to 2032

Figure 48: North America Market Value (US$ Million) by Country, 2022 to 2032

Figure 49: North America Market Value (US$ Million) Analysis by Country, 2017 to 2032

Figure 50: North America Market Value Share (%) and BPS Analysis by Country, 2022 to 2032

Figure 51: North America Market Y-o-Y Growth (%) Projections by Country, 2022 to 2032

Figure 52: North America Market Value (US$ Million) Analysis by Solution, 2017 to 2032

Figure 53: North America Market Value Share (%) and BPS Analysis by Solution, 2022 to 2032

Figure 54: North America Market Y-o-Y Growth (%) Projections by Solution, 2022 to 2032

Figure 55: North America Market Value (US$ Million) Analysis by Services, 2017 to 2032

Figure 56: North America Market Value Share (%) and BPS Analysis by Services, 2022 to 2032

Figure 57: North America Market Y-o-Y Growth (%) Projections by Services, 2022 to 2032

Figure 58: North America Market Value (US$ Million) Analysis by Deployment, 2017 to 2032

Figure 59: North America Market Value Share (%) and BPS Analysis by Deployment, 2022 to 2032

Figure 60: North America Market Y-o-Y Growth (%) Projections by Deployment, 2022 to 2032

Figure 61: North America Market Value (US$ Million) Analysis by Application, 2017 to 2032

Figure 62: North America Market Value Share (%) and BPS Analysis by Application, 2022 to 2032

Figure 63: North America Market Y-o-Y Growth (%) Projections by Application, 2022 to 2032

Figure 64: North America Market Value (US$ Million) Analysis by Delivery Technique, 2017 to 2032

Figure 65: North America Market Value Share (%) and BPS Analysis by Delivery Technique, 2022 to 2032

Figure 66: North America Market Y-o-Y Growth (%) Projections by Delivery Technique, 2022 to 2032

Figure 67: North America Market Value (US$ Million) Analysis by Organization Size, 2017 to 2032

Figure 68: North America Market Value Share (%) and BPS Analysis by Organization Size, 2022 to 2032

Figure 69: North America Market Y-o-Y Growth (%) Projections by Organization Size, 2022 to 2032

Figure 70: North America Market Value (US$ Million) Analysis by End-use, 2017 to 2032

Figure 71: North America Market Value Share (%) and BPS Analysis by End-use, 2022 to 2032

Figure 72: North America Market Y-o-Y Growth (%) Projections by End-use, 2022 to 2032

Figure 73: North America Market Attractiveness by Solution, 2022 to 2032

Figure 74: North America Market Attractiveness by Services, 2022 to 2032

Figure 75: North America Market Attractiveness by Deployment, 2022 to 2032

Figure 76: North America Market Attractiveness by Application, 2022 to 2032

Figure 77: North America Market Attractiveness by Delivery Technique, 2022 to 2032

Figure 78: North America Market Attractiveness by Organization Size, 2022 to 2032

Figure 79: North America Market Attractiveness by End-use, 2022 to 2032

Figure 80: North America Market Attractiveness by Country, 2022 to 2032

Figure 81: Latin America Market Value (US$ Million) by Solution, 2022 to 2032

Figure 82: Latin America Market Value (US$ Million) by Services, 2022 to 2032

Figure 83: Latin America Market Value (US$ Million) by Deployment, 2022 to 2032

Figure 84: Latin America Market Value (US$ Million) by Application, 2022 to 2032

Figure 85: Latin America Market Value (US$ Million) by Delivery Technique, 2022 to 2032

Figure 86: Latin America Market Value (US$ Million) by Organization Size, 2022 to 2032

Figure 87: Latin America Market Value (US$ Million) by End-use, 2022 to 2032

Figure 88: Latin America Market Value (US$ Million) by Country, 2022 to 2032

Figure 89: Latin America Market Value (US$ Million) Analysis by Country, 2017 to 2032

Figure 90: Latin America Market Value Share (%) and BPS Analysis by Country, 2022 to 2032

Figure 91: Latin America Market Y-o-Y Growth (%) Projections by Country, 2022 to 2032

Figure 92: Latin America Market Value (US$ Million) Analysis by Solution, 2017 to 2032

Figure 93: Latin America Market Value Share (%) and BPS Analysis by Solution, 2022 to 2032

Figure 94: Latin America Market Y-o-Y Growth (%) Projections by Solution, 2022 to 2032

Figure 95: Latin America Market Value (US$ Million) Analysis by Services, 2017 to 2032

Figure 96: Latin America Market Value Share (%) and BPS Analysis by Services, 2022 to 2032

Figure 97: Latin America Market Y-o-Y Growth (%) Projections by Services, 2022 to 2032

Figure 98: Latin America Market Value (US$ Million) Analysis by Deployment, 2017 to 2032

Figure 99: Latin America Market Value Share (%) and BPS Analysis by Deployment, 2022 to 2032

Figure 100: Latin America Market Y-o-Y Growth (%) Projections by Deployment, 2022 to 2032

Figure 101: Latin America Market Value (US$ Million) Analysis by Application, 2017 to 2032

Figure 102: Latin America Market Value Share (%) and BPS Analysis by Application, 2022 to 2032

Figure 103: Latin America Market Y-o-Y Growth (%) Projections by Application, 2022 to 2032

Figure 104: Latin America Market Value (US$ Million) Analysis by Delivery Technique, 2017 to 2032

Figure 105: Latin America Market Value Share (%) and BPS Analysis by Delivery Technique, 2022 to 2032

Figure 106: Latin America Market Y-o-Y Growth (%) Projections by Delivery Technique, 2022 to 2032

Figure 107: Latin America Market Value (US$ Million) Analysis by Organization Size, 2017 to 2032

Figure 108: Latin America Market Value Share (%) and BPS Analysis by Organization Size, 2022 to 2032

Figure 109: Latin America Market Y-o-Y Growth (%) Projections by Organization Size, 2022 to 2032

Figure 110: Latin America Market Value (US$ Million) Analysis by End-use, 2017 to 2032

Figure 111: Latin America Market Value Share (%) and BPS Analysis by End-use, 2022 to 2032

Figure 112: Latin America Market Y-o-Y Growth (%) Projections by End-use, 2022 to 2032

Figure 113: Latin America Market Attractiveness by Solution, 2022 to 2032

Figure 114: Latin America Market Attractiveness by Services, 2022 to 2032

Figure 115: Latin America Market Attractiveness by Deployment, 2022 to 2032

Figure 116: Latin America Market Attractiveness by Application, 2022 to 2032

Figure 117: Latin America Market Attractiveness by Delivery Technique, 2022 to 2032

Figure 118: Latin America Market Attractiveness by Organization Size, 2022 to 2032

Figure 119: Latin America Market Attractiveness by End-use, 2022 to 2032

Figure 120: Latin America Market Attractiveness by Country, 2022 to 2032

Figure 121: Europe Market Value (US$ Million) by Solution, 2022 to 2032

Figure 122: Europe Market Value (US$ Million) by Services, 2022 to 2032

Figure 123: Europe Market Value (US$ Million) by Deployment, 2022 to 2032

Figure 124: Europe Market Value (US$ Million) by Application, 2022 to 2032

Figure 125: Europe Market Value (US$ Million) by Delivery Technique, 2022 to 2032

Figure 126: Europe Market Value (US$ Million) by Organization Size, 2022 to 2032

Figure 127: Europe Market Value (US$ Million) by End-use, 2022 to 2032

Figure 128: Europe Market Value (US$ Million) by Country, 2022 to 2032

Figure 129: Europe Market Value (US$ Million) Analysis by Country, 2017 to 2032

Figure 130: Europe Market Value Share (%) and BPS Analysis by Country, 2022 to 2032

Figure 131: Europe Market Y-o-Y Growth (%) Projections by Country, 2022 to 2032

Figure 132: Europe Market Value (US$ Million) Analysis by Solution, 2017 to 2032

Figure 133: Europe Market Value Share (%) and BPS Analysis by Solution, 2022 to 2032

Figure 134: Europe Market Y-o-Y Growth (%) Projections by Solution, 2022 to 2032

Figure 135: Europe Market Value (US$ Million) Analysis by Services, 2017 to 2032

Figure 136: Europe Market Value Share (%) and BPS Analysis by Services, 2022 to 2032

Figure 137: Europe Market Y-o-Y Growth (%) Projections by Services, 2022 to 2032

Figure 138: Europe Market Value (US$ Million) Analysis by Deployment, 2017 to 2032

Figure 139: Europe Market Value Share (%) and BPS Analysis by Deployment, 2022 to 2032

Figure 140: Europe Market Y-o-Y Growth (%) Projections by Deployment, 2022 to 2032

Figure 141: Europe Market Value (US$ Million) Analysis by Application, 2017 to 2032

Figure 142: Europe Market Value Share (%) and BPS Analysis by Application, 2022 to 2032

Figure 143: Europe Market Y-o-Y Growth (%) Projections by Application, 2022 to 2032

Figure 144: Europe Market Value (US$ Million) Analysis by Delivery Technique, 2017 to 2032

Figure 145: Europe Market Value Share (%) and BPS Analysis by Delivery Technique, 2022 to 2032

Figure 146: Europe Market Y-o-Y Growth (%) Projections by Delivery Technique, 2022 to 2032

Figure 147: Europe Market Value (US$ Million) Analysis by Organization Size, 2017 to 2032

Figure 148: Europe Market Value Share (%) and BPS Analysis by Organization Size, 2022 to 2032

Figure 149: Europe Market Y-o-Y Growth (%) Projections by Organization Size, 2022 to 2032

Figure 150: Europe Market Value (US$ Million) Analysis by End-use, 2017 to 2032

Figure 151: Europe Market Value Share (%) and BPS Analysis by End-use, 2022 to 2032

Figure 152: Europe Market Y-o-Y Growth (%) Projections by End-use, 2022 to 2032

Figure 153: Europe Market Attractiveness by Solution, 2022 to 2032

Figure 154: Europe Market Attractiveness by Services, 2022 to 2032

Figure 155: Europe Market Attractiveness by Deployment, 2022 to 2032

Figure 156: Europe Market Attractiveness by Application, 2022 to 2032

Figure 157: Europe Market Attractiveness by Delivery Technique, 2022 to 2032

Figure 158: Europe Market Attractiveness by Organization Size, 2022 to 2032

Figure 159: Europe Market Attractiveness by End-use, 2022 to 2032

Figure 160: Europe Market Attractiveness by Country, 2022 to 2032

Figure 161: East Asia Market Value (US$ Million) by Solution, 2022 to 2032

Figure 162: East Asia Market Value (US$ Million) by Services, 2022 to 2032

Figure 163: East Asia Market Value (US$ Million) by Deployment, 2022 to 2032

Figure 164: East Asia Market Value (US$ Million) by Application, 2022 to 2032

Figure 165: East Asia Market Value (US$ Million) by Delivery Technique, 2022 to 2032

Figure 166: East Asia Market Value (US$ Million) by Organization Size, 2022 to 2032

Figure 167: East Asia Market Value (US$ Million) by End-use, 2022 to 2032

Figure 168: East Asia Market Value (US$ Million) by Country, 2022 to 2032

Figure 169: East Asia Market Value (US$ Million) Analysis by Country, 2017 to 2032

Figure 170: East Asia Market Value Share (%) and BPS Analysis by Country, 2022 to 2032

Figure 171: East Asia Market Y-o-Y Growth (%) Projections by Country, 2022 to 2032

Figure 172: East Asia Market Value (US$ Million) Analysis by Solution, 2017 to 2032

Figure 173: East Asia Market Value Share (%) and BPS Analysis by Solution, 2022 to 2032

Figure 174: East Asia Market Y-o-Y Growth (%) Projections by Solution, 2022 to 2032

Figure 175: East Asia Market Value (US$ Million) Analysis by Services, 2017 to 2032

Figure 176: East Asia Market Value Share (%) and BPS Analysis by Services, 2022 to 2032

Figure 177: East Asia Market Y-o-Y Growth (%) Projections by Services, 2022 to 2032

Figure 178: East Asia Market Value (US$ Million) Analysis by Deployment, 2017 to 2032

Figure 179: East Asia Market Value Share (%) and BPS Analysis by Deployment, 2022 to 2032

Figure 180: East Asia Market Y-o-Y Growth (%) Projections by Deployment, 2022 to 2032

Figure 181: East Asia Market Value (US$ Million) Analysis by Application, 2017 to 2032

Figure 182: East Asia Market Value Share (%) and BPS Analysis by Application, 2022 to 2032

Figure 183: East Asia Market Y-o-Y Growth (%) Projections by Application, 2022 to 2032

Figure 184: East Asia Market Value (US$ Million) Analysis by Delivery Technique, 2017 to 2032

Figure 185: East Asia Market Value Share (%) and BPS Analysis by Delivery Technique, 2022 to 2032

Figure 186: East Asia Market Y-o-Y Growth (%) Projections by Delivery Technique, 2022 to 2032

Figure 187: East Asia Market Value (US$ Million) Analysis by Organization Size, 2017 to 2032

Figure 188: East Asia Market Value Share (%) and BPS Analysis by Organization Size, 2022 to 2032

Figure 189: East Asia Market Y-o-Y Growth (%) Projections by Organization Size, 2022 to 2032

Figure 190: East Asia Market Value (US$ Million) Analysis by End-use, 2017 to 2032

Figure 191: East Asia Market Value Share (%) and BPS Analysis by End-use, 2022 to 2032

Figure 192: East Asia Market Y-o-Y Growth (%) Projections by End-use, 2022 to 2032

Figure 193: East Asia Market Attractiveness by Solution, 2022 to 2032

Figure 194: East Asia Market Attractiveness by Services, 2022 to 2032

Figure 195: East Asia Market Attractiveness by Deployment, 2022 to 2032

Figure 196: East Asia Market Attractiveness by Application, 2022 to 2032

Figure 197: East Asia Market Attractiveness by Delivery Technique, 2022 to 2032

Figure 198: East Asia Market Attractiveness by Organization Size, 2022 to 2032

Figure 199: East Asia Market Attractiveness by End-use, 2022 to 2032

Figure 200: East Asia Market Attractiveness by Country, 2022 to 2032

Figure 201: South Asia & Pacific Market Value (US$ Million) by Solution, 2022 to 2032

Figure 202: South Asia & Pacific Market Value (US$ Million) by Services, 2022 to 2032

Figure 203: South Asia & Pacific Market Value (US$ Million) by Deployment, 2022 to 2032

Figure 204: South Asia & Pacific Market Value (US$ Million) by Application, 2022 to 2032

Figure 205: South Asia & Pacific Market Value (US$ Million) by Delivery Technique, 2022 to 2032

Figure 206: South Asia & Pacific Market Value (US$ Million) by Organization Size, 2022 to 2032

Figure 207: South Asia & Pacific Market Value (US$ Million) by End-use, 2022 to 2032

Figure 208: South Asia & Pacific Market Value (US$ Million) by Country, 2022 to 2032

Figure 209: South Asia & Pacific Market Value (US$ Million) Analysis by Country, 2017 to 2032

Figure 210: South Asia & Pacific Market Value Share (%) and BPS Analysis by Country, 2022 to 2032

Figure 211: South Asia & Pacific Market Y-o-Y Growth (%) Projections by Country, 2022 to 2032

Figure 212: South Asia & Pacific Market Value (US$ Million) Analysis by Solution, 2017 to 2032

Figure 213: South Asia & Pacific Market Value Share (%) and BPS Analysis by Solution, 2022 to 2032

Figure 214: South Asia & Pacific Market Y-o-Y Growth (%) Projections by Solution, 2022 to 2032

Figure 215: South Asia & Pacific Market Value (US$ Million) Analysis by Services, 2017 to 2032

Figure 216: South Asia & Pacific Market Value Share (%) and BPS Analysis by Services, 2022 to 2032

Figure 217: South Asia & Pacific Market Y-o-Y Growth (%) Projections by Services, 2022 to 2032

Figure 218: South Asia & Pacific Market Value (US$ Million) Analysis by Deployment, 2017 to 2032

Figure 219: South Asia & Pacific Market Value Share (%) and BPS Analysis by Deployment, 2022 to 2032

Figure 220: South Asia & Pacific Market Y-o-Y Growth (%) Projections by Deployment, 2022 to 2032

Figure 221: South Asia & Pacific Market Value (US$ Million) Analysis by Application, 2017 to 2032

Figure 222: South Asia & Pacific Market Value Share (%) and BPS Analysis by Application, 2022 to 2032

Figure 223: South Asia & Pacific Market Y-o-Y Growth (%) Projections by Application, 2022 to 2032

Figure 224: South Asia & Pacific Market Value (US$ Million) Analysis by Delivery Technique, 2017 to 2032

Figure 225: South Asia & Pacific Market Value Share (%) and BPS Analysis by Delivery Technique, 2022 to 2032

Figure 226: South Asia & Pacific Market Y-o-Y Growth (%) Projections by Delivery Technique, 2022 to 2032

Figure 227: South Asia & Pacific Market Value (US$ Million) Analysis by Organization Size, 2017 to 2032

Figure 228: South Asia & Pacific Market Value Share (%) and BPS Analysis by Organization Size, 2022 to 2032

Figure 229: South Asia & Pacific Market Y-o-Y Growth (%) Projections by Organization Size, 2022 to 2032

Figure 230: South Asia & Pacific Market Value (US$ Million) Analysis by End-use, 2017 to 2032

Figure 231: South Asia & Pacific Market Value Share (%) and BPS Analysis by End-use, 2022 to 2032

Figure 232: South Asia & Pacific Market Y-o-Y Growth (%) Projections by End-use, 2022 to 2032

Figure 233: South Asia & Pacific Market Attractiveness by Solution, 2022 to 2032

Figure 234: South Asia & Pacific Market Attractiveness by Services, 2022 to 2032

Figure 235: South Asia & Pacific Market Attractiveness by Deployment, 2022 to 2032

Figure 236: South Asia & Pacific Market Attractiveness by Application, 2022 to 2032

Figure 237: South Asia & Pacific Market Attractiveness by Delivery Technique, 2022 to 2032

Figure 238: South Asia & Pacific Market Attractiveness by Organization Size, 2022 to 2032

Figure 239: South Asia & Pacific Market Attractiveness by End-use, 2022 to 2032

Figure 240: South Asia & Pacific Market Attractiveness by Country, 2022 to 2032

Figure 241: MEA Market Value (US$ Million) by Solution, 2022 to 2032

Figure 242: MEA Market Value (US$ Million) by Services, 2022 to 2032

Figure 243: MEA Market Value (US$ Million) by Deployment, 2022 to 2032

Figure 244: MEA Market Value (US$ Million) by Application, 2022 to 2032

Figure 245: MEA Market Value (US$ Million) by Delivery Technique, 2022 to 2032

Figure 246: MEA Market Value (US$ Million) by Organization Size, 2022 to 2032

Figure 247: MEA Market Value (US$ Million) by End-use, 2022 to 2032

Figure 248: MEA Market Value (US$ Million) by Country, 2022 to 2032

Figure 249: MEA Market Value (US$ Million) Analysis by Country, 2017 to 2032

Figure 250: MEA Market Value Share (%) and BPS Analysis by Country, 2022 to 2032

Figure 251: MEA Market Y-o-Y Growth (%) Projections by Country, 2022 to 2032

Figure 252: MEA Market Value (US$ Million) Analysis by Solution, 2017 to 2032

Figure 253: MEA Market Value Share (%) and BPS Analysis by Solution, 2022 to 2032

Figure 254: MEA Market Y-o-Y Growth (%) Projections by Solution, 2022 to 2032

Figure 255: MEA Market Value (US$ Million) Analysis by Services, 2017 to 2032

Figure 256: MEA Market Value Share (%) and BPS Analysis by Services, 2022 to 2032

Figure 257: MEA Market Y-o-Y Growth (%) Projections by Services, 2022 to 2032

Figure 258: MEA Market Value (US$ Million) Analysis by Deployment, 2017 to 2032

Figure 259: MEA Market Value Share (%) and BPS Analysis by Deployment, 2022 to 2032

Figure 260: MEA Market Y-o-Y Growth (%) Projections by Deployment, 2022 to 2032

Figure 261: MEA Market Value (US$ Million) Analysis by Application, 2017 to 2032

Figure 262: MEA Market Value Share (%) and BPS Analysis by Application, 2022 to 2032

Figure 263: MEA Market Y-o-Y Growth (%) Projections by Application, 2022 to 2032

Figure 264: MEA Market Value (US$ Million) Analysis by Delivery Technique, 2017 to 2032

Figure 265: MEA Market Value Share (%) and BPS Analysis by Delivery Technique, 2022 to 2032

Figure 266: MEA Market Y-o-Y Growth (%) Projections by Delivery Technique, 2022 to 2032

Figure 267: MEA Market Value (US$ Million) Analysis by Organization Size, 2017 to 2032

Figure 268: MEA Market Value Share (%) and BPS Analysis by Organization Size, 2022 to 2032

Figure 269: MEA Market Y-o-Y Growth (%) Projections by Organization Size, 2022 to 2032

Figure 270: MEA Market Value (US$ Million) Analysis by End-use, 2017 to 2032

Figure 271: MEA Market Value Share (%) and BPS Analysis by End-use, 2022 to 2032

Figure 272: MEA Market Y-o-Y Growth (%) Projections by End-use, 2022 to 2032

Figure 273: MEA Market Attractiveness by Solution, 2022 to 2032

Figure 274: MEA Market Attractiveness by Services, 2022 to 2032

Figure 275: MEA Market Attractiveness by Deployment, 2022 to 2032

Figure 276: MEA Market Attractiveness by Application, 2022 to 2032

Figure 277: MEA Market Attractiveness by Delivery Technique, 2022 to 2032

Figure 278: MEA Market Attractiveness by Organization Size, 2022 to 2032

Figure 279: MEA Market Attractiveness by End-use, 2022 to 2032

Figure 280: MEA Market Attractiveness by Country, 2022 to 2032

Explore Technology Insights

View Reports