The Video Content Management Market is estimated to be valued at USD 5.8 billion in 2025 and is projected to reach USD 19.4 billion by 2035, registering a compound annual growth rate (CAGR) of 12.9% over the forecast period.
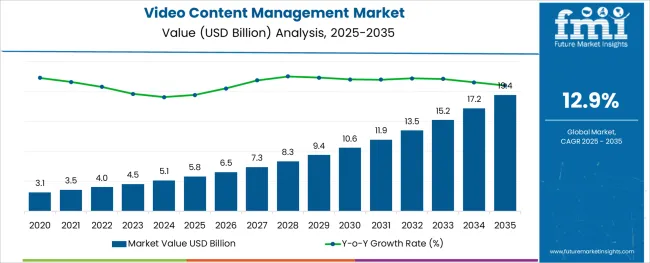
The video content management market is expanding rapidly as organizations seek efficient ways to handle increasing volumes of video data. Industry insights have highlighted the rising use of video for communication, training, marketing, and security purposes. Advances in video platforms have made it easier to store, organize, and retrieve video content across various devices and locations.
Cloud-based solutions have gained momentum due to their scalability, flexibility, and ability to support remote and hybrid work environments. Growing adoption of video in enterprise communication has further fueled demand, enabling organizations to enhance collaboration, engagement, and knowledge sharing.
Market growth is also driven by technological improvements such as AI-based video indexing and enhanced security features. Looking forward, the market is expected to grow with continued digital transformation efforts, especially in industries focusing on remote work and multimedia content delivery. Segment growth is led by Platforms as the primary component, Cloud-based deployment as the preferred mode, and Enterprise Communication as the key application.
The market is segmented by Component, Deployment Mode, Application, and Vertical and region. By Component, the market is divided into Platforms and Services. In terms of Deployment Mode, the market is classified into Cloud-based and On-premise. Based on Application, the market is segmented into Enterprise Communication, Education and Learning, Marketing and Client Engagement, Recruitment and Training, and Virtual Events. By Vertical, the market is divided into Media and Entertainment, BFSI, IT and Telecom, Healthcare and Life Sciences, Education, Retail and E-commerce, and Other Verticals. Regionally, the market is classified into North America, Latin America, Western Europe, Eastern Europe, Balkan & Baltic Countries, Russia & Belarus, Central Asia, East Asia, South Asia & Pacific, and the Middle East & Africa.
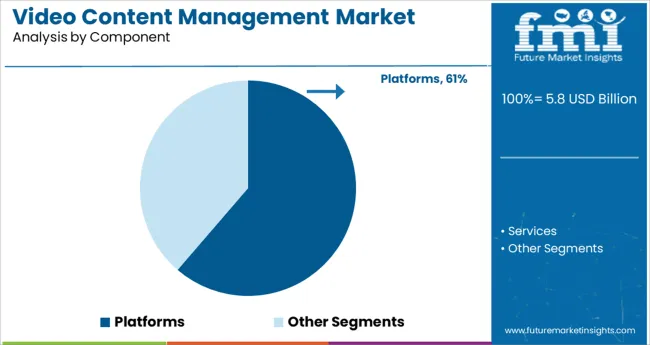
The Platforms segment is projected to hold 61.3% of the video content management market revenue in 2025, maintaining its dominance in market components. This growth is attributed to the central role platforms play in enabling video upload, storage, processing, and playback functionalities.
Platforms offer user-friendly interfaces and integrate with existing enterprise systems, making them vital for managing large-scale video assets. Increasing demand for customizable and scalable platforms has driven product innovation.
The ability to support multiple formats and deliver videos across various devices has made platforms essential for enterprise video strategies. As companies focus on improving content discoverability and user engagement, platforms are expected to retain their leading position in the market.
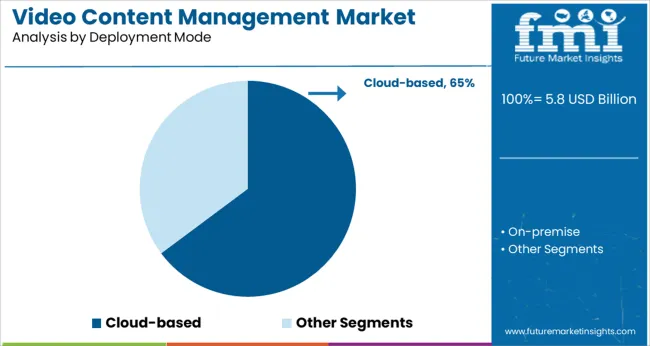
The Cloud-based deployment mode segment is projected to contribute 64.8% of the market revenue in 2025, securing its position as the dominant deployment choice. Cloud solutions offer advantages such as remote access, scalability, reduced IT overhead, and seamless integration with other cloud services.
Organizations have increasingly favored cloud deployment to support remote workforces and distributed teams. Enhanced security protocols and compliance certifications have boosted confidence in cloud-based video management.
The flexibility to scale storage and processing power on demand makes cloud deployment attractive for businesses of all sizes. With ongoing trends toward digital transformation and hybrid work models, cloud-based deployment is expected to continue driving market expansion.
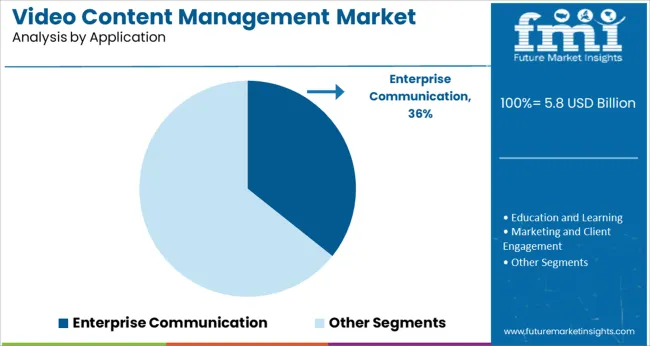
The Enterprise Communication segment is projected to account for 35.7% of the video content management market revenue in 2025, positioning it as the leading application area. Video content has become a critical tool for internal communications including training, announcements, and collaboration.
Organizations have increasingly adopted video to improve employee engagement and facilitate knowledge sharing. The rise of remote and hybrid working models has amplified the need for effective video communication platforms.
Enterprises also leverage video content for branding and customer engagement initiatives. As video continues to play a pivotal role in organizational communication strategies, the enterprise communication segment is expected to sustain its significant market share.
Rising demand for Online Video Content will drive Market Expansion
Organizations are turning to video-based communication solutions to improve employee collaboration and communication, such as web-based communication via video conferencing and video calling. As the pandemic began, the consumption of video content was seen to be rapidly increasing.
According to GWI Research 2024, people in the USA and the United Kingdom increased their content consumption by 22.5% in March 2024. Global SVoD content consumption increased by 20.5%. Globally, the number of paid VoD subscribers increased by 5.1 Million by the end of 2024.
Over the past two years, enterprises have extensively capitalized on the virtual landscape. As the pandemic raged, businesses extensively advocated remote working arrangements, a trend that is likely to continue into the future. Given the amount of office space and resources saved due to such remote working arrangements, it is likely that organizations will continue relying on it. This is likely to generate enhanced demand for video content management software.
5G to accelerate market adoption of Video Content Management Software
5G provides more bandwidth, allowing for faster upload and download speeds, allowing content creators to access improvements in wireless capacities, robust mobile connectivity, and lower latency, allowing for smoother streaming.
With 5G in place, video content producers no longer need to invest in costly infrastructures, such as satellite trucks, providing content distributors with much greater flexibility in video production. Improved mobile broadband will provide a consistent, high-quality experience for cloud video services like content recording and storage.
The adoption of video management services will be accelerated by newer technologies such as live closed captioning and face recognition-based searches powered by AI and ML. The evolution of 5G has yet to realize its full transformative potential, presenting a significant growth opportunity for the video content management market.
The Dearth of Interoperability among Various Video Conferencing Solutions
Even though organizations cannot use video conferencing solutions as UCC tools, Unified Communications and Collaboration (UCC) help increase cooperation, collaboration, and productivity. Most video communication tools are still limited to conference rooms due to the high costs and extensive infrastructure requirements associated with UCC video conferencing solutions.
Some video conferencing solutions do not support interoperability across platforms and devices, making it difficult for users to use video conferencing solutions. As a result, vendors face numerous challenges in promoting video conferencing solutions as a UCC tool.
Demand to be Maximum for Education and Learning
According to the analysis, the education and learning segment is expected to grow at a 12.7% CAGR from 2025 to 2035. Education is one of the fastest-growing industry verticals, as the industry is undergoing extensive development, with technological advancements enhancing the overall industry vertical.
The adoption of video content management system platforms has increased in the education and learning segment, giving it the largest market share. According to industry experts, the growing adoption of digital platforms by educational institutions will create numerous opportunities for industry players over the forecast period.
On-Premise Video Content Management to Witness Major Traction
During the forecast period, the on-premises segment will account for a larger share of the video content management market with a CAGR of 12.8%, as large enterprises increasingly adopt on-premises video content management to maintain full control over their infrastructure and data; and to maintain robust data security pertaining to integration with internal company systems such as customer relationship management, employee management system, and sales management system. While the private cloud model is becoming more popular in organizations to address security and data privacy concerns.
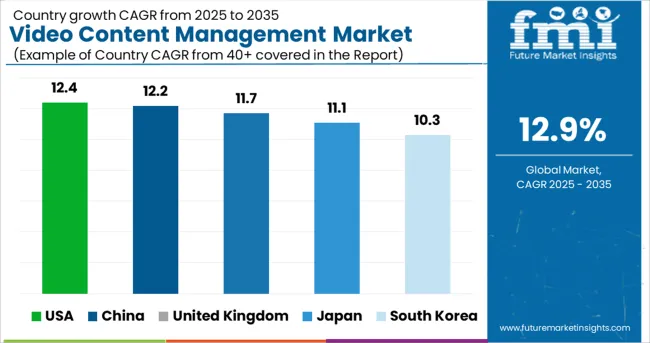
|
Country |
Projected CAGR |
|
USA |
12.4% |
| United Kingdom |
11.7% |
|
China |
12.2% |
|
Japan |
11.1% |
|
South Korea |
10.3% |
Rising Digitization to Bolster Uptake across Key Emerging Economies
The proliferation of smart devices; high-speed internet connectivity; rise in digitalization of enterprises; economic growth and growing foreign investments in economies such as India, Indonesia, and Malaysia; and the presence of high-growth economies such as Australia, Japan, China, and South Korea are all contributing to the growth of the Asia Pacific video content management market.
With improved technological infrastructure, the developed countries in this region are expected to grow significantly. Developing countries are gradually adopting video streaming platforms to advance and streamline their business processes. Countries with dense populations, such as India and China, are gradually moving toward video-streaming monetization models in order to advance and streamline their business processes. China is expected to grow with a CAGR of 12.2%.
In recent years, the audience's preference for global video content has provided growth opportunities for VoD players such as Netflix, Amazon Prime Video, LeTV, Hooq, iFlix, YuppTV, BoxTV, and Hotstar, resulting in increased demand for video content management such as video analytics, delivery, and security.
USA to be the Frontrunner in the North American Growth Story
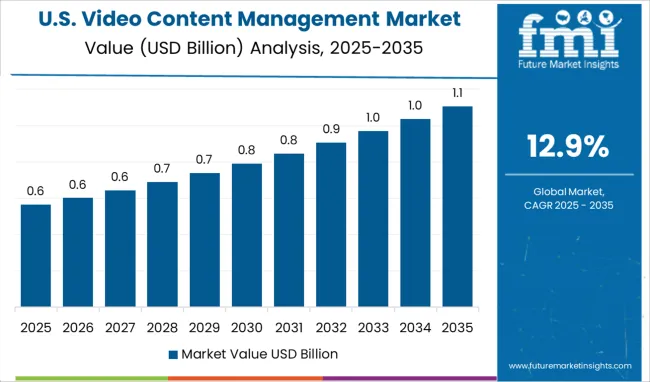
The growing demand for a better video platform is expected to drive the video content management market in North America. The USA market is estimated to expand at a 12.4% growth rate during the forecast period.
The presence of major market players such as IBM Corporation, Microsoft Corporation, Vimeo, Inc., and Brightcove Inc., among others, is encouraging market growth in this region through collaboration, acquisitions, the development of new products, and product enhancements. For example, Qumu Corporation introduced a new enterprise video feature in April 2024. The enterprise video content platform is powered by artificial intelligence (AI) technology, which will enable video viewers to view live captions.
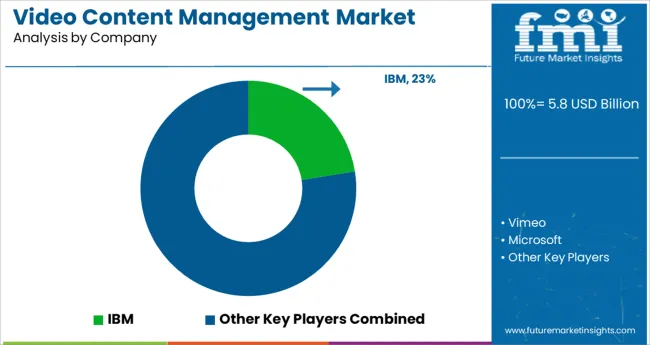
Some of the market key players are IBM Corporation, Microsoft Corporation, Vimeo, Inc., Brightcove Inc., Panopto, Kaltura, Inc., Kollective Technology, Inc., Dalet Digital Media Systems, Qumu Corporation, VIDIZMO LLC., and others.
IBM Corporation and Canon launched a new volumetric video technology in July 2024 to enable the creation of high-quality digital video content technology. The technology makes use of cameras and advanced data processing to enable a video point of view, providing viewers with a more immersive experience.
Brightcove partnered with Wibbitz, a video creation tool provider, in July 2024 to enable Wibbitiz access to BrightCove's video cloud platform. The platform allows users to create polished videos from scratch using Wibbitz's templates and photos, animations, transitions, video clips, and other smart media, and then distribute the videos to any other device via the Brightcove platform.
Qumu Corporation partnered with JS Group, headquartered in Florida, USA, in August 2024. Through this collaboration, Qumu Corporation hopes to launch a global channel program as a result of this collaboration. The program provides operational support, customer benefits, and incentives to assist the company in expanding its penetration in small, medium, and large businesses.
Vimeo Create, a suite of tools for creating professional quality videos for small businesses, was introduced in February 2024. To create a high-quality video for its users, the new product combines smart editing technology with an intuitive interface and access to a gallery of professionally designed video templates and other editing tools.
| Report Attributes | Details |
|---|---|
| Growth Rate | CAGR of 12.9% from 2025 to 2035 |
| Market Value in 2025 | USD 5.8 Billion |
| Market Value in 2035 | USD 19.4 Billion |
| Base Year for Estimation | 2024 |
| Historical Data | 2020 to 2024 |
| Forecast Period | 2025 to 2035 |
| Quantitative Units | billion for Value |
| Report Coverage | Revenue Forecast, Volume Forecast, Company Ranking, Competitive Landscape, Growth Factors, Trends, and Pricing Analysis |
| Segments Covered | Component, Deployment Mode, Application, Vertical, Region |
| Regions Covered | North America; Europe; Asia Pacific; Latin America; Middle East & Africa |
| Key Countries Profiled | USA, Canada, Mexico, Brazil, Germany, France, Italy, BENELUX, United Kingdom, Nordic, China, Japan, South Korea, GCC Countries, South Africa |
| Key Companies Profiled | IBM Corporation; Vimeo; Microsoft; BrightCove; Panopto; Kaltuna; Sonic Foundry; Kollective; Vidyard; Cloudapp |
| Report Customization & Pricing | Available upon Request |
The global video content management market is estimated to be valued at USD 5.8 billion in 2025.
It is projected to reach USD 19.4 billion by 2035.
The market is expected to grow at a 12.9% CAGR between 2025 and 2035.
The key product types are platforms and services.
cloud-based segment is expected to dominate with a 64.8% industry share in 2025.


Our Research Products

The "Full Research Suite" delivers actionable market intel, deep dives on markets or technologies, so clients act faster, cut risk, and unlock growth.

The Leaderboard benchmarks and ranks top vendors, classifying them as Established Leaders, Leading Challengers, or Disruptors & Challengers.

Locates where complements amplify value and substitutes erode it, forecasting net impact by horizon

We deliver granular, decision-grade intel: market sizing, 5-year forecasts, pricing, adoption, usage, revenue, and operational KPIs—plus competitor tracking, regulation, and value chains—across 60 countries broadly.

Spot the shifts before they hit your P&L. We track inflection points, adoption curves, pricing moves, and ecosystem plays to show where demand is heading, why it is changing, and what to do next across high-growth markets and disruptive tech

Real-time reads of user behavior. We track shifting priorities, perceptions of today’s and next-gen services, and provider experience, then pace how fast tech moves from trial to adoption, blending buyer, consumer, and channel inputs with social signals (#WhySwitch, #UX).

Partner with our analyst team to build a custom report designed around your business priorities. From analysing market trends to assessing competitors or crafting bespoke datasets, we tailor insights to your needs.
Supplier Intelligence
Discovery & Profiling
Capacity & Footprint
Performance & Risk
Compliance & Governance
Commercial Readiness
Who Supplies Whom
Scorecards & Shortlists
Playbooks & Docs
Category Intelligence
Definition & Scope
Demand & Use Cases
Cost Drivers
Market Structure
Supply Chain Map
Trade & Policy
Operating Norms
Deliverables
Buyer Intelligence
Account Basics
Spend & Scope
Procurement Model
Vendor Requirements
Terms & Policies
Entry Strategy
Pain Points & Triggers
Outputs
Pricing Analysis
Benchmarks
Trends
Should-Cost
Indexation
Landed Cost
Commercial Terms
Deliverables
Brand Analysis
Positioning & Value Prop
Share & Presence
Customer Evidence
Go-to-Market
Digital & Reputation
Compliance & Trust
KPIs & Gaps
Outputs
Full Research Suite comprises of:
Market outlook & trends analysis
Interviews & case studies
Strategic recommendations
Vendor profiles & capabilities analysis
5-year forecasts
8 regions and 60+ country-level data splits
Market segment data splits
12 months of continuous data updates
DELIVERED AS:
PDF EXCEL ONLINE
Enterprise Video Content Management Market
Video Management Software Market
Web Content Management Market Insights – Growth & Forecast through 2034
Mobile Content Management Market
Component Content Management Systems Market Size and Share Forecast Outlook 2025 to 2035
Enterprise Content Management Market Size and Share Forecast Outlook 2025 to 2035
Video on Demand (VoD) Service Market Size and Share Forecast Outlook 2025 to 2035
Video Processing Platform Market Size and Share Forecast Outlook 2025 to 2035
Video Test Equipment Market Size and Share Forecast Outlook 2025 to 2035
Content Analytics Discovery And Cognitive Systems Market Size and Share Forecast Outlook 2025 to 2035
Content Delivery Network Industry Analysis in Korea Size and Share Forecast Outlook 2025 to 2035
Content Analytics Software Market Size and Share Forecast Outlook 2025 to 2035
Content Delivery Network Industry Analysis in Western Europe Size and Share Forecast Outlook 2025 to 2035
Content Distribution Software Market Size and Share Forecast Outlook 2025 to 2035
Content Creation Software Market Size and Share Forecast Outlook 2025 to 2035
Video Game Market Size and Share Forecast Outlook 2025 to 2035
Video As A Sensor Market Size and Share Forecast Outlook 2025 to 2035
Video Encoders Market Size and Share Forecast Outlook 2025 to 2035
Content Disarm and Reconstruction Market Size and Share Forecast Outlook 2025 to 2035
Video Conferencing Market Size and Share Forecast Outlook 2025 to 2035

Thank you!
You will receive an email from our Business Development Manager. Please be sure to check your SPAM/JUNK folder too.
Chat With
MaRIA