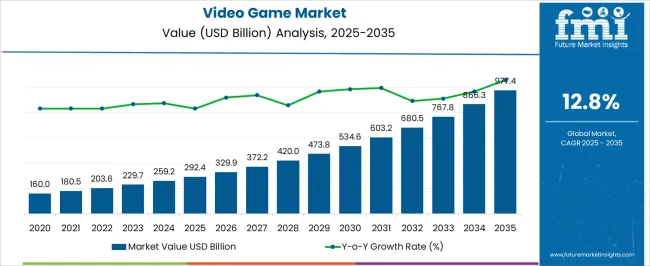
The Video Game Market is estimated to be valued at USD 292.4 billion in 2025 and is projected to reach USD 977.4 billion by 2035, registering a compound annual growth rate (CAGR) of 12.8% over the forecast period.
| Metric | Value |
|---|---|
| Video Game Market Estimated Value in (2025 E) | USD 292.4 billion |
| Video Game Market Forecast Value in (2035 F) | USD 977.4 billion |
| Forecast CAGR (2025 to 2035) | 12.8% |
The Video Game market is experiencing rapid growth, driven by the increasing penetration of smartphones, high-speed internet, and digital entertainment platforms across global markets. Mobile gaming, in particular, is benefiting from the widespread availability of affordable devices, improved hardware performance, and enhanced gaming experiences through advanced graphics and AI-powered gameplay. Cloud-based gaming and online multiplayer functionalities are enabling real-time engagement, social interaction, and competitive gaming experiences, which are attracting diverse audiences.
The market is further supported by innovative monetization models, including in-app purchases, subscriptions, and freemium offerings, which are driving revenue growth. Advancements in gaming software development, cross-platform compatibility, and augmented and virtual reality technologies are expanding the scope of immersive experiences.
Growing demand for casual and competitive gaming among various age groups, along with increasing investments from developers, publishers, and technology providers, is shaping the market landscape As digital entertainment continues to evolve, the Video Game market is expected to maintain sustained growth, supported by technological innovation, accessibility, and a widening consumer base.
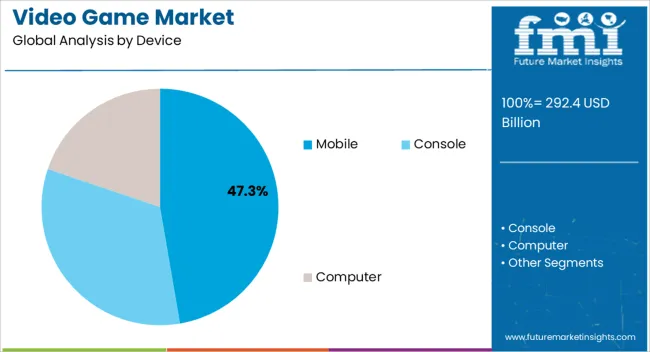
The mobile device segment is projected to hold 47.3% of the market revenue in 2025, establishing it as the leading platform in the Video Game market. Growth in this segment is being driven by the widespread adoption of smartphones and tablets, which provide convenient access to games anywhere and anytime. Mobile devices support a variety of gaming genres, including casual, strategy, and multiplayer formats, enhancing their appeal to diverse audiences.
The availability of high-performance processors, enhanced graphics capabilities, and optimized operating systems has improved gaming experiences and reduced latency, further driving adoption. Mobile gaming platforms also benefit from integrated app stores, cloud saves, and social media connectivity, which enable seamless distribution, updates, and community engagement.
As consumers increasingly prefer portable and accessible gaming solutions, mobile devices continue to dominate the market Ongoing investments in mobile game development, AR and VR integration, and interactive gameplay features are expected to strengthen the segment’s position and drive long-term revenue growth.
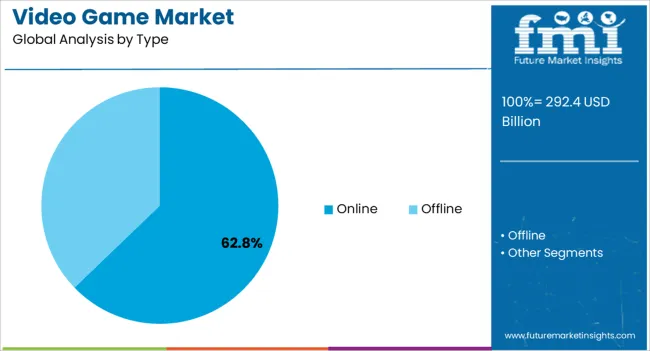
The online type segment is expected to account for 62.8% of the market revenue in 2025, making it the leading type in the Video Game market. Its growth is being driven by the rising demand for multiplayer, competitive, and cloud-based gaming experiences that enable real-time interaction across geographies. Online gaming allows for continuous content updates, events, and community-driven features, which improve engagement and retention.
AI-driven matchmaking, live tournaments, and real-time analytics enhance gameplay, providing personalized experiences for users. The segment is further supported by increasing internet penetration, improved network infrastructure, and adoption of broadband and 5G technologies, which reduce latency and enable seamless gaming experiences.
Online monetization models, including subscriptions, in-game purchases, and battle passes, have created robust revenue streams As consumer demand for interactive and socially connected gaming continues to rise, the online type segment is expected to remain the primary growth driver, supported by technological innovations and a growing base of competitive and casual gamers.
The demand for video game consoles is fueled by features in games like voice recognition, downloadable content, and improved computer graphics that improve user experiences. Further, sales of video games and peripherals are also being driven by the growing popularity of e-sports competitions and the rise in several professional players.
Gaming's potential as a tool for fostering cognitive learning is also being investigated. Though still in its infancy, the idea of "gaming to study" is slowly gaining popularity, giving a new perspective to the video game market outlook.
Video game market trends like new gaming features and applications for mobile, PC, tablet, and console platforms are created as a result of the integration of new technology features like virtual reality and mixed reality, AI, and blockchain.
Game makers are releasing a variety of games on social media to draw in players, including action, role-playing, simulation, and strategy games, which provide several lucrative opportunities for the video game market as a result of realizing that many people utilize social media to find the video game of their choice,
Nations like China and Indonesia are seeing an increase in sales of counterfeit goods, which is unfortunate news for the video game market expansion due to their generally lower pricing,
Growing worries about data security and piracy protection, as well as an increase in gaming-related fraud, are all possible dangers that could impede the video game market growth. Over the course of the forecast period, the video game market growth is also anticipated to be constrained by a sharp increase in health problems and disorders associated with video game addiction.
The global video games market's potential to generate income is predicted to be constrained by the expansion of free-to-play and cheap mobile and laptop games. One of the challenges faced by the video game market key participants is anticipated to be managing the cost and quality of video games.
With a revenue share of more than 45% in 2025, the mobile segment dominated the video game market. Over the course of the forecast, the mobile category is anticipated to maintain its market dominance. Also, the global increase in smartphone adoption is responsible for the mobile market's expansion.
The rising desire for mobile tablets with large displays, which ensures better gaming experiences, is another factor contributing to the expansion of the video game market share. Over the course of the projected period, the segment's growth is anticipated to be significantly influenced by the increasing sales of handheld gaming consoles.
The console segment is anticipated to expand in the video game market at a significant clip. The console segment is expected to increase as a result of vital features like premium displays and sound systems, which are made to give players an enhanced and improved experience.
With a market share of around 64% in 2025, the offline sector dominated the video game market. However, during the projected period, the online category is anticipated to increase at a significant CAGR.
The increasing acceptance of multiplayer video games is responsible for the segment's expansion. Additionally, online games enable in-game communication and help to improve the entire gaming experience, which is encouraging for the video game market expansion.
Particularly effective in providing a virtual platform for online video games are social networking sites. Another factor that is anticipated to significantly contribute to the expansion of the online segment is the increased demand for interactive entertainment systems and the growing number of gamers who view online video games as their preferred form of entertainment.
With a revenue share of more than 55% in 2025, the Asia Pacific region dominated the video game market. The regional market was able to dominate the international industry due to China's rise as a significant gaming hub.
The growth of the regional market is being driven by China's unrelenting rise in smartphone adoption. Due to aggressively pursuing inorganic development tactics like the acquisition of Riot Games and Supercell Oy, Tencent Holdings Limited of China has become the leading participant in the global video game market.
Market players in Asia Pacific are launching systems that may enable gamers to access AAA games, due to the growing number of online gamers and the popularity of online gaming tournaments, making their substantial stand in the video game market share.
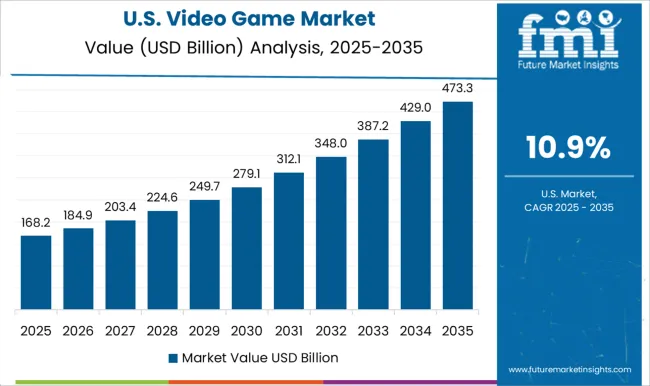
Game developers in America like Microsoft, Cave Digger, and many others have begun integrating AR/VR technologies into their games. The Nielsen Company reports that among gamers and the general public in the United States, awareness of AR/VR-specific gadgets climbed from 37% in 2020 to 63% in 2020.
North America’s video game market is anticipated to expand owing to the growing acceptance of virtual reality and mixed reality features by game development businesses. North America accounted for a market share of 41% in 2025.
Future development prospects for the video game market are very favorable. It is a significantly growing sector of the economy, and new players are entering the market to introduce innovations.
Among new video game market players, the 2020-founded Epik Prime collaborates with game creators to facilitate the release of in-game digital goods. It is supported by Nintendo and presently collaborates with over 250 businesses representing more than 1,000 video game brands.
Manticore Games, which was established in 2020 and is profitable enough, is the creator and owner of Core, a virtual playground. The Unreal Engine-based Core dubbed the "gateway to the multiverse," is home to what seems like an infinite number of games, ranging from first-person shooters to massively multiplayer online role-playing games and everything in between.
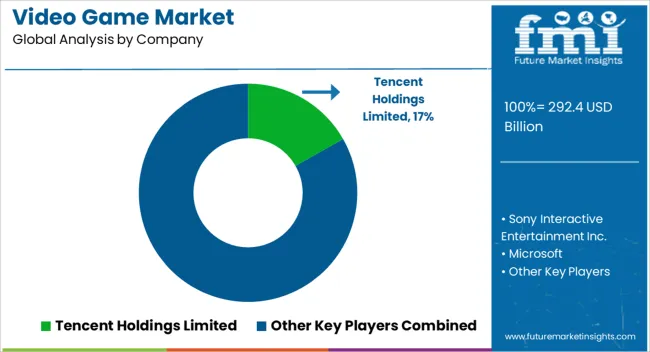
The video game market is fragmented as a result of the large number of well-established market rivals and new entrants. Businesses all across the world are concentrating on capacity growth and process innovation.
| Attributes | Details |
|---|---|
| Growth Rate | CAGR of 12.8% from 2025 to 2035 |
| Projected Market Size (2025) | USD 292.4 billion |
| Estimated Market Size (2035) | USD 977.4 billion |
| Base Year for Estimation | 2025 |
| Historical Data | 2020 to 2025 |
| Forecast Period | 2025 to 2035 |
| Quantitative Units | Revenue in USD million and CAGR from 2025 to 2035 |
| Report Coverage | Revenue Forecast, Volume Forecast, Company Ranking, Competitive Landscape, Growth Factors, Trends, and Pricing Analysis |
| Segments Covered | Product, End-use, Region |
| Regions Covered | North America; Latin America; Western Europe; Eastern Europe; South Asia & Pacific; East Asia; The Middle East & Africa (MEA) |
| Key Countries Profiled | The United States, Canada, Brazil, Mexico, Germany, The United Kingdom, France, Spain, Italy, Poland, Russia, Czech Republic, Romania, India, Bangladesh, Australia, New Zealand, China, Japan, South Korea, GCC Countries, South Africa, Israel |
| Key Companies Profiled | Activision Blizzard; Apple Inc.; Disney; Electronics Art Inc.; Lucid Games; Microsoft; Nintendo; Rovio Entertainment Corporation; Sony Interactive Entertainment Inc.; Tencent Holdings Limited |
| Customization | Available Upon Request |
The global video game market is estimated to be valued at USD 292.4 billion in 2025.
The market size for the video game market is projected to reach USD 977.4 billion by 2035.
The video game market is expected to grow at a 12.8% CAGR between 2025 and 2035.
The key product types in video game market are mobile, console and computer.
In terms of type, online segment to command 62.8% share in the video game market in 2025.


Full Research Suite comprises of:
Market outlook & trends analysis
Interviews & case studies
Strategic recommendations
Vendor profiles & capabilities analysis
5-year forecasts
8 regions and 60+ country-level data splits
Market segment data splits
12 months of continuous data updates
DELIVERED AS:
PDF EXCEL ONLINE
Video Processing Platform Market Size and Share Forecast Outlook 2025 to 2035
Video Test Equipment Market Size and Share Forecast Outlook 2025 to 2035
Video As A Sensor Market Size and Share Forecast Outlook 2025 to 2035
Video Encoders Market Size and Share Forecast Outlook 2025 to 2035
Video Conferencing Market Size and Share Forecast Outlook 2025 to 2035
Video Telematics Market Size and Share Forecast Outlook 2025 to 2035
Video Content Management Market Size and Share Forecast Outlook 2025 to 2035
Video Surveillance Market Growth - Trends & Industry Forecast 2025 to 2035
Video Analytics Market Growth - Trends & Forecast 2025 to 2035
Video Surveillance Storage Market Report - Growth & Demand 2025 to 2035
Video Doorbell Market by Product Type, End User, Sales Channel, and Region - Growth, Trends, and Forecast through 2035
Video Walls Market by Component, Display Technology, Industry, and Region - Growth, Trends, and Forecast Through 2025 to 2035
Video Streaming Market Growth – Innovations, Trends & Forecast 2025-2035
Video Intercom Device Market Analysis by Product, Technology, Vertical, and Region Through 2035
Video on Demand (VoD) Service Market - Trends & Forecast through 2034
AI-Powered Video Streaming – Future of Digital Entertainment
Video Encoder and Decoder Market
Video-Guided Pericardial Access Device Market
Video Converter Software Market
Video Management Software Market

Thank you!
You will receive an email from our Business Development Manager. Please be sure to check your SPAM/JUNK folder too.
Chat With
MaRIA