Reports

- Global Locations -

Headquarters

Future Market Insights, Inc.

Christiana Corporate, 200
Continental Drive, Suite 401,
Newark, Delaware - 19713,
United States

T: +1-347-918-3531

Americas

Future Market Insights, Inc.

616 Corporate Way, Suite 2-9018,
Valley Cottage, NY 10989, United States

MEA

Future Market Insights

1602-6 Jumeirah Bay X2 Tower, Plot No: JLT-PH2-X2A,
Jumeirah Lakes Towers, Dubai,
United Arab Emirates

Europe

Future Market Insights

3rd Floor, 207 Regent Street,
W1B 3HH London
United Kingdom

T: + 44 (0) 20 8123 9659

Asia Pacific

Future Market Insights

IndiaLand Global Tech Park, Unit UG-1, Behind Grand HighStreet, Phase 1, Hinjawadi, MH, Pune – 411057, India

Video Processing Platform Market Overview for 2024 to 2034

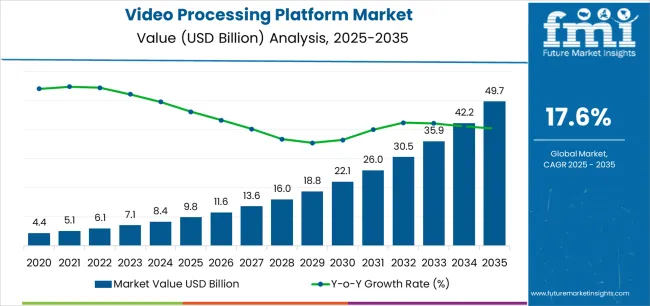
The global video processing platform market is expected to grow at a CAGR of 18.5% during the projected period. The market value is projected to increase from US$ 8.3 billion in 2024 to US$ 45.0 billion by 2034.

Video Processing Platform Market Size, Analysis, and Insights

  • The expansion of the media and entertainment industry is expected to drive the growth of the market in the coming years.
  • With the increasing popularity of video streaming services like Netflix, Amazon Prime, and others, the demand for high-quality video content has gained popularity.
  • As a result, an increase in the production of video content has created a need for advanced video processing platforms that can handle the high volume of data to provide high-quality video output.
  • With the rise of remote work and virtual meetings, video conferencing has become an essential tool for businesses to stay connected with their employees and clients. The adoption of video-based communication technologies is also driving growth in the market.
  • This has created a need for video processing platforms that can provide high-quality video and audio output, as well as advanced features such as screen sharing, recording, and virtual backgrounds.
  • The growing popularity of video content among consumers has contributed to the demand for video processing platforms.
  • With the rise of social media platforms like YouTube, Instagram, and TikTok, video content has become a powerful tool for individuals and businesses to engage with their audiences.
  • This has led to an increase in the production of user-generated video content, which requires advanced video processing platforms to edit and enhance the footage.
  • Surge in demand for advanced technologies such as video analytics platforms, GPU video processing, and edge video processing.
  • These technologies are enabling businesses to process and analyze large volumes of video data with good speed and accuracy.
  • The rising popularity of 4K video processing is also contributing to the market growth, as it allows for higher resolution and better visual quality in video content.
Attributes Details
Estimated Market Size, 2024 US$ 8.3 billion
Projected Market Size, 2034 US$ 45.0 billion
Value-based CAGR (2024 to 2034) 18.5%

Don't pay for what you don't need

Customize your report by selecting specific countries or regions and save 30%!

Key Opportunities in the Video Processing Platform Market

  • The potential for innovation and development is expected to create lucrative opportunities during the forecast period.
  • As the demand for video processing platforms continues to grow, there is a need for new and improved technologies that can handle the increasing number of data and provide better-quality video outputs.
  • This creates opportunities for startups and established businesses alike to develop and market new products and services.
  • With the potential for collaboration and partnerships with the wide range of applications for video processing platforms, companies can team up to offer more comprehensive solutions for their customers.
  • As video processing technologies become more advanced, companies can apply them in a variety of industries beyond entertainment, such as healthcare, education, and manufacturing which are expected to create significant opportunities in the market.
  • There is a need for new and improved technologies that can handle the data and provide better-quality video outputs. This creates opportunities for innovation, collaboration, and expansion into new markets.

Comparative View of Adjacent Markets

Aside from the video processing platform market, two additional markets have been studied in comparison to it. These markets are the video-on-demand service market and the video streaming software market.

Video Processing Platform Market:

Attributes Video Processing Platform Market
Value-based CAGR (2024 to 2034) 18.5%
Market Trends Expansion of the media and entertainment industry.
Growth Opportunities potential for innovation and development

Video On Demand Service Market:

Attributes Video On Demand Service Market
Value-based CAGR (2024 to 2034) 8.5%
Market Trends Increasing penetration of high-speed internet networks in emerging nations
Growth Opportunities Rising viewership of live-streaming programs

Video Streaming Software Market:

Attributes Video Streaming Software Market
Value-based CAGR (2024 to 2034) 10.2%
Market Trends Increasing original video content
Growth Opportunities Sporting events driving demand for live streaming software
Sudip Saha
Sudip Saha

Principal Consultant

Talk to Analyst

Find your sweet spots for generating winning opportunities in this market.

Category-wise Insights

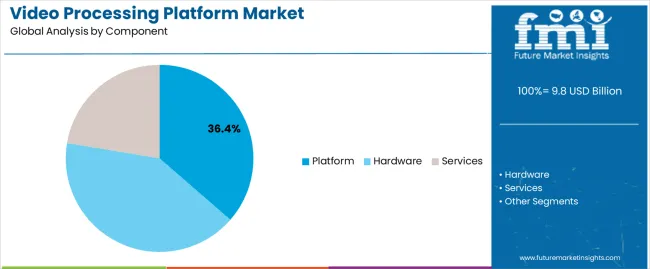
The Hardware Segment Dominates the Market by Component

Attributes Details
Top Component Hardware
CAGR from 2024 to 2034 18.3%
  • The increasing demand for high-quality video content and the need for faster video processing is driving the segment’s growth.
  • Hardware-based video processing platforms offer a higher processing speed and better performance than software-based platforms.
  • This is because hardware-based solutions are designed specifically for video processing tasks and are optimized for handling large amounts of data.
  • Hardware-based platforms are more reliable and efficient, which makes them ideal for use in mission-critical applications.

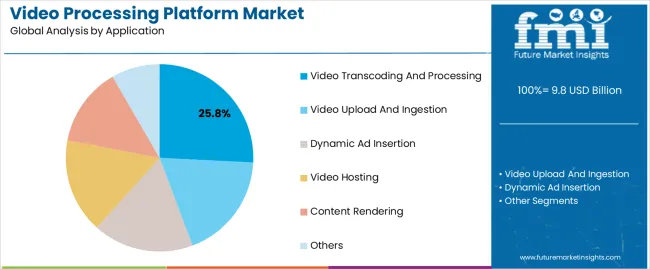
The Video Upload and Ingestion Segment Dominates the Market by Application

Attributes Details
Top Application Video Upload and Ingestion
CAGR from 2024 to 2034 18.1%
  • It is the first step in the video processing workflow.
  • This segment involves the transfer and storage of video content that is uploaded by users. As video content becomes more popular in various industries, the demand for video processing platforms increases.
  • The rise of user-generated content on social media has also contributed to the growth of this segment.
  • By offering a seamless and efficient video upload and ingestion process, video processing platforms can attract more users and retain them for longer periods.

Country-wise insights

Countries CAGR through 2024 to 2034
United States 18.7%
United Kingdom 19.6%
China 18.9%
Japan 19.0%
South Korea 19.4%

Growing Trend of Remote Work in the United States

  • The rise of online video consumption in the United States is expected to drive market growth.
  • With more and more people turning to the internet for entertainment and information, businesses need to create and distribute high-quality video content that can capture their attention.
  • This has led to an increase in demand for video processing platforms that can help companies create, edit, and distribute their video content efficiently.
  • The growing trend of remote work.
  • With many businesses transitioning to remote work due to the ongoing pandemic, video communication has become more important than ever.
  • Video processing platforms are essential tools for remote teams to collaborate and communicate effectively, as they enable team members to share and edit video content in real time.

Increasing Adoption of Video Processing Platforms in the United Kingdom

  • The proliferation of mobile devices and the widespread availability of high-speed internet have also contributed to the growth of the video processing platform market in the United Kingdom.
  • Consumers today expect seamless streaming experiences across all their devices, and this has created a need for video processing platforms that can handle high volumes of traffic and deliver content quickly and efficiently.
  • The increasing adoption of cloud-based video processing platforms has also contributed to the growth of the market.
  • With cloud-based platforms, businesses can easily scale their video processing capabilities up or down as needed without having to invest in expensive hardware or infrastructure.
  • Businesses are using video data to gain insights into customer behavior, preferences, and trends, and this has created a need for video processing platforms that can provide accurate and comprehensive analytics.
  • The growth of the gaming industry has also contributed to the demand for video processing platforms.
  • With the increasing popularity of online gaming, there is a need for video processing platforms that can deliver low-latency, high-quality video streams to gamers around the world.

Popularity of Online Video Content in China

  • The rapid growth of the country's economy has resulted in increased investments in technology and infrastructure.
  • As a result, there has been a significant increase in the demand for video processing platforms that can handle large volumes of data and provide efficient video processing services.
  • The growing popularity of online video content among consumers in China is driving the market forward.
  • With the rise of social media platforms and video-sharing websites, there has been an exponential increase in the number of videos being uploaded and viewed online.
  • This has created a major demand for video processing platforms that can handle large volumes of data and provide efficient video processing services.
  • The proliferation of smartphones and other mobile devices has also contributed to the growing demand for video processing platforms in China.
  • With the increasing availability of high-speed internet connectivity and affordable smartphones, more and more people are now consuming video content on their mobile devices.
  • This has created a huge demand for video processing platforms that can provide seamless video playback and streaming services on mobile devices.

Growing Use of Video-Based Communication Tools in Japan

  • With the increasing popularity of video streaming services such as Netflix and Amazon Prime, more people in Japan are consuming video content daily.
  • This has led to a growing demand for video processing platforms that can handle the large volume of video data being generated by these services.
  • The growing adoption of video-based communication tools in the workplace is stimulating the market’s progress.
  • With remote work becoming more common, many companies in Japan are turning to video conferencing and collaboration tools to stay connected with their employees.
  • This has created a need for robust video processing platforms that can handle the high-quality video and audio data required for these tools to function effectively.
  • The increasing popularity of virtual and augmented reality technologies in Japan has also contributed to the demand for video processing platforms.
  • With these technologies becoming more mainstream, there is a growing need for video processing platforms that can handle the large volume of data generated by virtual and augmented reality applications.

Rise of Virtual and Augmented Reality Technologies in South Korea

  • The increasing use of video content for marketing and advertising purposes in South Korea is driving the market.
  • Companies are recognizing the importance of using video as a tool for engaging with their audience and promoting their products or services.
  • This has led to a need for video processing platforms that can help companies create high-quality videos that can be used for marketing purposes.
  • The rise of virtual and augmented reality technologies has also contributed to the growth of the video processing platform market in South Korea.
  • These technologies require powerful video processing platforms to create immersive experiences for users.
  • As a result, there has been an increase in demand for video-processing platforms that can support these emerging technologies.

Get the data you need at a Fraction of the cost

Personalize your report by choosing insights you need
and save 40%!

Competitive Landscape

The market is constantly evolving as new players enter it and existing players innovate to stay ahead. Companies offer unique capabilities and features that cater to different customer needs. Additionally, many smaller companies and start-ups are also making a name for themselves in this space. As the demand for video processing platforms continues to grow, more players are expected to enter the market and further drive innovation.

Recent Development

In 2021, MediaKind unveiled a new solution called MediaKind Engage, which provides end-to-end direct-to-consumer (DTC) services for video contribution, production, streaming, and audience engagement. This solution facilitates a seamless transition to cloud-based workflows for sports entities, broadcasters, and content owners. By leveraging this solution, they can expand the reach, scalability, and dependability of their video streaming content, thereby catering to a global audience.
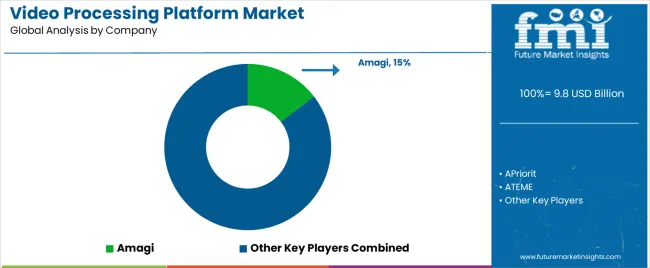
Key Market Players

  • Amagi
  • APriorit
  • ATEME
  • Base Media Cloud
  • Beamr
  • BlazeClan Technologies
  • IMagine Communications
  • InPixal
  • JW Player
  • Kaltura
  • Kamai
  • Lightcast.com
  • MediaKind
  • MediaMelon
  • M2A Media
  • Mux
  • NVIDIA
  • Pixel Power
  • Qumu
  • SeaChange
  • SSIMWAVE
  • Synamedia
  • Vantrix

Key Market Segmentation

By Component:

  • Hardware
  • Platform
  • Services

By Application:

  • Video Upload and Ingestion
  • Dynamic Ad Insertion
  • Video Transcoding and Processing
  • Video Hosting
  • Content Rendering
  • Others

By Content Type:

  • Real-Time/Live
  • On-Demand
  • Iron Ore Mining
  • Precious Metals & Rare Earth Minerals Mining
  • Industrial Mineral Mining
  • Others

By End User:

  • TV Broadcasters
  • Network Operators
  • Content Providers

By Verticals:

  • BFSI
  • Manufacturing
  • Healthcare and Lifesciences
  • IT and Telecommunications
  • Government
  • Education
  • Retail and Consumer Goods
  • Media and Entertainment
  • Others

By Region:

  • North America
  • Latin America
  • East Asia
  • South Asia
  • Europe
  • Oceania
  • MEA

Frequently Asked Questions

How Big is the Video Processing Platform Market in 2024?

The market is currently valued at around US$ 8.3 billion in 2024.

What is the China’s Market Outlook?

The market in China is expected to progress at a CAGR of 18.9% through the forecast period.

Which Component Demand is Expected to Rise Rapidly in the Market?

Within the component segment, the hardware segment is expected to register an 18.3% CAGR through 2034.

What is the United States Market Outlook?

The United States is expected to grow at an 18.7% CAGR from 2024 to 2034.

What is the Projected Market Value by 2034?

The market is set to reach a valuation of around US$ 45.0 billion by the end of 2034.

What Was the Historical CAGR for the Market?

The demand for video processing platforms increased at a 22.0% CAGR from 2019 to 2023.

Table of Content

1. Executive Summary

    1.1. Global Market Outlook

    1.2. Demand-side Trends

    1.3. Supply-side Trends

    1.4. Technology Roadmap Analysis

    1.5. Analysis and Recommendations

2. Market Overview

    2.1. Market Coverage / Taxonomy

    2.2. Market Definition / Scope / Limitations

3. Market Background

    3.1. Market Dynamics

        3.1.1. Drivers

        3.1.2. Restraints

        3.1.3. Opportunity

        3.1.4. Trends

    3.2. Scenario Forecast

        3.2.1. Demand in Optimistic Scenario

        3.2.2. Demand in Likely Scenario

        3.2.3. Demand in Conservative Scenario

    3.3. Opportunity Map Analysis

    3.4. Investment Feasibility Matrix

    3.5. PESTLE and Porter’s Analysis

    3.6. Regulatory Landscape

        3.6.1. By Key Regions

        3.6.2. By Key Countries

    3.7. Regional Parent Market Outlook

4. Global Market Analysis 2019 to 2023 and Forecast, 2024 to 2034

    4.1. Historical Market Size Value (US$ Million) Analysis, 2019 to 2023

    4.2. Current and Future Market Size Value (US$ Million) Projections, 2024 to 2034

        4.2.1. Y-o-Y Growth Trend Analysis

        4.2.2. Absolute $ Opportunity Analysis

5. Global Market Analysis 2019 to 2023 and Forecast 2024 to 2034, By Component

    5.1. Introduction / Key Findings

    5.2. Historical Market Size Value (US$ Million) Analysis By Component, 2019 to 2023

    5.3. Current and Future Market Size Value (US$ Million) Analysis and Forecast By Component, 2024 to 2034

        5.3.1. Hardware

        5.3.2. Platform

        5.3.3. Services

    5.4. Y-o-Y Growth Trend Analysis By Component, 2019 to 2023

    5.5. Absolute $ Opportunity Analysis By Component, 2024 to 2034

6. Global Market Analysis 2019 to 2023 and Forecast 2024 to 2034, By Application

    6.1. Introduction / Key Findings

    6.2. Historical Market Size Value (US$ Million) Analysis By Application, 2019 to 2023

    6.3. Current and Future Market Size Value (US$ Million) Analysis and Forecast By Application, 2024 to 2034

        6.3.1. Video Upload and Ingestion

        6.3.2. Dynamic Ad Insertion

        6.3.3. Video Transcoding and Processing

        6.3.4. Video Hosting

        6.3.5. Content Rendering

        6.3.6. Others

    6.4. Y-o-Y Growth Trend Analysis By Application, 2019 to 2023

    6.5. Absolute $ Opportunity Analysis By Application, 2024 to 2034

7. Global Market Analysis 2019 to 2023 and Forecast 2024 to 2034, By Content Type

    7.1. Introduction / Key Findings

    7.2. Historical Market Size Value (US$ Million) Analysis By Content Type, 2019 to 2023

    7.3. Current and Future Market Size Value (US$ Million) Analysis and Forecast By Content Type, 2024 to 2034

        7.3.1. Real-Time/Live

        7.3.2. On-Demand

    7.4. Y-o-Y Growth Trend Analysis By Content Type, 2019 to 2023

    7.5. Absolute $ Opportunity Analysis By Content Type, 2024 to 2034

8. Global Market Analysis 2019 to 2023 and Forecast 2024 to 2034, By End User

    8.1. Introduction / Key Findings

    8.2. Historical Market Size Value (US$ Million) Analysis By End User, 2019 to 2023

    8.3. Current and Future Market Size Value (US$ Million) Analysis and Forecast By End User, 2024 to 2034

        8.3.1. TV Broadcasters

        8.3.2. Network Operators

        8.3.3. Content Providers

    8.4. Y-o-Y Growth Trend Analysis By End User, 2019 to 2023

    8.5. Absolute $ Opportunity Analysis By End User, 2024 to 2034

9. Global Market Analysis 2019 to 2023 and Forecast 2024 to 2034, By verticals

    9.1. Introduction / Key Findings

    9.2. Historical Market Size Value (US$ Million) Analysis By verticals, 2019 to 2023

    9.3. Current and Future Market Size Value (US$ Million) Analysis and Forecast By verticals, 2024 to 2034

        9.3.1. BFSI

        9.3.2. Manufacturing

        9.3.3. Healthcare and Lifesciences

        9.3.4. IT and Telecommunications

        9.3.5. Government

        9.3.6. Education

        9.3.7. Retail and Consumer Goods

        9.3.8. Media and Entertainment

        9.3.9. Others

    9.4. Y-o-Y Growth Trend Analysis By verticals, 2019 to 2023

    9.5. Absolute $ Opportunity Analysis By verticals, 2024 to 2034

10. Global Market Analysis 2019 to 2023 and Forecast 2024 to 2034, By Region

    10.1. Introduction

    10.2. Historical Market Size Value (US$ Million) Analysis By Region, 2019 to 2023

    10.3. Current Market Size Value (US$ Million) Analysis and Forecast By Region, 2024 to 2034

        10.3.1. North America

        10.3.2. Latin America

        10.3.3. Western Europe

        10.3.4. Eastern Europe

        10.3.5. South Asia and Pacific

        10.3.6. East Asia

        10.3.7. Middle East and Africa

    10.4. Market Attractiveness Analysis By Region

11. North America Market Analysis 2019 to 2023 and Forecast 2024 to 2034, By Country

    11.1. Historical Market Size Value (US$ Million) Trend Analysis By Market Taxonomy, 2019 to 2023

    11.2. Market Size Value (US$ Million) Forecast By Market Taxonomy, 2024 to 2034

        11.2.1. By Country

            11.2.1.1. USA

            11.2.1.2. Canada

        11.2.2. By Component

        11.2.3. By Application

        11.2.4. By Content Type

        11.2.5. By End User

        11.2.6. By verticals

    11.3. Market Attractiveness Analysis

        11.3.1. By Country

        11.3.2. By Component

        11.3.3. By Application

        11.3.4. By Content Type

        11.3.5. By End User

        11.3.6. By verticals

    11.4. Key Takeaways

12. Latin America Market Analysis 2019 to 2023 and Forecast 2024 to 2034, By Country

    12.1. Historical Market Size Value (US$ Million) Trend Analysis By Market Taxonomy, 2019 to 2023

    12.2. Market Size Value (US$ Million) Forecast By Market Taxonomy, 2024 to 2034

        12.2.1. By Country

            12.2.1.1. Brazil

            12.2.1.2. Mexico

            12.2.1.3. Rest of Latin America

        12.2.2. By Component

        12.2.3. By Application

        12.2.4. By Content Type

        12.2.5. By End User

        12.2.6. By verticals

    12.3. Market Attractiveness Analysis

        12.3.1. By Country

        12.3.2. By Component

        12.3.3. By Application

        12.3.4. By Content Type

        12.3.5. By End User

        12.3.6. By verticals

    12.4. Key Takeaways

13. Western Europe Market Analysis 2019 to 2023 and Forecast 2024 to 2034, By Country

    13.1. Historical Market Size Value (US$ Million) Trend Analysis By Market Taxonomy, 2019 to 2023

    13.2. Market Size Value (US$ Million) Forecast By Market Taxonomy, 2024 to 2034

        13.2.1. By Country

            13.2.1.1. Germany

            13.2.1.2. UK

            13.2.1.3. France

            13.2.1.4. Spain

            13.2.1.5. Italy

            13.2.1.6. Rest of Western Europe

        13.2.2. By Component

        13.2.3. By Application

        13.2.4. By Content Type

        13.2.5. By End User

        13.2.6. By verticals

    13.3. Market Attractiveness Analysis

        13.3.1. By Country

        13.3.2. By Component

        13.3.3. By Application

        13.3.4. By Content Type

        13.3.5. By End User

        13.3.6. By verticals

    13.4. Key Takeaways

14. Eastern Europe Market Analysis 2019 to 2023 and Forecast 2024 to 2034, By Country

    14.1. Historical Market Size Value (US$ Million) Trend Analysis By Market Taxonomy, 2019 to 2023

    14.2. Market Size Value (US$ Million) Forecast By Market Taxonomy, 2024 to 2034

        14.2.1. By Country

            14.2.1.1. Poland

            14.2.1.2. Russia

            14.2.1.3. Czech Republic

            14.2.1.4. Romania

            14.2.1.5. Rest of Eastern Europe

        14.2.2. By Component

        14.2.3. By Application

        14.2.4. By Content Type

        14.2.5. By End User

        14.2.6. By verticals

    14.3. Market Attractiveness Analysis

        14.3.1. By Country

        14.3.2. By Component

        14.3.3. By Application

        14.3.4. By Content Type

        14.3.5. By End User

        14.3.6. By verticals

    14.4. Key Takeaways

15. South Asia and Pacific Market Analysis 2019 to 2023 and Forecast 2024 to 2034, By Country

    15.1. Historical Market Size Value (US$ Million) Trend Analysis By Market Taxonomy, 2019 to 2023

    15.2. Market Size Value (US$ Million) Forecast By Market Taxonomy, 2024 to 2034

        15.2.1. By Country

            15.2.1.1. India

            15.2.1.2. Bangladesh

            15.2.1.3. Australia

            15.2.1.4. New Zealand

            15.2.1.5. Rest of South Asia and Pacific

        15.2.2. By Component

        15.2.3. By Application

        15.2.4. By Content Type

        15.2.5. By End User

        15.2.6. By verticals

    15.3. Market Attractiveness Analysis

        15.3.1. By Country

        15.3.2. By Component

        15.3.3. By Application

        15.3.4. By Content Type

        15.3.5. By End User

        15.3.6. By verticals

    15.4. Key Takeaways

16. East Asia Market Analysis 2019 to 2023 and Forecast 2024 to 2034, By Country

    16.1. Historical Market Size Value (US$ Million) Trend Analysis By Market Taxonomy, 2019 to 2023

    16.2. Market Size Value (US$ Million) Forecast By Market Taxonomy, 2024 to 2034

        16.2.1. By Country

            16.2.1.1. China

            16.2.1.2. Japan

            16.2.1.3. South Korea

        16.2.2. By Component

        16.2.3. By Application

        16.2.4. By Content Type

        16.2.5. By End User

        16.2.6. By verticals

    16.3. Market Attractiveness Analysis

        16.3.1. By Country

        16.3.2. By Component

        16.3.3. By Application

        16.3.4. By Content Type

        16.3.5. By End User

        16.3.6. By verticals

    16.4. Key Takeaways

17. Middle East and Africa Market Analysis 2019 to 2023 and Forecast 2024 to 2034, By Country

    17.1. Historical Market Size Value (US$ Million) Trend Analysis By Market Taxonomy, 2019 to 2023

    17.2. Market Size Value (US$ Million) Forecast By Market Taxonomy, 2024 to 2034

        17.2.1. By Country

            17.2.1.1. GCC Countries

            17.2.1.2. South Africa

            17.2.1.3. Israel

            17.2.1.4. Rest of MEA

        17.2.2. By Component

        17.2.3. By Application

        17.2.4. By Content Type

        17.2.5. By End User

        17.2.6. By verticals

    17.3. Market Attractiveness Analysis

        17.3.1. By Country

        17.3.2. By Component

        17.3.3. By Application

        17.3.4. By Content Type

        17.3.5. By End User

        17.3.6. By verticals

    17.4. Key Takeaways

18. Key Countries Market Analysis

    18.1. USA

        18.1.1. Pricing Analysis

        18.1.2. Market Share Analysis, 2023

            18.1.2.1. By Component

            18.1.2.2. By Application

            18.1.2.3. By Content Type

            18.1.2.4. By End User

            18.1.2.5. By verticals

    18.2. Canada

        18.2.1. Pricing Analysis

        18.2.2. Market Share Analysis, 2023

            18.2.2.1. By Component

            18.2.2.2. By Application

            18.2.2.3. By Content Type

            18.2.2.4. By End User

            18.2.2.5. By verticals

    18.3. Brazil

        18.3.1. Pricing Analysis

        18.3.2. Market Share Analysis, 2023

            18.3.2.1. By Component

            18.3.2.2. By Application

            18.3.2.3. By Content Type

            18.3.2.4. By End User

            18.3.2.5. By verticals

    18.4. Mexico

        18.4.1. Pricing Analysis

        18.4.2. Market Share Analysis, 2023

            18.4.2.1. By Component

            18.4.2.2. By Application

            18.4.2.3. By Content Type

            18.4.2.4. By End User

            18.4.2.5. By verticals

    18.5. Germany

        18.5.1. Pricing Analysis

        18.5.2. Market Share Analysis, 2023

            18.5.2.1. By Component

            18.5.2.2. By Application

            18.5.2.3. By Content Type

            18.5.2.4. By End User

            18.5.2.5. By verticals

    18.6. UK

        18.6.1. Pricing Analysis

        18.6.2. Market Share Analysis, 2023

            18.6.2.1. By Component

            18.6.2.2. By Application

            18.6.2.3. By Content Type

            18.6.2.4. By End User

            18.6.2.5. By verticals

    18.7. France

        18.7.1. Pricing Analysis

        18.7.2. Market Share Analysis, 2023

            18.7.2.1. By Component

            18.7.2.2. By Application

            18.7.2.3. By Content Type

            18.7.2.4. By End User

            18.7.2.5. By verticals

    18.8. Spain

        18.8.1. Pricing Analysis

        18.8.2. Market Share Analysis, 2023

            18.8.2.1. By Component

            18.8.2.2. By Application

            18.8.2.3. By Content Type

            18.8.2.4. By End User

            18.8.2.5. By verticals

    18.9. Italy

        18.9.1. Pricing Analysis

        18.9.2. Market Share Analysis, 2023

            18.9.2.1. By Component

            18.9.2.2. By Application

            18.9.2.3. By Content Type

            18.9.2.4. By End User

            18.9.2.5. By verticals

    18.10. Poland

        18.10.1. Pricing Analysis

        18.10.2. Market Share Analysis, 2023

            18.10.2.1. By Component

            18.10.2.2. By Application

            18.10.2.3. By Content Type

            18.10.2.4. By End User

            18.10.2.5. By verticals

    18.11. Russia

        18.11.1. Pricing Analysis

        18.11.2. Market Share Analysis, 2023

            18.11.2.1. By Component

            18.11.2.2. By Application

            18.11.2.3. By Content Type

            18.11.2.4. By End User

            18.11.2.5. By verticals

    18.12. Czech Republic

        18.12.1. Pricing Analysis

        18.12.2. Market Share Analysis, 2023

            18.12.2.1. By Component

            18.12.2.2. By Application

            18.12.2.3. By Content Type

            18.12.2.4. By End User

            18.12.2.5. By verticals

    18.13. Romania

        18.13.1. Pricing Analysis

        18.13.2. Market Share Analysis, 2023

            18.13.2.1. By Component

            18.13.2.2. By Application

            18.13.2.3. By Content Type

            18.13.2.4. By End User

            18.13.2.5. By verticals

    18.14. India

        18.14.1. Pricing Analysis

        18.14.2. Market Share Analysis, 2023

            18.14.2.1. By Component

            18.14.2.2. By Application

            18.14.2.3. By Content Type

            18.14.2.4. By End User

            18.14.2.5. By verticals

    18.15. Bangladesh

        18.15.1. Pricing Analysis

        18.15.2. Market Share Analysis, 2023

            18.15.2.1. By Component

            18.15.2.2. By Application

            18.15.2.3. By Content Type

            18.15.2.4. By End User

            18.15.2.5. By verticals

    18.16. Australia

        18.16.1. Pricing Analysis

        18.16.2. Market Share Analysis, 2023

            18.16.2.1. By Component

            18.16.2.2. By Application

            18.16.2.3. By Content Type

            18.16.2.4. By End User

            18.16.2.5. By verticals

    18.17. New Zealand

        18.17.1. Pricing Analysis

        18.17.2. Market Share Analysis, 2023

            18.17.2.1. By Component

            18.17.2.2. By Application

            18.17.2.3. By Content Type

            18.17.2.4. By End User

            18.17.2.5. By verticals

    18.18. China

        18.18.1. Pricing Analysis

        18.18.2. Market Share Analysis, 2023

            18.18.2.1. By Component

            18.18.2.2. By Application

            18.18.2.3. By Content Type

            18.18.2.4. By End User

            18.18.2.5. By verticals

    18.19. Japan

        18.19.1. Pricing Analysis

        18.19.2. Market Share Analysis, 2023

            18.19.2.1. By Component

            18.19.2.2. By Application

            18.19.2.3. By Content Type

            18.19.2.4. By End User

            18.19.2.5. By verticals

    18.20. South Korea

        18.20.1. Pricing Analysis

        18.20.2. Market Share Analysis, 2023

            18.20.2.1. By Component

            18.20.2.2. By Application

            18.20.2.3. By Content Type

            18.20.2.4. By End User

            18.20.2.5. By verticals

    18.21. GCC Countries

        18.21.1. Pricing Analysis

        18.21.2. Market Share Analysis, 2023

            18.21.2.1. By Component

            18.21.2.2. By Application

            18.21.2.3. By Content Type

            18.21.2.4. By End User

            18.21.2.5. By verticals

    18.22. South Africa

        18.22.1. Pricing Analysis

        18.22.2. Market Share Analysis, 2023

            18.22.2.1. By Component

            18.22.2.2. By Application

            18.22.2.3. By Content Type

            18.22.2.4. By End User

            18.22.2.5. By verticals

    18.23. Israel

        18.23.1. Pricing Analysis

        18.23.2. Market Share Analysis, 2023

            18.23.2.1. By Component

            18.23.2.2. By Application

            18.23.2.3. By Content Type

            18.23.2.4. By End User

            18.23.2.5. By verticals

19. Market Structure Analysis

    19.1. Competition Dashboard

    19.2. Competition Benchmarking

    19.3. Market Share Analysis of Top Players

        19.3.1. By Regional

        19.3.2. By Component

        19.3.3. By Application

        19.3.4. By Content Type

        19.3.5. By End User

        19.3.6. By verticals

20. Competition Analysis

    20.1. Competition Deep Dive

        20.1.1. Akamai

            20.1.1.1. Overview

            20.1.1.2. Product Portfolio

            20.1.1.3. Profitability by Market Segments

            20.1.1.4. Sales Footprint

            20.1.1.5. Strategy Overview

                20.1.1.5.1. Marketing Strategy

        20.1.2. Imagine Communications

            20.1.2.1. Overview

            20.1.2.2. Product Portfolio

            20.1.2.3. Profitability by Market Segments

            20.1.2.4. Sales Footprint

            20.1.2.5. Strategy Overview

                20.1.2.5.1. Marketing Strategy

        20.1.3. MediaKind

            20.1.3.1. Overview

            20.1.3.2. Product Portfolio

            20.1.3.3. Profitability by Market Segments

            20.1.3.4. Sales Footprint

            20.1.3.5. Strategy Overview

                20.1.3.5.1. Marketing Strategy

        20.1.4. Kaltura

            20.1.4.1. Overview

            20.1.4.2. Product Portfolio

            20.1.4.3. Profitability by Market Segments

            20.1.4.4. Sales Footprint

            20.1.4.5. Strategy Overview

                20.1.4.5.1. Marketing Strategy

        20.1.5. ATEME

            20.1.5.1. Overview

            20.1.5.2. Product Portfolio

            20.1.5.3. Profitability by Market Segments

            20.1.5.4. Sales Footprint

            20.1.5.5. Strategy Overview

                20.1.5.5.1. Marketing Strategy

        20.1.6. Synamedia

            20.1.6.1. Overview

            20.1.6.2. Product Portfolio

            20.1.6.3. Profitability by Market Segments

            20.1.6.4. Sales Footprint

            20.1.6.5. Strategy Overview

                20.1.6.5.1. Marketing Strategy

        20.1.7. SeaChange

            20.1.7.1. Overview

            20.1.7.2. Product Portfolio

            20.1.7.3. Profitability by Market Segments

            20.1.7.4. Sales Footprint

            20.1.7.5. Strategy Overview

                20.1.7.5.1. Marketing Strategy

        20.1.8. Vantrix

            20.1.8.1. Overview

            20.1.8.2. Product Portfolio

            20.1.8.3. Profitability by Market Segments

            20.1.8.4. Sales Footprint

            20.1.8.5. Strategy Overview

                20.1.8.5.1. Marketing Strategy

        20.1.9. NVIDIA

            20.1.9.1. Overview

            20.1.9.2. Product Portfolio

            20.1.9.3. Profitability by Market Segments

            20.1.9.4. Sales Footprint

            20.1.9.5. Strategy Overview

                20.1.9.5.1. Marketing Strategy

        20.1.10. Pixel Power

            20.1.10.1. Overview

            20.1.10.2. Product Portfolio

            20.1.10.3. Profitability by Market Segments

            20.1.10.4. Sales Footprint

            20.1.10.5. Strategy Overview

                20.1.10.5.1. Marketing Strategy

        20.1.11. Qumu

            20.1.11.1. Overview

            20.1.11.2. Product Portfolio

            20.1.11.3. Profitability by Market Segments

            20.1.11.4. Sales Footprint

            20.1.11.5. Strategy Overview

                20.1.11.5.1. Marketing Strategy

21. Assumptions & Acronyms Used

22. Research Methodology

Recommendations

Technology

Video Streaming Market

Published : January 2024

Technology

Video on Demand (VOD) Service Market

Published : March 2021

Explore Technology Insights

View Reports

Video Processing Platform Market