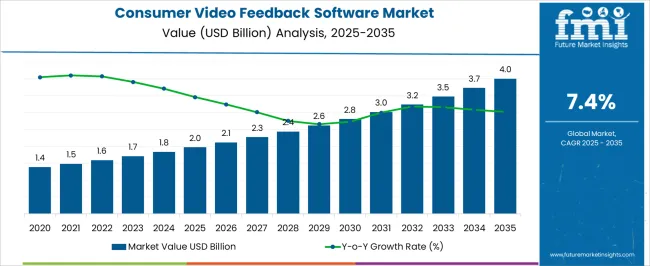
The Consumer Video Feedback Software Market is estimated to be valued at USD 2.0 billion in 2025 and is projected to reach USD 4.0 billion by 2035, registering a compound annual growth rate (CAGR) of 7.4% over the forecast period.
| Metric | Value |
|---|---|
| Consumer Video Feedback Software Market Estimated Value in (2025 E) | USD 2.0 billion |
| Consumer Video Feedback Software Market Forecast Value in (2035 F) | USD 4.0 billion |
| Forecast CAGR (2025 to 2035) | 7.4% |
The consumer video feedback software market is gaining traction as enterprises increasingly prioritize real-time customer insights and visual engagement tools to refine product and service strategies. Industry updates and company press releases have underscored the growing role of video-based feedback in capturing authentic consumer sentiment, surpassing traditional survey formats in depth and accuracy. Organizations are leveraging these platforms to enhance decision-making, reduce product development cycles, and strengthen customer experience initiatives.
Cloud-based deployment has accelerated adoption, offering scalability, remote accessibility, and lower infrastructure costs. Furthermore, data privacy regulations and AI-driven analytics integration have reinforced trust and utility in these solutions.
Sector-specific demand has been rising, with fast-moving consumer goods (FMCG) companies utilizing video insights to optimize branding strategies, while financial institutions increasingly apply them to improve service delivery and client communication. Looking ahead, technological enhancements such as machine learning-based sentiment analysis, multilingual feedback processing, and seamless integration with CRM systems are expected to broaden adoption across industries, driving sustained market growth.
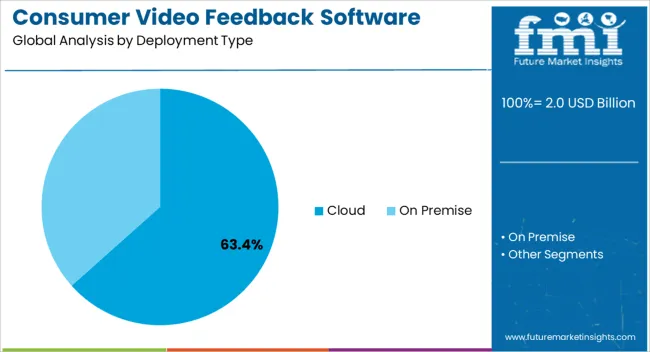
The Cloud segment is projected to account for 63.40% of the consumer video feedback software market revenue in 2025, sustaining its position as the dominant deployment model. Growth has been driven by the advantages of flexible storage, scalability, and remote accessibility, which align with the operational needs of modern enterprises. Organizations have adopted cloud deployment to reduce capital expenditure on IT infrastructure while ensuring seamless updates and maintenance by service providers.
Furthermore, the cloud model facilitates rapid deployment across geographically dispersed teams, enhancing collaboration and feedback integration. Reports from technology providers and enterprise IT departments have highlighted that cloud-based platforms are preferred for their compatibility with other digital tools such as analytics dashboards and customer relationship management systems.
The increasing focus on hybrid and remote work models has further amplified reliance on cloud-based solutions, ensuring that the segment continues to dominate the market.
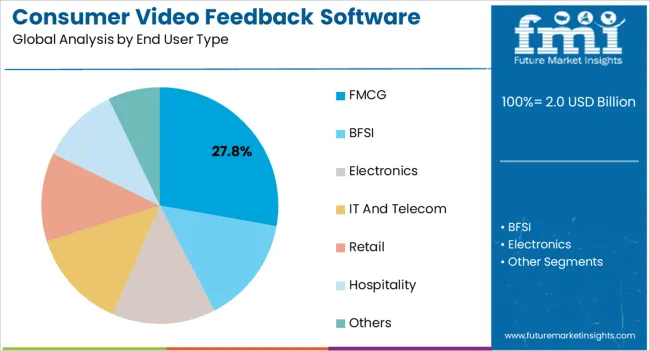
The FMCG segment is projected to contribute 27.80% of the consumer video feedback software market revenue in 2025, emerging as the leading industry user. This leadership has been shaped by the FMCG sector’s need for rapid consumer insights to optimize product launches, packaging innovations, and brand messaging. Video feedback platforms have enabled FMCG firms to capture nuanced consumer reactions, supporting agile product development and market responsiveness.
Investor briefings and marketing case studies have emphasized that FMCG companies are increasingly integrating video-based feedback into brand engagement campaigns to better align with evolving consumer preferences.
Additionally, the highly competitive nature of the FMCG industry has underscored the importance of real-time, actionable insights, making video feedback tools a critical component of strategic decision-making. With consumer demands shifting quickly, the FMCG segment is expected to remain at the forefront of adoption, leveraging video feedback to drive both innovation and brand loyalty.
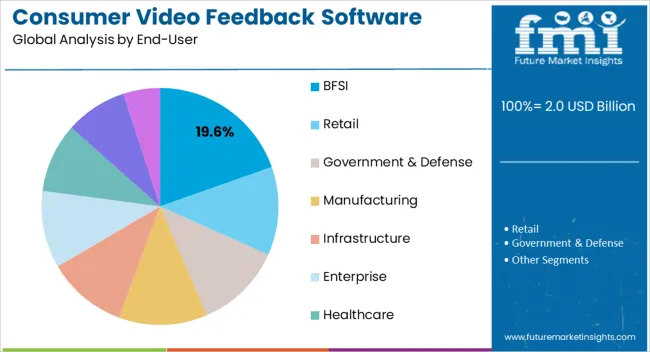
The BFSI segment is projected to hold 19.60% of the consumer video feedback software market revenue in 2025, reflecting its rising importance as a key adopter. Growth in this segment has been driven by the sector’s emphasis on enhancing customer trust, service delivery, and digital experience. Video feedback tools have been increasingly implemented to gather detailed insights into customer satisfaction regarding banking services, insurance claims, and financial product interactions.
Financial institutions have utilized these platforms to address pain points in customer journeys, particularly as digital banking adoption accelerates. Industry reports and institutional announcements have underscored the role of video-based feedback in compliance monitoring and improving frontline service training.
Additionally, BFSI firms have adopted these tools to differentiate in highly competitive markets by offering personalized, consumer-centric services. With regulatory focus on transparency and consumer protection, the BFSI segment is expected to expand its adoption of video feedback solutions, contributing steadily to overall market growth.
As per the Consumer Video Feedback Software Market research by Future Market Insights - a market research and competitive intelligence provider, historically, from 2020 to 2025, the market value of the Consumer Video Feedback Software Market increased at around 5.6% CAGR.
Enterprises can use consumer video feedback software to capture, analyze, and distribute video comments from customers. This program assists organizations in conducting research or soliciting feedback from their customers in an effective manner, allowing them to gain rich insights from all types of video feedback that text-based feedback cannot do.
Researchers, advertisers, marketing teams, and product managers can use this software to collect qualitative, actionable data to make informed business decisions about marketing campaigns, product design, brand strategy, customer experience, and in-store innovation.
With businesses increasingly recognizing the impact that video can have on customer and employee experience programs, consumer video feedback software adoption is on the rise.
Consumer video feedback software provides quick access to the resources needed to capture and record a customer's ideas, views, and feelings, allowing businesses to better understand their consumers' needs.
Furthermore, organizations can use artificial intelligence technologies like machine learning to produce data sets that motivate action and drive effect more regularly. The video feedback allows businesses to hear their clients' true voices and make better business decisions more swiftly.
Factors such as the increasing popularity of complex operations, rising automation trends, high operational costs, and increased implementation of modern software solutions at large enterprises are among the primary reasons why the demand for consumer video feedback services in-field is expected to grow over the next few years.
In addition, the consumer video feedback software market is expected to grow in the coming years due to increased digital transformation to improve operations and process security in businesses.
In the coming years, the growing popularity of cloud-based solutions and services is expected to strengthen and provide opportunities for the consumer video feedback industry.
The consumer video feedback software industry is seeing potential from partnerships, collaborations, and new product introductions. However, throughout the projected years, consumer video feedback software adoption is expected to be hampered by a lack of knowledge and a scarcity of qualified people to handle advanced solutions at a low cost and high productivity.
Research activities and tools, such as consumer video feedback software, are highly valued by organizations from numerous verticals. To improve consumer experience and product offerings, many industries, including retail, telecom, hotel, FMCG, and media, are implementing advanced data collecting and analytics techniques.
ExterionMedia, a marketing agency, was recently awarded a £1 billion ad deal for the London Underground Rail Estate. ExterionMedia chose consumer video feedback solutions over traditional feedback tools or methodologies to collect primary data from commuters. Commuters were able to provide comments on their own terms as a result of the method.
ExterionMedia was able to readily grasp commuters' perspectives and deploy full-motion commercials that were compelled by employing consumer video feedback technologies. Furthermore, Asda Stores Ltd, one of Europe's largest retail chains, began collecting primary data from their survey of 18 million customers utilizing consumer feedback software.
Asda Stores Ltd. was able to identify customer issues and assess their emotions utilizing a consumer feedback software tool, which was not possible with traditional text-based data collection technologies.
In addition, a growing number of end-to-end technology providers and startups are investing in data collection and analytics solutions to improve their offerings. They use video comments from customers as a marketing tool to boost their company's reputation.
In addition, as a result of COVID-19, the adoption of consumer video feedback software increased across the European market. Various solutions, including consumer video feedback software, are being used by businesses to better understand customer behavior and improve their experience during the pandemic.
Meanwhile, the high internet penetration rate, together with government initiatives such as the European Digital Strategy, are among the factors driving consumer video feedback software demand in Europe.
During the forecast period, North America is expected to be the top revenue-generating region in the global consumer video feedback software market, with the United States leading the way, followed by Canada.
Consumer research initiatives have been substantially spent in these countries, which is leading to the adoption of consumer video feedback software. Furthermore, the region has been responsive in terms of incorporating the most recent technology breakthroughs, such as mobile and cloud integration technologies with consumer video feedback software solutions.
North America is also known for its high GPD per capita, positive attitude toward mass adoption of new technologies, and dynamic consumer behavior, as a result of which companies in various industries are strongly inclined to invest resources in gathering insightful data for product development in order to address changing consumer preferences.
Furthermore, due to favorable government policies that promote innovation and build infrastructure capacities, North America is one of the leading regions in terms of the creation and acceptance of new technology. As a result, any impediment to the growth of the industrial sector impedes the region's economic development.
According to the real estate firm CoStar Group, up to 12,000 stores in the United States would be temporarily closed in 2024. J.C. Penney and GameStop were two of the key retail chains that announced store closures in 2024.
In the hospitality industry, a similar trend was observed. Enterprises that planned to adopt consumer video feedback software in 2024 had to either postpone or abandon their plans, resulting in a positive influence on demand for the software.
The United States is expected to account for the highest market of USD 4 billion by the end of 2035. Customers' real-time input is collected via consumer video feedback software, which is mostly utilized as research and survey software.
Instead of text-based, quantitative feedback, this system concentrates solely on data collection and management, as well as video insights analysis. Customers can offer genuine, off-the-cuff answers to open-ended inquiries, allowing them to contextualize and emotionally interact with qualitative insights owing to the growing acceptance of advanced cloud-based video feedback.
Cloud segment is forecasted to thrive at the highest CAGR of over 8.3% from 2025 to 2035. In recent years, cloud-based consumer video feedback solutions have witnessed a considerable increase in popularity.
Companies can use cloud-based video feedback platforms to gain a qualitative and quantitative analysis of their customers' reactions, develop their products, and promote them more effectively. End users in these countries can utilize cloud-based video feedback solutions as the internet infrastructure has matured in high-income countries and is prospering in several developing countries.
The IT and Telecom segment is forecasted to gross the highest revenue which is projected to expand at a CAGR of over 6.8% from 2025 to 2035. The consumer video feedback software market is divided into FMCG, BFSI, electronics, IT & telecom, retail, hotel, and others based on the end-user. In 2024, the FMCG segment dominated the market.
Due to the increased rivalry, FMCG firms are investing heavily in research activities and tools, such as consumer video feedback software, to better understand consumer behavior and provide better customer service and product offerings. For example, Unilever used consumer video feedback software to research customer experience when buying on e-commerce platforms
Furthermore, since consumer preferences for FMCG items differ from area to region, and as the industry becomes more competitive, analytical tools such as consumer video feedback software are expected to gain popularity during the projection period.
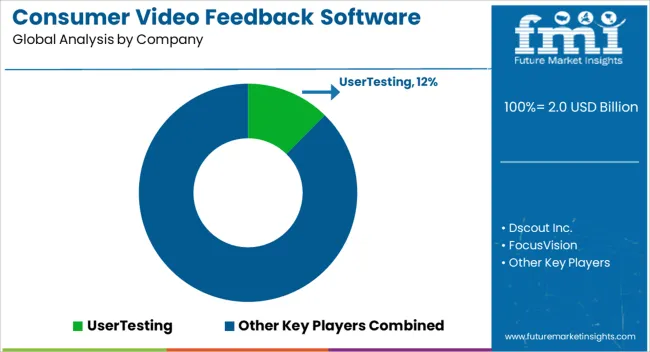
The leading players in the global Consumer Video Feedback Software market include UserTesting, dscout Inc., FocusVision, Qualtrics, Medallia Inc., Voxpopme, Product Peel, Inc., Typeform, Phonic Inc., and Discuss.io. To gain a competitive advantage in the industry, these market players are investing in product launches, partnerships, mergers and acquisitions, and expansions.
Similarly, recent developments related to companies in Consumer Video Feedback Software have been tracked by the team at Future Market Insights, which are available in the full report.
The global consumer video feedback software market is estimated to be valued at USD 2.0 billion in 2025.
The market size for the consumer video feedback software market is projected to reach USD 4.0 billion by 2035.
The consumer video feedback software market is expected to grow at a 7.4% CAGR between 2025 and 2035.
The key product types in consumer video feedback software market are cloud and on premise.
In terms of end user type, fmcg segment to command 27.8% share in the consumer video feedback software market in 2025.


Full Research Suite comprises of:
Market outlook & trends analysis
Interviews & case studies
Strategic recommendations
Vendor profiles & capabilities analysis
5-year forecasts
8 regions and 60+ country-level data splits
Market segment data splits
12 months of continuous data updates
DELIVERED AS:
PDF EXCEL ONLINE
Consumer Packaging Industry Analysis in India Forecast and Outlook 2025 to 2035
Consumer Foam Market Size and Share Forecast Outlook 2025 to 2035
Consumer Packaging Industry Analysis in China Size and Share Forecast Outlook 2025 to 2035
Consumer Electronics Packaging Market Size and Share Forecast Outlook 2025 to 2035
Consumer Cloud Subscription Market Size and Share Forecast Outlook 2025 to 2035
Consumer Packaging Industry Analysis in Brazil Size and Share Forecast Outlook 2025 to 2035
Consumer Electronic Accessories Market Size and Share Forecast Outlook 2025 to 2035
Consumer Facing AI Products Market Size and Share Forecast Outlook 2025 to 2035
Consumer Network Attached Storage Market Size and Share Forecast Outlook 2025 to 2035
Consumerware Market Size and Share Forecast Outlook 2025 to 2035
Consumer Metaverse Market Size and Share Forecast Outlook 2025 to 2035
Consumer Electronics High Voltage Electric Capacitor Market Size and Share Forecast Outlook 2025 to 2035
Consumer Appliances Market Analysis by Product Type, Technology, Sales Channel, End User and Region 2025 to 2035
Consumer Electronic Sensors Market Trends - Growth & Forecast 2025 to 2035
Consumer Robotics Market Insights - Growth & Forecast 2025 to 2035
Consumer Electronics Market - Trends, Growth & Forecast 2025 to 2035
Market Share Insights for Consumer Electronics Packaging Manufacturers
Indonesia Consumer Packaging Market Trends & Forecast 2024-2034
Consumer Packaging Market Trends & Industry Growth Forecast 2024-2034
Consumer Drones Market

Thank you!
You will receive an email from our Business Development Manager. Please be sure to check your SPAM/JUNK folder too.
Chat With
MaRIA