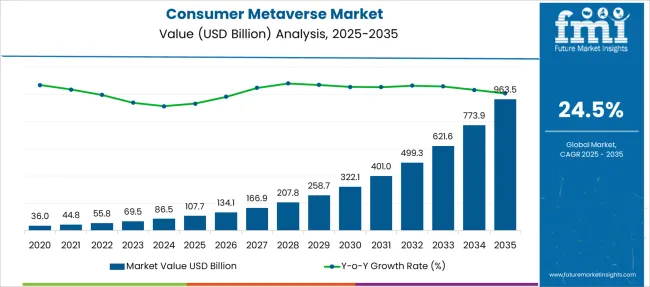
The Consumer Metaverse Market is estimated to be valued at USD 107.7 billion in 2025 and is projected to reach USD 963.5 billion by 2035, registering a compound annual growth rate (CAGR) of 24.5% over the forecast period.
| Metric | Value |
|---|---|
| Consumer Metaverse Market Estimated Value in (2025 E) | USD 107.7 billion |
| Consumer Metaverse Market Forecast Value in (2035 F) | USD 963.5 billion |
| Forecast CAGR (2025 to 2035) | 24.5% |
The consumer metaverse market is expanding rapidly as immersive digital experiences become mainstream and consumer interest in virtual environments grows. Advances in technology have enabled more sophisticated and accessible platforms where users can engage socially, play, and shop within interconnected virtual worlds.
Hardware improvements, such as virtual reality headsets and motion sensors, have enhanced user experience, driving greater adoption among gamers and casual users alike. The gaming sector remains a major driver, with interactive and multiplayer games forming the backbone of many metaverse ecosystems.
Content creators and developers are continuously innovating to provide more engaging and immersive experiences, attracting a diverse user base. Increasing investments in infrastructure, user-friendly interfaces, and cross-platform compatibility are expected to sustain growth. Segmental growth is expected to be led by Hardware components, due to their critical role in enabling immersive experiences, and the Game application, which continues to dominate consumer engagement in the metaverse.
The market is segmented by Component and Application and region. By Component, the market is divided into Hardware, Software, and Services. In terms of Application, the market is classified into Game, Media & Entertainment, Education, and Other Applications. Regionally, the market is classified into North America, Latin America, Western Europe, Eastern Europe, Balkan & Baltic Countries, Russia & Belarus, Central Asia, East Asia, South Asia & Pacific, and the Middle East & Africa.
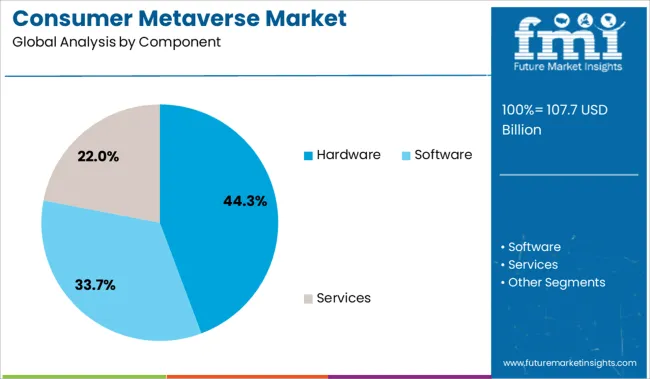
The Hardware segment is projected to hold 44.3% of the consumer metaverse market revenue in 2025, establishing it as the leading component category. Growth in this segment is fueled by the necessity of advanced devices such as virtual reality headsets, augmented reality glasses, and haptic feedback systems to facilitate immersive user interactions.
Consumer demand for higher resolution displays, lightweight designs, and improved comfort has led manufacturers to innovate rapidly. Additionally, hardware developments have expanded the accessibility of metaverse platforms beyond early adopters to mainstream audiences.
As user experience remains central to metaverse adoption, investment in hardware technology continues to be a key market driver. This segment’s growth is supported by the increasing number of hardware users and the need for continuous upgrades to match evolving software capabilities.
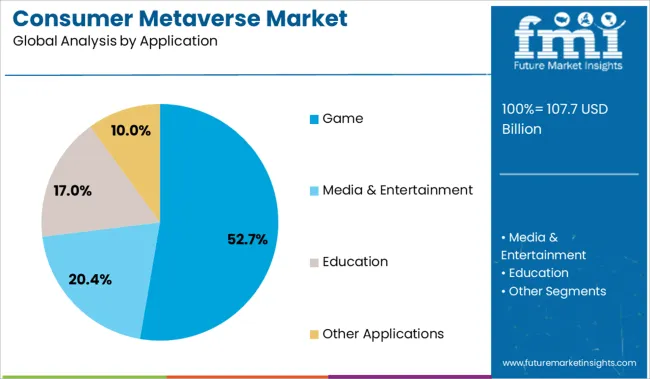
The Game application segment is expected to contribute 52.7% of the consumer metaverse market revenue in 2025, maintaining its dominance in usage. Gaming has been the primary entry point for many users into metaverse environments due to its interactive and social nature.
The rise of multiplayer online games and virtual economies has created dynamic spaces where players engage in activities beyond traditional gaming, including socializing and content creation. Developers have focused on enhancing gameplay mechanics, user customization, and in-game monetization, which have boosted user retention and spending.
The gaming application also benefits from collaborations with popular franchises and esports events that draw large audiences. As immersive storytelling and interactive experiences evolve, the Game segment is positioned to remain the core driver of consumer engagement within the metaverse.
As per the Global Consumer Metaverse Market research by Future Market Insights - a market research and competitive intelligence provider, historically, from 2020 to 2024, the Consumer Metaverse Market value increased at around 35% CAGR.
The key revenue drivers which affect the demand for Consumer Metaverse include increasing usage of cutting-edge technology like artificial intelligence (AI), mixed reality (MR), and blockchain. Numerous businesses, including Facebook, Roblox, Fortnite, NVidia, Microsoft, Epic, USM, Google, RTFKT Akira, and Oculus, have already incorporated or have plans to use metaverse extended reality programs (XR) and other cutting-edge technology.
The analysis found that LG Group filed 688 patent applications on 455 patent families, Sony filed 87 XR applications on 78 patent families, and Qualcomm Incorporated filed 80 patent across 28 patent families for the metaverse.
The market is also fuelled by the usage of cryptocurrency as a mode of transaction in the metaverse. Everything in the metaverse, from the avatar, and shoes to seamless tokens (NFT), is paid using cryptocurrency. A poll indicates that although 44% of businesses are investing in NFTs, 53% of businesses are doing so in cryptocurrencies.
One in ten people invests in cryptocurrencies, which are commonly utilized in the trading of various commodities including NFTs, according to a CNBC report. Due to the global accessibility of cryptocurrency trading, investors can use this form of money to sell directly to customers by adjusting to metaverse market patterns.
The key factors which are propelling the Consumer Metaverse demand include expansion of opportunity for Business to Business and Business to Consumer, the exceeding screen time of Gen Z users, new Career Opportunities and rising adoption of advanced VR devices and blockchain to accelerate growth.
The metaverse does not support the idea that businesses can employ coercion to expand their customer bases while eschewing business practices.
The Gucci wallet, for instance, had a higher value in the Roblox metaverse than it did in the actual world when it was exchanged for 350,000 Robux, or USD 4,115. However, in reality, the similar bag costs close to USD 3,400. Thus expanding opportunities can help increase metaverse market size.
There are more job opportunities in the metaverse market. The increased demand for a variety of goods and services in consumer metaverse is leading to the creation of more jobs, which could ultimately spur market expansion.
The technology and innovation report 2024 predicts the creation of 10,000 new employment in the near future across a range of industries, including research, planning, development, security, globalization, storytelling, ads prevention, and cybersecurity. Metaverse can also be used for virtual events, Advertising, employee engagement programs, engaging and immersive learning, and shopping experiences, real estate leasing, and several other opportunities which generate jobs for many people across different sectors.
The Los Angeles Times reports that Gen Z spends a lot of time in front of devices, mostly on their smartphones. They watch 7.2 hours of video on average every day, which is over an hour more than the 6.3 hours that Gen Xers watch.
Old habits are also challenging to break, as the adage goes. Smartphones stand a decent possibility of dominating the metaverse demand, given the widespread use of mobile and the astounding amount of time that users of all ages spend in front of displays.
Small- to medium-sized businesses and individual customers’ rising desire for high-tech VR gadgets is promoting market expansion. Additionally, market expansion is fueled by the rising use of cutting edge technologies in various systems, such as block chain, mixed reality, and artificial intelligence (Al).
Besides, increasing investment in e-commerce businesses and adoption and product displays in public places are supporting the market expansion. The United Nations Conference on Trade and Development estimated that by 2024, worldwide e-commerce sales would have increased from 16% to 19%, reaching USD 26.7 Tn.
Worldwide e-commerce sales growth of this magnitude has produced a sizable window of opportunity for the market expansion throughout the projection period.
The factors restraining the growth of consumer metaverse market are lack of awareness of services and threat of cyber based attacks. The lack of user understanding of the service and security alternatives may provide challenges to the expansion of the metaverse business.
Cyber-attacks incidence have increased hampering business functions which have raised serious security issues. In September 2024, more than 1,700 cyberattacks per company totalled more than 500 Million reports, according to SonicWall.
Metaverse market can provide cybercriminals additional chances to harm organizations and people. Some of the key factors that are anticipated to limit the growth of the metaverse market's revenue during the forecast period include worries about data security and privacy in dynamic environments, problems with user identity, and difficulties in persuading users to use payment services.
During the projection period, North America is expected to be the largest Consumer Metaverse Market. Since North American users and consumers adopt new and sophisticated technologies, the North American region has a large market share because of the response got to them by the people.
For example, on June 2025 KPMG announced the launch of its first metaverse solutions in the United States and Canada. It will allow employees, clients, and communities to collaborate, work together, and explore opportunities for growth across industries and sectors.
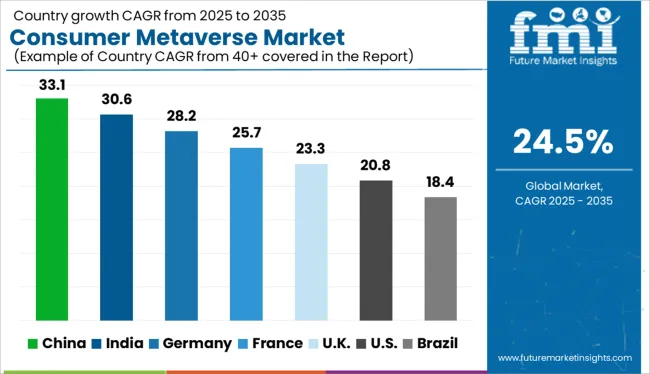
The United States is expected to account for the highest market of USD 963.5 Billion by the end of 2035. It is expected to be projected to have an absolute dollar growth of USD 153.5 Billion. Americans are progressively accessing and experiencing the metaverse as realistically as possible through VR, MR, AR, and other new technologies. Americans also appreciate their metaverse experience, which motivates them to spend money on gadgets that would make it even better.
The rising desire for gadgets that improve users' experiences encourages market expansion. Additionally, the industry is expanding due to the strong regional presence of gaming and metaverse entertainment companies as Sandbox, Nvidia Corporation, and Epic Games, Inc. As an illustration, Nvidia Corporation recently announced collaborations with Blender and Adobe that will provide millions of people access to NVIDIA Omniverse, the first platform for collaboration and simulation.
The nationwide survey in the USA revealed that the vast majority of adults in the country identified as of letting themselves join the metaverse, citing around 74%. The survey also revealed that around 41% of participants whose decision to join metaverse was to explore things they otherwise could not do.
On the other hand, around 38% of the population viewed metaverse as a method that would bring people together. Around 23% of them acknowledged the possibility that they would seek out another platform to allow themselves to be different during metaverse.
Hardware is the highest used component in Consumer Metaverse Market. Demand growth of Hardware as a Component for Consumer Metaverse was recorded at 34.8% during 2020 to 2024, while it is expected to grow at CAGR of 24.1% during 2025 to 2025. Several businesses create consumer metaverse hardware to enhance the metaverse user experience.
The hardware segment is anticipated to account for the greatest revenue share throughout the projected period due to an increasing focus among companies on manufacturing products that give a better user experience and enable more extended user immersion.
Companies are also attempting to create more sophisticated gear, such as haptic devices, VR/AR headsets, and sensors, to enhance the realism of virtual worlds.
This market growth will also be fueled by the creation of user interfaces that let users access 3D material on a number of gadgets, including smartphones, next-generation TVs, and the mixed reality smart glasses known as HoloLens. It is projected that Facebook Reality Labs will invest at least USD 10 billion in the creation of hardware for augmented reality (AR) and virtual reality (VR).
The most widely utilized application of Consumer Metaverse is Gaming. Demand growth through Gaming industry was recorded at 34.2% during 2020 to 2024, while it is expected to grow at a CAGR of 23.2% during 2025 to 2025.
Due to the rapid increase in the gaming industry worldwide, it will be the highest revenue-generating application for the consumer metaverse market. The video game industry had been one of the key beneficiaries of the pandemic given that it is grown by 23% in 2024 compared to 2020. This is due to gaming influencers like Mortal, Jonathan Gaming, Vanoss Gaming, Markplier, Jacksepticeye, Dan TDM, PopularMMOs, W2S, Ali-A, H20Delirious, The Syndicate Project, among others.
Metaverse games are the result of the most recent development in the video games sector. To access the higher level games, players must enter the real Metaverse game.
Gaming firms prioritize split initiatives since the future is divided, even though the Metaverse may be watched or divided.
Different player pictures, which serve as a depiction of real identities visually, control the characters in Metaverse games. Like humans in the real world, these characters live in the Metaverse.
The idea behind metaverse gaming is to let players gain virtual goods and then sell them for real money. Players can communicate with other players in the Metaverse, invite their social network friends, and play games with them. Players in Metaverse feel as alive as they would in the real world because of the use of AR and VR technologies to create a dynamic experience.
Since the stadiums in the metaverse can communicate with one another, players can easily shift their toys from one to the other.
The gaming of metaverse is powered by AR&VR technologies, blockchain, cryptocurrency, Internet of Things (IoT) and 3D reconstruction, While Metaverse is still in its early stages, numerous companies have already unveiled the new breed of stadiums, we have major players like TaleCraft Majuro announced the release of their classic NFT game On November 11, 2024. Gamers can also develop NFT games using mediaeval game settings.
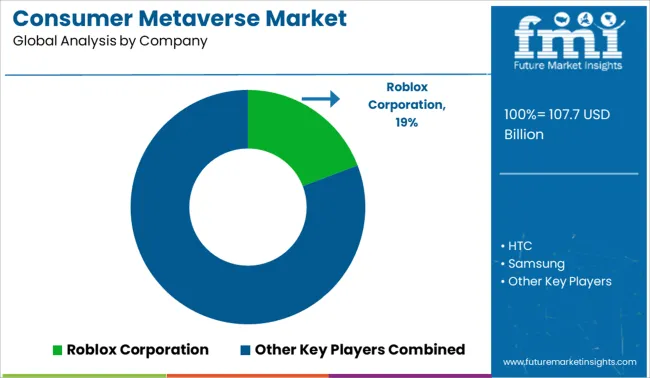
Players in the market are constantly developing improved analytical solutions as well as extending their product offerings. The companies are focused on their alliances, technology collaborations, and product launch strategies.
Some of the recent developments in the Bioalcohol market are:
In January 2025, The Sandbox revealed a collaboration with Warner Music Group to introduce the first realm in the metaverse of The Sandbox with a musical theme. With this partnership, Warner Music Group (WMG) would formally enter the metaverse and NFT markets.
In January 2025, Microsoft disclosed that it has acquired Activision Blizzard, Inc. In addition to laying the groundwork for the metaverse industry, Microsoft believes that this acquisition will accelerate the expansion of its gaming division across mobile, PC, cloud, and console platforms.
In November 2024, A partnership between Tencent and the Asian Institute of Digital Finance was announced (AIDF). In order to better serve the rapidly expanding Asian digital financial sector, Tencent Financial Technology (FiT) and AIDF will collaborate in education, entrepreneurship, and research.
In November 2024, TaleCraft Majuro announced the opening of their NFT gaming metaverse with a medieval theme. TaleCraft assumes that players on its platform will be able to explore a medieval gaming world and engage in a variety of in-game activities using constructed NFTs.
In October 2024, According to estimates, Facebook Reality Labs will invest at least USD 10 Billion in the creation of hardware, software, and content for augmented reality (AR) and virtual reality (VR). The section of Meta Platforms, Inc., formerly known as Facebook, Inc., is Facebook Reality Labs.
In March 2024, NetEase, Inc announced that its NetEase Cloud Music expanded its strategic alliance with Merlin Network in China. The partnership between them had initiated in 2020.
The global consumer metaverse market is estimated to be valued at USD 107.7 billion in 2025.
The market size for the consumer metaverse market is projected to reach USD 963.5 billion by 2035.
The consumer metaverse market is expected to grow at a 24.5% CAGR between 2025 and 2035.
The key product types in consumer metaverse market are hardware, software and services.
In terms of application, game segment to command 52.7% share in the consumer metaverse market in 2025.


Our Research Products

The "Full Research Suite" delivers actionable market intel, deep dives on markets or technologies, so clients act faster, cut risk, and unlock growth.

The Leaderboard benchmarks and ranks top vendors, classifying them as Established Leaders, Leading Challengers, or Disruptors & Challengers.

Locates where complements amplify value and substitutes erode it, forecasting net impact by horizon

We deliver granular, decision-grade intel: market sizing, 5-year forecasts, pricing, adoption, usage, revenue, and operational KPIs—plus competitor tracking, regulation, and value chains—across 60 countries broadly.

Spot the shifts before they hit your P&L. We track inflection points, adoption curves, pricing moves, and ecosystem plays to show where demand is heading, why it is changing, and what to do next across high-growth markets and disruptive tech

Real-time reads of user behavior. We track shifting priorities, perceptions of today’s and next-gen services, and provider experience, then pace how fast tech moves from trial to adoption, blending buyer, consumer, and channel inputs with social signals (#WhySwitch, #UX).

Partner with our analyst team to build a custom report designed around your business priorities. From analysing market trends to assessing competitors or crafting bespoke datasets, we tailor insights to your needs.
Supplier Intelligence
Discovery & Profiling
Capacity & Footprint
Performance & Risk
Compliance & Governance
Commercial Readiness
Who Supplies Whom
Scorecards & Shortlists
Playbooks & Docs
Category Intelligence
Definition & Scope
Demand & Use Cases
Cost Drivers
Market Structure
Supply Chain Map
Trade & Policy
Operating Norms
Deliverables
Buyer Intelligence
Account Basics
Spend & Scope
Procurement Model
Vendor Requirements
Terms & Policies
Entry Strategy
Pain Points & Triggers
Outputs
Pricing Analysis
Benchmarks
Trends
Should-Cost
Indexation
Landed Cost
Commercial Terms
Deliverables
Brand Analysis
Positioning & Value Prop
Share & Presence
Customer Evidence
Go-to-Market
Digital & Reputation
Compliance & Trust
KPIs & Gaps
Outputs
Full Research Suite comprises of:
Market outlook & trends analysis
Interviews & case studies
Strategic recommendations
Vendor profiles & capabilities analysis
5-year forecasts
8 regions and 60+ country-level data splits
Market segment data splits
12 months of continuous data updates
DELIVERED AS:
PDF EXCEL ONLINE
Consumer Grade Electrochemical CO Sensor Market Size and Share Forecast Outlook 2025 to 2035
Consumer Packaging Industry Analysis in India Forecast and Outlook 2025 to 2035
Consumer Foam Market Size and Share Forecast Outlook 2025 to 2035
Consumer Packaging Industry Analysis in China Size and Share Forecast Outlook 2025 to 2035
Consumer Electronics Packaging Market Size and Share Forecast Outlook 2025 to 2035
Consumer Cloud Subscription Market Size and Share Forecast Outlook 2025 to 2035
Consumer Packaging Industry Analysis in Brazil Size and Share Forecast Outlook 2025 to 2035
Consumer Electronic Accessories Market Size and Share Forecast Outlook 2025 to 2035
Consumer Facing AI Products Market Size and Share Forecast Outlook 2025 to 2035
Consumer Video Feedback Software Market Size and Share Forecast Outlook 2025 to 2035
Consumer Network Attached Storage Market Size and Share Forecast Outlook 2025 to 2035
Consumerware Market Size and Share Forecast Outlook 2025 to 2035
Consumer Electronics High Voltage Electric Capacitor Market Size and Share Forecast Outlook 2025 to 2035
Consumer Appliances Market Analysis by Product Type, Technology, Sales Channel, End User and Region 2025 to 2035
Consumer Electronic Sensors Market Trends - Growth & Forecast 2025 to 2035
Consumer Robotics Market Insights - Growth & Forecast 2025 to 2035
Consumer Electronics Market - Trends, Growth & Forecast 2025 to 2035
Market Share Insights for Consumer Electronics Packaging Manufacturers
Indonesia Consumer Packaging Market Trends & Forecast 2024-2034
Consumer Packaging Market Trends & Industry Growth Forecast 2024-2034

Thank you!
You will receive an email from our Business Development Manager. Please be sure to check your SPAM/JUNK folder too.
Chat With
MaRIA