The Consumer Network Attached Storage Market is estimated to be valued at USD 8.0 billion in 2025 and is projected to reach USD 19.7 billion by 2035, registering a compound annual growth rate (CAGR) of 9.5% over the forecast period.
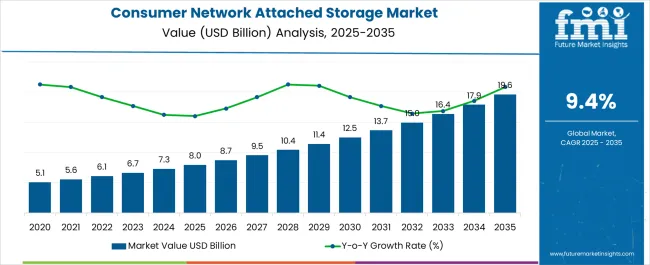
| Metric | Value |
|---|---|
| Consumer Network Attached Storage Market Estimated Value in (2025 E) | USD 8.0 billion |
| Consumer Network Attached Storage Market Forecast Value in (2035 F) | USD 19.7 billion |
| Forecast CAGR (2025 to 2035) | 9.5% |
The consumer network attached storage market is experiencing accelerated growth. Rising demand for centralized data storage, increased use of multimedia content, and the growing need for secure personal data management are key drivers. Current dynamics are being influenced by rapid adoption of connected devices, higher internet penetration, and rising awareness about data privacy and backup solutions.
Advancements in storage capacity, cloud integration, and user-friendly interfaces are enhancing consumer adoption. Cost-effectiveness and scalability compared to traditional storage solutions are further strengthening market positioning. The future outlook is supported by continuous digitalization of households, expansion of smart home ecosystems, and increasing importance of remote accessibility for personal and professional content.
Growth rationale is rooted in consumer preference for reliable, high-capacity, and easy-to-manage storage systems Innovation in energy-efficient designs, data protection features, and wireless connectivity is expected to broaden adoption across global markets, ensuring stable revenue generation and sustainable long-term expansion.
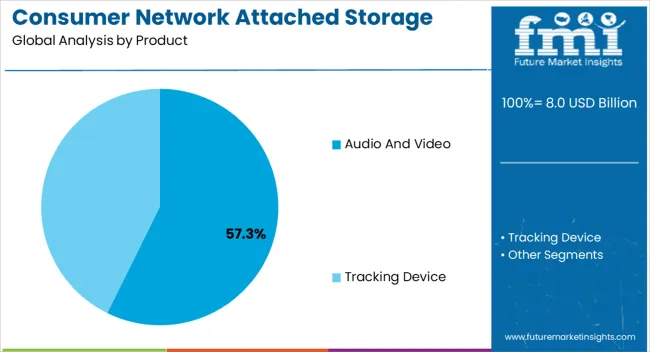
The audio and video segment, accounting for 57.30% of the product category, has been driving growth due to the surge in high-definition content consumption and storage requirements for personal entertainment libraries. Its leading position is supported by increasing usage of streaming platforms, gaming content, and home-based multimedia solutions that require secure and scalable storage.
Enhanced performance capabilities such as faster data transfer speeds and multimedia file management tools have boosted adoption. Market confidence has been reinforced by technological advances that ensure compatibility with multiple devices and seamless access across platforms.
Rising consumer expectations for uninterrupted entertainment experiences have encouraged manufacturers to offer larger capacities and improved data protection With growing digital content consumption trends, this segment is expected to remain dominant and continue shaping the product landscape within the consumer network attached storage market.
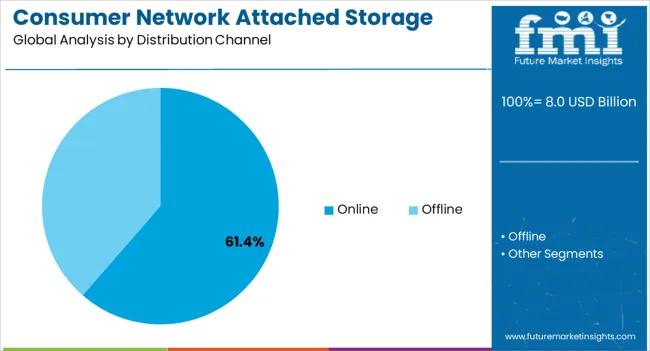
The online channel, representing 61.40% of the distribution category, has established itself as the primary mode of product sales due to increasing consumer preference for convenience, competitive pricing, and broader product availability. Growth in e-commerce platforms has enabled easy access to multiple storage solutions, supported by detailed product comparisons and user reviews.
Online distribution has been further strengthened by direct-to-consumer strategies from leading manufacturers, ensuring transparent pricing and efficient delivery models. Widespread internet penetration and rising comfort with digital transactions have expanded adoption across both mature and emerging markets.
Seasonal discounts, promotional campaigns, and subscription-based offerings have contributed to maintaining strong consumer engagement With the expansion of digital retail infrastructure and growing reliance on online shopping, the online channel is expected to sustain its market share and remain a dominant force in driving consumer network attached storage sales.
Consumer network attached storage systems started incorporating multimedia capabilities, including media streaming, DLNA support, and multimedia server functionalities. This attracted users seeking home entertainment solutions.
Manufacturers began introducing more affordable and user-friendly consumer NAS solutions aimed at home users. These devices focused on basic storage and file-sharing capabilities.
Consumer NAS market will likely revolve around enhancing user experience, security, integration with emerging technologies, and adapting to the evolving needs of consumers in an increasingly connected world. The demand for consumer network attached storage is projected to rise at a CAGR of 9.9% from 2025 to 2035.
| Market Value in 2025 | USD 6.1 billion |
|---|---|
| Market Value in 2035 | USD 16.9 billion |
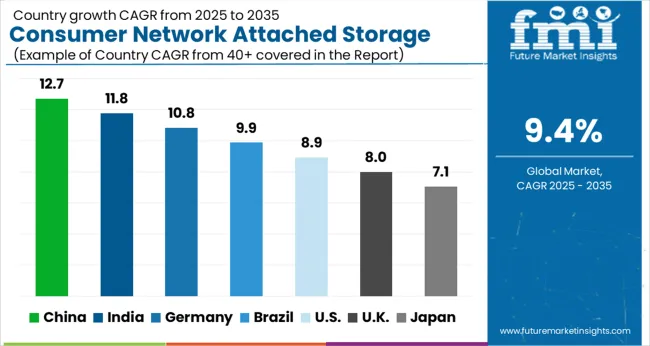
The following table shows the top five countries by revenue, led by Australia and Japan. Consumer network-attached storage systems provide flexibility in terms of storage capacity, RAID configurations, and software options. Consumers appreciate the ability to tailor these systems to their specific needs driving their demand in various countries. These two countries are predicted to boost their consumer network attached storage services efforts through 2035.
| Countries | Forecast CAGRs from 2025 to 2035 |
|---|---|
| Japan | 11.1% |
| The United States | 7.7% |
| China | 10.4% |
| Australia | 13.4% |
| Germany | 9.4% |
The United States is expected to witness a CAGR of 7.7% in consumer network attached storage market by 2035. The consumer network-attached storage market in United states is growing due to increased investment in wireless technology by both private and public companies in the country.
The increased consumption of high-quality media content, including 4K videos and high-resolution images, drives the need for robust storage solutions like NAS to store and stream this content within households. The rising shift to remote work setups has increased the demand for consumer network attached storage devices as centralized storage hubs for remote file access and collaboration among family members or remote work teams.
Consumer network attached storage market in China has seen substantial growth due to the growing adoption of high-definition multimedia content, online gaming, and content creation has resulted in a surge in data storage requirements among consumers in China. The consumer network attached storage market in China is projected to rise at a CAGR of 10.4% from 2025 to 2035.
The flourishing e-commerce industry and the digitalization of services have led to a surge in data storage requirements for online businesses and entrepreneurs, driving market demand in China.
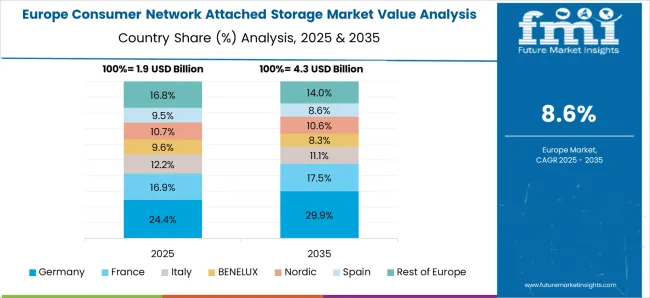
The consumer network attached storage market growth in Germany is attributed to rising demand for storage solutions stems from increased digital content consumption, including high-resolution media, data-heavy applications, and online services. The consumer network attached storage market in Germany is projected to rise at a CAGR of 9.4% from 2025 to 2035.
Consumer network attached storage systems offer users more control over their data, appealing to German consumers who prioritize data privacy and security. Consumers often value eco-friendly and energy-efficient products. Consumer network attached storage systems that align with these values gain traction in the market.
Consumer network attached storage market in Japan is expected to grow with a CAGR of 11.1% during 2025 to 2035.The presence of tech-savvy population with a high demand for storing and streaming multimedia content, including high-resolution videos, anime, and music drive the demand for consumer network attached storage market in Japan.
Consumers in the country prioritize data security and privacy, making consumer network attached storage systems appealing due to their local storage and control features.
The demand for consumer network attached storage is expected to rise in Australia. By 2035, the market is expected to expand at a CAGR of 13.4%. Increasing digital content consumption, including high-definition videos, gaming, and multimedia content, driving the need for ample storage solutions in Australia.
Government initiatives supporting digital transformation across sectors contribute to the demand for storage solutions like consumer network attached storage. Service providers in the country introducing advanced features, improved performance, and a variety of models to suit different consumer preferences driving the market growth.
The 4 bays segment will dominate until 2035, with a market share of 29.2%. 4 bays offer a level of scalability, enabling users to start with fewer drives and easily expand the storage capacity.
The business segment is expected to have a share of 58.9%. Consumer network attached storage systems offer businesses greater control over their data, ensuring higher levels of security compared to cloud-based storage options.
| Category | Market share |
|---|---|
| 4-Bays | 29.2% |
| Business | 58.9% |
The 4-bays segment held a significant market share of 29.2% in 2025. Consumers require more storage space with the growing consumption of digital media, including high-resolution photos and videos. A 4-bay NAS balances capacity and convenience, allowing users to expand their storage needs while maintaining a manageable size.
A 4-bay NAS allows users to have a balance between storage capacity and redundancy. It provides a significant amount of storage while offering RAID configurations for data protection. Four-bay NAS devices strike a balance between size and capacity, making them suitable for placement in homes or small offices without taking up excessive space.
The business segment dominated the market with a revenue share of 58.9% in 2025. Small businesses often need reliable data management and backup solutions. Growth of this segment is attributed to increasing adoption of consumer network attached storage systems as they offer features such as easy installation and efficient backup.
Consumer network attached storage (NAS) devices offer an accessible way for these businesses to store and protect their critical data, including financial records, customer information, and business documents.
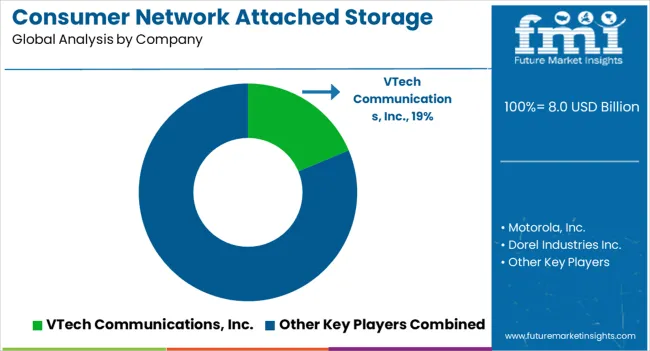
The consumer network-attached storage (NAS) market is fragmented. Historically, the main players dominated the consumer network-attached storage (NAS) market. Businesses' increased demand for data storage is drawing a slew of new participants to the industry, making it more competitive.
Some of the developments from the market are given below
| Attributes | Details |
|---|---|
| Estimated Market Size in 2025 | USD 6.6 billion |
| Projected Market Valuation in 2035 | USD 16.9 billion |
| Value-based CAGR 2025 to 2035 | 9.9% |
| Forecast Period | 2025 to 2035 |
| Historical Data Available for | 2020 to 2025 |
| Market Analysis | Value in USD billion |
| Key Regions Covered | North America; Latin America; Western Europe; Eastern Europe; South Asia and Pacific; East Asia; Middle East and Africa |
| Key Market Segments Covered | Design, End User, Region |
| Key Countries Profiled | The United States, Canada, Brazil, Mexico, Germany, The United Kingdom, France, Spain, Italy, Russia, Poland, Czech Republic, Romania, India, Bangladesh, Australia, New Zealand, China, Japan, South Korea, GCC countries, South Africa, Israel |
| Key Companies Profiled | Synology Inc.; NETGEAR; Western Digital Corporation; QNAP Systems, Inc.; ASUSTOR Inc.; Buffalo Americas Inc.; Thecus.COM; Zyxel |
The global consumer network attached storage market is estimated to be valued at USD 8.0 billion in 2025.
The market size for the consumer network attached storage market is projected to reach USD 19.7 billion by 2035.
The consumer network attached storage market is expected to grow at a 9.5% CAGR between 2025 and 2035.
The key product types in consumer network attached storage market are audio and video and tracking device.
In terms of distribution channel, online segment to command 61.4% share in the consumer network attached storage market in 2025.


Our Research Products

The "Full Research Suite" delivers actionable market intel, deep dives on markets or technologies, so clients act faster, cut risk, and unlock growth.

The Leaderboard benchmarks and ranks top vendors, classifying them as Established Leaders, Leading Challengers, or Disruptors & Challengers.

Locates where complements amplify value and substitutes erode it, forecasting net impact by horizon

We deliver granular, decision-grade intel: market sizing, 5-year forecasts, pricing, adoption, usage, revenue, and operational KPIs—plus competitor tracking, regulation, and value chains—across 60 countries broadly.

Spot the shifts before they hit your P&L. We track inflection points, adoption curves, pricing moves, and ecosystem plays to show where demand is heading, why it is changing, and what to do next across high-growth markets and disruptive tech

Real-time reads of user behavior. We track shifting priorities, perceptions of today’s and next-gen services, and provider experience, then pace how fast tech moves from trial to adoption, blending buyer, consumer, and channel inputs with social signals (#WhySwitch, #UX).

Partner with our analyst team to build a custom report designed around your business priorities. From analysing market trends to assessing competitors or crafting bespoke datasets, we tailor insights to your needs.
Supplier Intelligence
Discovery & Profiling
Capacity & Footprint
Performance & Risk
Compliance & Governance
Commercial Readiness
Who Supplies Whom
Scorecards & Shortlists
Playbooks & Docs
Category Intelligence
Definition & Scope
Demand & Use Cases
Cost Drivers
Market Structure
Supply Chain Map
Trade & Policy
Operating Norms
Deliverables
Buyer Intelligence
Account Basics
Spend & Scope
Procurement Model
Vendor Requirements
Terms & Policies
Entry Strategy
Pain Points & Triggers
Outputs
Pricing Analysis
Benchmarks
Trends
Should-Cost
Indexation
Landed Cost
Commercial Terms
Deliverables
Brand Analysis
Positioning & Value Prop
Share & Presence
Customer Evidence
Go-to-Market
Digital & Reputation
Compliance & Trust
KPIs & Gaps
Outputs
Full Research Suite comprises of:
Market outlook & trends analysis
Interviews & case studies
Strategic recommendations
Vendor profiles & capabilities analysis
5-year forecasts
8 regions and 60+ country-level data splits
Market segment data splits
12 months of continuous data updates
DELIVERED AS:
PDF EXCEL ONLINE
Storage Area Network (SAN) Market Analysis by Component, SAN Type, Technology, Vertical, and Region through 2035
Consumer Grade Electrochemical CO Sensor Market Size and Share Forecast Outlook 2025 to 2035
Network Simulator Software Market Size and Share Forecast Outlook 2025 to 2035
Consumer Packaging Industry Analysis in India Forecast and Outlook 2025 to 2035
Consumer Foam Market Size and Share Forecast Outlook 2025 to 2035
Consumer Packaging Industry Analysis in China Size and Share Forecast Outlook 2025 to 2035
Consumer Electronics Packaging Market Size and Share Forecast Outlook 2025 to 2035
Consumer Cloud Subscription Market Size and Share Forecast Outlook 2025 to 2035
Consumer Packaging Industry Analysis in Brazil Size and Share Forecast Outlook 2025 to 2035
Storage Water Heater Market Size and Share Forecast Outlook 2025 to 2035
Network Connectivity Tester Market Size and Share Forecast Outlook 2025 to 2035
Consumer Electronic Accessories Market Size and Share Forecast Outlook 2025 to 2035
Consumer Facing AI Products Market Size and Share Forecast Outlook 2025 to 2035
Consumer Video Feedback Software Market Size and Share Forecast Outlook 2025 to 2035
Consumerware Market Size and Share Forecast Outlook 2025 to 2035
Network Analyzers Market Size and Share Forecast Outlook 2025 to 2035
Network as a Service (NaaS) Market Size and Share Forecast Outlook 2025 to 2035
Network Analytics Market Size and Share Forecast Outlook 2025 to 2035
Network Devices Market Size and Share Forecast Outlook 2025 to 2035
Network Sandboxing Market Size and Share Forecast Outlook 2025 to 2035

Thank you!
You will receive an email from our Business Development Manager. Please be sure to check your SPAM/JUNK folder too.
Chat With
MaRIA