Post-Consumer Recycled (PCR) Plastic Packaging Market Size, Share & Forecast 2025 to 2035

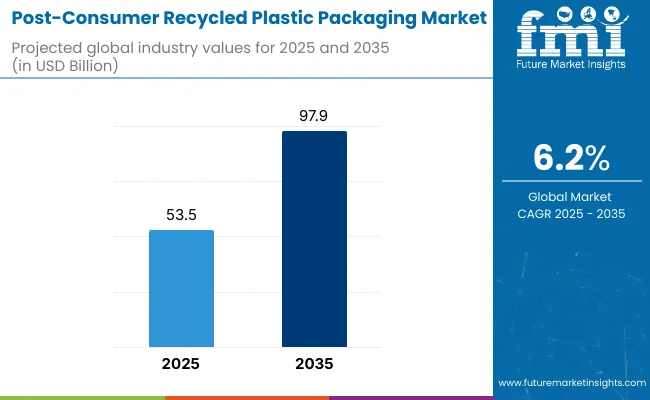
The global post-consumer recycled (PCR) plastic packaging market is projected to grow from USD 53.5 billion in 2025 to USD 97.9 billion by 2035, registering a CAGR of 6.2% during the forecast period. Sales in 2024 were recorded at USD 50.6 billion. The market’s momentum is driven by increasing regulatory pressure to reduce plastic waste, growing consumer preference for sustainable packaging, and major brand-owner commitments to circular economy goals.

PCR plastic packaging derived from recycled household and commercial plastic waste is increasingly used in food containers, bottles, flexible wraps, and rigid packaging. Its ability to lower carbon footprints without compromising functionality is positioning it as a critical material in the transition to sustainable packaging systems.
Quick Stats of Post-Consumer Recycled (PCR) Plastic Packaging Market

  • Market Value (2025): USD 53.5 billion
  • Forecast Value (2035): USD 97.9 billion
  • Forecast CAGR: 6.2%
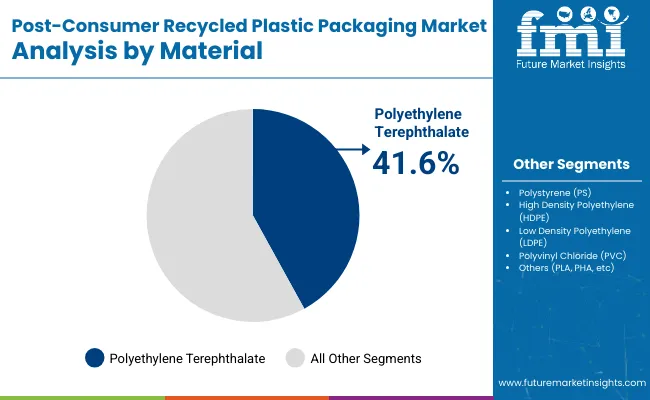
  • Material Type Leader in 2025: Polyethylene Terephthalate (PET) (41.6% market share)
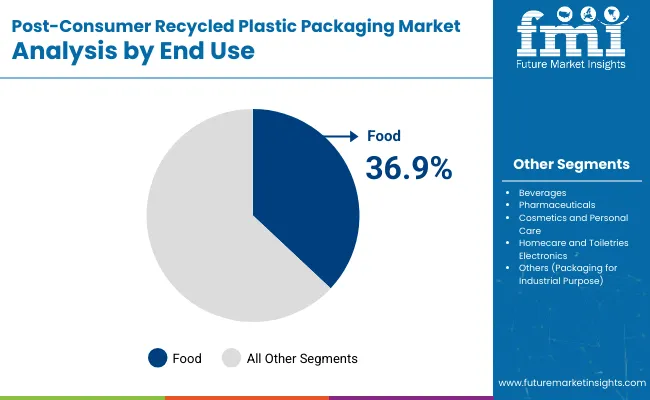
  • Top End Use: Food (36.9% share)
  • Key Growth Country: Western Europe (Germany is the fastest-growing market with 6.2% CAGR)

Post Consumer Recycled Plastic Packaging Market

Metric Value
Industry Size (2025E) USD 53.5 billion
Industry Value (2035F) USD 97.9 billion
CAGR (2025 to 2035) 6.2%

June 26, 2025 - Amcor, a global leader in developing and producing responsible packaging solutions, announced an investment in its Nicholasville, Ky., facility to increase post-consumer recycled (PCR) packaging production capabilities to support customers’ varied PCR needs.

The state-of-the-art system incorporates dedicated silos that feed multiple production lines to enable precise PCR blending, giving customers the ability to choose their optimal PCR percentage. The flexibility in PCR content up to and including 100% PCR is offered for custom and stock rigid packaging. The new system demonstrates Amcor’s ability to optimize manufacturing processes and enable increased use of PCR material.

Many brands look to adopt packaging that not only protects and promotes products but also aligns with sustainability goals. This facility gives customers more choices for the recycled content levels of their packaging and reinforces Amcor’s commitment to a circular economy,” said Greg Rosati, vice president, Amcor Rigid Packaging North America. “While the investment was made to support the specific demands of our spirits customers, there are opportunities to support customers across other segments.” In addition to the spirits market, this new system will also be available to customers in the healthcare, food and home and personal care segments.

Recent innovations in PCR plastic packaging focus on material purity, barrier performance, and traceability. Technologies like near-infrared (NIR) sorting, de-inking systems, and multi-layer co-extrusion are helping improve the aesthetics, mechanical properties, and food-contact safety of PCR content. Packaging converters are developing mono-material flexible films and PCR-compatible laminates for easier recyclability. Embedded digital watermarking and block chain-enabled tracking are being tested to verify recycled content claims and support extended producer responsibility (EPR) compliance. These innovations are driving PCR’s shift from niche to mainstream across CPG segments.

Europe leads the market due to stringent packaging waste directives, such as the EU’s Single-Use Plastics Directive and Packaging and Packaging Waste Regulation (PPWR). The North American market is growing rapidly, driven by EPR policies in California and corporate commitments from giants like P&G, Unilever, and Nestlé. Asia Pacific is emerging as a key contributor due to rising waste management infrastructure investments and regional mandates in Japan, South Korea, and India. New growth opportunities are unfolding in flexible pouch packaging, e-commerce mailers, and refill systems, as industries shift toward closed-loop packaging strategies and circularity-driven procurement.

Analyzing Post-Consumer Recycled (PCR) Plastic Packaging Market by Top Investment Segment

The market has been segmented based on material type, application, end use, and region. Material categories include PET, PS, HDPE, LDPE, PVC, and others like PLA and PHA, with PET and HDPE accounting for significant investments due to their recyclability and food-grade potential. Applications span bottles, trays, clamshells, blister packs, bags & sacks, pouches, cups & jars, and tubs, where bottles and flexible pouches drive the bulk of volume demand.

End-use segmentation highlights food, beverages, pharmaceuticals, cosmetics, homecare, electronics, and industrial packaging, with personal care and FMCG players increasingly shifting to PCR-based containers and films to meet sustainability commitments. Regionally, growth is mapped across North America, Latin America, Asia Pacific, Western Europe, Eastern Europe, and Middle East & Africa, with Europe and North America seeing strong investments fueled by EPR regulations, while Asia Pacific witnesses rising demand from regional converters and exporters.
Polyethylene Terephthalate (PET) Leads PCR Plastic Packaging Due to Clarity and Circularity Advantage

Post Consumer Recycled Plastic Packaging Market By Material

The polyethylene terephthalate (PET) segment is anticipated to capture 41.6% of the post-consumer recycled (PCR) plastic packaging market in 2025, driven by its high recyclability, optical clarity, and widespread use in consumer goods. Recycled PET (rPET) offers performance comparable to virgin-grade resin, making it suitable for packaging beverages, personal care items, and household products. Advancements in closed-loop recycling systems have enabled better sorting, decontamination, and pelletization of used PET bottles into food-grade packaging solutions.

The growing adoption of deposit return systems and bottle-to-bottle recycling initiatives particularly in North America and Europe has improved feedstock availability for PET recyclers. PET’s compatibility with flexible and rigid packaging formats makes it versatile across applications. Regulatory pressures encouraging minimum PCR content in packaging have prompted brands to transition toward rPET. Sustainability-conscious consumers have reinforced this trend, favoring transparent packaging with clear labeling that highlights recycled content.
Food Segment Prioritizes rPET for Safety, Regulatory Compliance, and Consumer Appeal

Post Consumer Recycled Plastic Packaging Market By End Use

The food segment is projected to hold a dominant share of 36.9% in the global PCR plastic packaging market in 2025, owing to the increasing integration of food-grade recycled plastics into packaging formats such as clamshells, trays, tubs, and bottles. Rising consumer preference for sustainable packaging, along with brand commitments to reduce virgin plastic use, has accelerated the adoption of recycled PET and HDPE in food applications. Regulatory approvals from the USA FDA and European Food Safety Authority (EFSA) for food-contact rPET have further supported its use in food packaging.

Recycled plastic packaging for bakery, dairy, and ready-to-eat meals has become more prevalent, particularly among premium and private-label brands seeking eco-differentiation. In parallel, the rise of chilled food and take-away culture has driven demand for lightweight, recyclable, and tamper-evident containers. Brands now emphasize closed-loop packaging claims as part of their environmental messaging, boosting demand for PCR packaging in the food industry.

Post-Consumer Recycled Plastic Packaging Market- Market Dynamics

A major factor supporting the growth of post-consumer recycled plastic packaging market is the improved material sorting infrastructure across many significant regions like USA, Canada and Western Europe. The global market for post-consumer recycled plastic packaging is witnessing the incorporation of new material processing technologies for manufacturing of post-consumer recycled products and materials.

Light weight nature of recycled plastic is another factor fuelling the growth of post-consumer recycled plastic packaging market.

The growth of post-consumer recycled plastic packaging market is propelled by certain properties of recycled plastic such as strength and crack-resistance. Another prominent factor promoting the growth of post-consumer recycled plastic packaging market is the environmental friendly property of the plastic.

However, the shortfall in supply has restricted the growth prospects for post-consumer recycled plastic packaging market. FDA regulations applicable to packaging of food products across geographic regions are a matter of concern for market players operating in the global post-consumer recycled plastic packaging market.

Manufacturers are identifying new infrastructure for segregating and collecting mixed plastics at the recovery facilities in order to implement appropriate sorting mechanism. Effectiveness of the selection process plays a vital role in the amount of materials recovered in these facilities.

Post-Consumer Recycled Plastic Packaging Market- Market Segmentation

The post-consumer recycled plastic packaging market can be segmented on the basis of product type, material type, process type and end use. On the basis of product type, the post-consumer recycled plastic packaging market can be segmented into bottles, cups, containers (jars and tubs), bags, clamshells and blister packs.

Mostly all the recycled plastic packaging products are thermoformed and the FDA approved products are even safe for direct food contact. On the basis of material type, the post-consumer recycled plastic packaging market can be segmented into PET (polyethylene terephthalate), HDPE (high density polyethylene) and PP (polypropylene).

PET plastic is expected to be the major contributor due to its abundance availability and ease in processing technology. On the basis of process type, the post-consumer recycled plastic packaging market can be segmented into mechanical (melting and refining) process and chemical process.

On the basis of end use, the post-consumer recycled plastic packaging market can be segmented into beverage (bottle and dairy products), electronics, home care, pharmaceuticals, and personal care.

Post-Consumer Recycled Plastic Packaging Market- Regional Outlook

Geographically, the post-consumer recycled plastic packaging market is segmented into five key regions: North America, Asia Pacific, Europe, Latin America and Middle East and Africa (MEA). North America is the leading manufacturer of post-consumer recycled plastic packaging market as USA and Canada have taken major steps to initiate material sorting infrastructures in the regions and is anticipated to witness a healthy growth.

Asia-Pacific is expected to witness a significant growth over the forecast period driven by the developments in China and India.

Post-Consumer Recycled Plastic Packaging Market- Key Players

The report offers an accurate evaluation of the market through detailed qualitative insights and verifiable projections about market size. The projections presented in the report have been derived using proven research methodologies and assumptions.

Key companies

  • Amcor
  • Berry Global
  • Cambrian Packaging
  • Evergreen Resources
  • Glenroy
  • Longdapac
  • Mondi
  • Proampac
  • PTT Global Chemical
  • Red Pack

The report covers exhaustive analysis on

  • Market Segments
  • Market Dynamics
  • Market Size
  • Supply & Demand
  • Current Trends/Issues/Challenges
  • Competition & Companies involved
  • Technology
  • Value Chain

Regional analysis includes

  • North America (USA, Canada)
  • Latin America (Mexico, Brazil and Rest of Latin America)
  • Western Europe (Germany, Italy, France, UK, Spain, Nordic countries, Belgium, Netherlands, Luxembourg and Rest of Western Europe)
  • Eastern Europe (Poland, Russia and Rest of Eastern Europe)
  • Asia Pacific (China, India, ASEAN, Australia & New Zealand)
  • Japan
  • Middle East and Africa (GCC, S. Africa, and Rest of MEA)

The report is a compilation of first-hand information, qualitative and quantitative assessment by industry analysts, inputs from industry experts and industry participants across the value chain. The report provides in-depth analysis of parent market trends, macro-economic indicators and governing factors along with market attractiveness as per segments. The report also maps the qualitative impact of various market factors on market segments and geographies.

Key Segments

By Material:

  • Polyethylene Terephthalate (PET)
  • Polystyrene (PS)
  • High Density Polyethylene (HDPE)
  • Low Density Polyethylene (LDPE)
  • Polyvinyl Chloride (PVC)
  • Others (PLA, PHA, etc)

By Application:

  • Bottles
  • Trays
  • Clamshells
  • Blister Packs
  • Bags & Sacks
  • Pouches & Sachets
  • Cups & Jars
  • Tubs
  • Others

By End Use:

  • Food
  • Beverages
  • Pharmaceuticals
  • Cosmetics and Personal Care
  • Homecare and Toiletries
  • Electronics
  • Others (Packaging for Industrial Purpose)

By Region:

  • North America
  • Latin America
  • Asia Pacific
  • Western Europe
  • Eastern Europe
  • Middle East & Africa

Table of Content

  1. Executive Summary
    • Global Market Outlook
    • Demand-side Trends
    • Supply-side Trends
    • Technology Roadmap Analysis
    • Analysis and Recommendations
  2. Market Overview
    • Market Coverage / Taxonomy
    • Market Definition / Scope / Limitations
  3. Market Background
    • Market Dynamics
      • Drivers
      • Restraints
      • Opportunity
      • Trends
    • Scenario Forecast
      • Demand in Optimistic Scenario
      • Demand in Likely Scenario
      • Demand in Conservative Scenario
    • Opportunity Map Analysis
    • Product Life Cycle Analysis
    • Supply Chain Analysis
      • Supply Side Participants and their Roles
        • Producers
        • Mid-Level Participants (Traders/ Agents/ Brokers)
        • Wholesalers and Distributors
      • Value Added and Value Created at Node in the Supply Chain
      • List of Raw Material Suppliers
      • List of Existing and Potential Buyer’s
    • Investment Feasibility Matrix
    • Value Chain Analysis
      • Profit Margin Analysis
      • Wholesalers and Distributors
      • Retailers
    • PESTLE and Porter’s Analysis
    • Regulatory Landscape
      • By Key Regions
      • By Key Countries
    • Regional Parent Market Outlook
    • Production and Consumption Statistics
    • Import and Export Statistics
  4. Global Market Analysis 2020 to 2024 and Forecast, 2025 to 2035
    • Historical Market Size Value (USD Million) & Volume (Units) Analysis, 2020 to 2024
    • Current and Future Market Size Value (USD Million) & Volume (Units) Projections, 2025 to 2035
      • Y-o-Y Growth Trend Analysis
      • Absolute $ Opportunity Analysis
  5. Global Market Pricing Analysis 2020 to 2024 and Forecast 2025 to 2035
  6. Global Market Analysis 2020 to 2024 and Forecast 2025 to 2035, By Material
    • Introduction / Key Findings
    • Historical Market Size Value (USD Million) & Volume (Units) Analysis By Material, 2020 to 2024
    • Current and Future Market Size Value (USD Million) & Volume (Units) Analysis and Forecast By Material, 2025 to 2035
      • Polyethylene Terephthalate (PET)
      • Polystyrene (PS)
      • High Density Polyethylene (HDPE)
      • Low Density Polyethylene (LDPE)
      • Polyvinyl Chloride (PVC)
      • Others (PLA, PHA, etc)
    • Y-o-Y Growth Trend Analysis By Material, 2020 to 2024
    • Absolute $ Opportunity Analysis By Material, 2025 to 2035
  7. Global Market Analysis 2020 to 2024 and Forecast 2025 to 2035, By Application
    • Introduction / Key Findings
    • Historical Market Size Value (USD Million) & Volume (Units) Analysis By Application, 2020 to 2024
    • Current and Future Market Size Value (USD Million) & Volume (Units) Analysis and Forecast By Application, 2025 to 2035
      • Bottles
      • Trays
      • Clamshells
      • Blister Packs
      • Bags & Sacks
      • Pouches & Sachets
      • Cups & Jars
      • Tubs
      • Others
    • Y-o-Y Growth Trend Analysis By Application, 2020 to 2024
    • Absolute $ Opportunity Analysis By Application, 2025 to 2035
  8. Global Market Analysis 2020 to 2024 and Forecast 2025 to 2035, By End Use
    • Introduction / Key Findings
    • Historical Market Size Value (USD Million) & Volume (Units) Analysis By End Use, 2020 to 2024
    • Current and Future Market Size Value (USD Million) & Volume (Units) Analysis and Forecast By End Use, 2025 to 2035
      • Food
      • Beverages
      • Pharmaceuticals
      • Cosmetics and Personal Care
      • Homecare and Toiletries
      • Electronics
      • Others (Packaging for Industrial Purpose)
    • Y-o-Y Growth Trend Analysis By End Use, 2020 to 2024
    • Absolute $ Opportunity Analysis By End Use, 2025 to 2035
  9. Global Market Analysis 2020 to 2024 and Forecast 2025 to 2035, By Region
    • Introduction
    • Historical Market Size Value (USD Million) & Volume (Units) Analysis By Region, 2020 to 2024
    • Current Market Size Value (USD Million) & Volume (Units) Analysis and Forecast By Region, 2025 to 2035
      • North America
      • Latin America
      • Europe
      • East Asia
      • South Asia
      • Oceania
      • MEA
    • Market Attractiveness Analysis By Region
  10. North America Market Analysis 2020 to 2024 and Forecast 2025 to 2035, By Country
    • Historical Market Size Value (USD Million) & Volume (Units) Trend Analysis By Market Taxonomy, 2020 to 2024
    • Market Size Value (USD Million) & Volume (Units) Forecast By Market Taxonomy, 2025 to 2035
      • By Country
        • USA
        • Canada
      • By Material
      • By Application
      • By End Use
    • Market Attractiveness Analysis
      • By Country
      • By Material
      • By Application
      • By End Use
    • Key Takeaways
  11. Latin America Market Analysis 2020 to 2024 and Forecast 2025 to 2035, By Country
    • Historical Market Size Value (USD Million) & Volume (Units) Trend Analysis By Market Taxonomy, 2020 to 2024
    • Market Size Value (USD Million) & Volume (Units) Forecast By Market Taxonomy, 2025 to 2035
      • By Country
        • Brazil
        • Mexico
        • Argentina
        • Chile
        • Peru
        • Rest of Latin America
      • By Material
      • By Application
      • By End Use
    • Market Attractiveness Analysis
      • By Country
      • By Material
      • By Application
      • By End Use
    • Key Takeaways
  12. Europe Market Analysis 2020 to 2024 and Forecast 2025 to 2035, By Country
    • Historical Market Size Value (USD Million) & Volume (Units) Trend Analysis By Market Taxonomy, 2020 to 2024
    • Market Size Value (USD Million) & Volume (Units) Forecast By Market Taxonomy, 2025 to 2035
      • By Country
        • Germany
        • Italy
        • France
        • UK
        • Spain
        • Russia
        • BENELUX
        • Rest of Europe
      • By Material
      • By Application
      • By End Use
    • Market Attractiveness Analysis
      • By Country
      • By Material
      • By Application
      • By End Use
    • Key Takeaways
  13. East Asia Market Analysis 2020 to 2024 and Forecast 2025 to 2035, By Country
    • Historical Market Size Value (USD Million) & Volume (Units) Trend Analysis By Market Taxonomy, 2020 to 2024
    • Market Size Value (USD Million) & Volume (Units) Forecast By Market Taxonomy, 2025 to 2035
      • By Country
        • China
        • Japan
        • South Korea
      • By Material
      • By Application
      • By End Use
    • Market Attractiveness Analysis
      • By Country
      • By Material
      • By Application
      • By End Use
    • Key Takeaways
  14. South Asia Market Analysis 2020 to 2024 and Forecast 2025 to 2035, By Country
    • Historical Market Size Value (USD Million) & Volume (Units) Trend Analysis By Market Taxonomy, 2020 to 2024
    • Market Size Value (USD Million) & Volume (Units) Forecast By Market Taxonomy, 2025 to 2035
      • By Country
        • India
        • Thailand
        • Malaysia
        • Indonesia
        • Rest of South Asia
      • By Material
      • By Application
      • By End Use
    • Market Attractiveness Analysis
      • By Country
      • By Material
      • By Application
      • By End Use
    • Key Takeaways
  15. Oceania Market Analysis 2020 to 2024 and Forecast 2025 to 2035, By Country
    • Historical Market Size Value (USD Million) & Volume (Units) Trend Analysis By Market Taxonomy, 2020 to 2024
    • Market Size Value (USD Million) & Volume (Units) Forecast By Market Taxonomy, 2025 to 2035
      • By Country
        • Australia
        • New Zealand
      • By Material
      • By Application
      • By End Use
    • Market Attractiveness Analysis
      • By Country
      • By Material
      • By Application
      • By End Use
    • Key Takeaways
  16. MEA Market Analysis 2020 to 2024 and Forecast 2025 to 2035, By Country
    • Historical Market Size Value (USD Million) & Volume (Units) Trend Analysis By Market Taxonomy, 2020 to 2024
    • Market Size Value (USD Million) & Volume (Units) Forecast By Market Taxonomy, 2025 to 2035
      • By Country
        • GCC
        • Rest of MEA
      • By Material
      • By Application
      • By End Use
    • Market Attractiveness Analysis
      • By Country
      • By Material
      • By Application
      • By End Use
    • Key Takeaways
  17. Key Countries Market Analysis
    • USA
      • Pricing Analysis
      • Market Share Analysis, 2024
        • By Material
        • By Application
        • By End Use
    • Canada
      • Pricing Analysis
      • Market Share Analysis, 2024
        • By Material
        • By Application
        • By End Use
    • Brazil
      • Pricing Analysis
      • Market Share Analysis, 2024
        • By Material
        • By Application
        • By End Use
    • Mexico
      • Pricing Analysis
      • Market Share Analysis, 2024
        • By Material
        • By Application
        • By End Use
    • Argentina
      • Pricing Analysis
      • Market Share Analysis, 2024
        • By Material
        • By Application
        • By End Use
  18. Market Structure Analysis
    • Competition Dashboard
    • Competition Benchmarking
    • Market Share Analysis of Top Players
      • By Regional
      • By Material
      • By Application
      • By End Use
  19. Competition Analysis
    • Competition Deep Dive
      • Amcor
        • Overview
        • Product Portfolio
        • Profitability by Market Segments (Product/Age /Sales Channel/Region)
        • Sales Footprint
        • Strategy Overview
          • Marketing Strategy
          • Product Strategy
          • Channel Strategy
      • Berry Global
        • Overview
        • Product Portfolio
        • Profitability by Market Segments (Product/Age /Sales Channel/Region)
        • Sales Footprint
        • Strategy Overview
          • Marketing Strategy
          • Product Strategy
          • Channel Strategy
      • Cambrian Packaging
        • Overview
        • Product Portfolio
        • Profitability by Market Segments (Product/Age /Sales Channel/Region)
        • Sales Footprint
        • Strategy Overview
          • Marketing Strategy
          • Product Strategy
          • Channel Strategy
      • Evergreen Resources
        • Overview
        • Product Portfolio
        • Profitability by Market Segments (Product/Age /Sales Channel/Region)
        • Sales Footprint
        • Strategy Overview
          • Marketing Strategy
          • Product Strategy
          • Channel Strategy
      • Glenroy
        • Overview
        • Product Portfolio
        • Profitability by Market Segments (Product/Age /Sales Channel/Region)
        • Sales Footprint
        • Strategy Overview
          • Marketing Strategy
          • Product Strategy
          • Channel Strategy
      • Longdapac
        • Overview
        • Product Portfolio
        • Profitability by Market Segments (Product/Age /Sales Channel/Region)
        • Sales Footprint
        • Strategy Overview
          • Marketing Strategy
          • Product Strategy
          • Channel Strategy
      • Mondi
        • Overview
        • Product Portfolio
        • Profitability by Market Segments (Product/Age /Sales Channel/Region)
        • Sales Footprint
        • Strategy Overview
          • Marketing Strategy
          • Product Strategy
          • Channel Strategy
      • Proampac
        • Overview
        • Product Portfolio
        • Profitability by Market Segments (Product/Age /Sales Channel/Region)
        • Sales Footprint
        • Strategy Overview
          • Marketing Strategy
          • Product Strategy
          • Channel Strategy
      • PTT Global Chemical
        • Overview
        • Product Portfolio
        • Profitability by Market Segments (Product/Age /Sales Channel/Region)
        • Sales Footprint
        • Strategy Overview
          • Marketing Strategy
          • Product Strategy
          • Channel Strategy
      • Red Pack
        • Overview
        • Product Portfolio
        • Profitability by Market Segments (Product/Age /Sales Channel/Region)
        • Sales Footprint
        • Strategy Overview
          • Marketing Strategy
          • Product Strategy
          • Channel Strategy
  20. Assumptions & Acronyms Used
  21. Research Methodology

List of Tables

  • Table 1: Global Market Value (USD Million) Forecast by Region, 2020-2035
  • Table 2: Global Market Volume (Units) Forecast by Region, 2020-2035
  • Table 3: Global Market Value (USD Million) Forecast by Material, 2020-2035
  • Table 4: Global Market Volume (Units) Forecast by Material, 2020-2035
  • Table 5: Global Market Value (USD Million) Forecast by Application, 2020-2035
  • Table 6: Global Market Volume (Units) Forecast by Application, 2020-2035
  • Table 7: Global Market Value (USD Million) Forecast by End Use, 2020-2035
  • Table 8: Global Market Volume (Units) Forecast by End Use, 2020-2035
  • Table 9: North America Market Value (USD Million) Forecast by Country, 2020-2035
  • Table 10: North America Market Volume (Units) Forecast by Country, 2020-2035
  • Table 11: North America Market Value (USD Million) Forecast by Material, 2020-2035
  • Table 12: North America Market Volume (Units) Forecast by Material, 2020-2035
  • Table 13: North America Market Value (USD Million) Forecast by Application, 2020-2035
  • Table 14: North America Market Volume (Units) Forecast by Application, 2020-2035
  • Table 15: North America Market Value (USD Million) Forecast by End Use, 2020-2035
  • Table 16: North America Market Volume (Units) Forecast by End Use, 2020-2035
  • Table 17: Latin America Market Value (USD Million) Forecast by Country, 2020-2035
  • Table 18: Latin America Market Volume (Units) Forecast by Country, 2020-2035
  • Table 19: Latin America Market Value (USD Million) Forecast by Material, 2020-2035
  • Table 20: Latin America Market Volume (Units) Forecast by Material, 2020-2035
  • Table 21: Latin America Market Value (USD Million) Forecast by Application, 2020-2035
  • Table 22: Latin America Market Volume (Units) Forecast by Application, 2020-2035
  • Table 23: Latin America Market Value (USD Million) Forecast by End Use, 2020-2035
  • Table 24: Latin America Market Volume (Units) Forecast by End Use, 2020-2035
  • Table 25: Europe Market Value (USD Million) Forecast by Country, 2020-2035
  • Table 26: Europe Market Volume (Units) Forecast by Country, 2020-2035
  • Table 27: Europe Market Value (USD Million) Forecast by Material, 2020-2035
  • Table 28: Europe Market Volume (Units) Forecast by Material, 2020-2035
  • Table 29: Europe Market Value (USD Million) Forecast by Application, 2020-2035
  • Table 30: Europe Market Volume (Units) Forecast by Application, 2020-2035
  • Table 31: Europe Market Value (USD Million) Forecast by End Use, 2020-2035
  • Table 32: Europe Market Volume (Units) Forecast by End Use, 2020-2035
  • Table 33: East Asia Market Value (USD Million) Forecast by Country, 2020-2035
  • Table 34: East Asia Market Volume (Units) Forecast by Country, 2020-2035
  • Table 35: East Asia Market Value (USD Million) Forecast by Material, 2020-2035
  • Table 36: East Asia Market Volume (Units) Forecast by Material, 2020-2035
  • Table 37: East Asia Market Value (USD Million) Forecast by Application, 2020-2035
  • Table 38: East Asia Market Volume (Units) Forecast by Application, 2020-2035
  • Table 39: East Asia Market Value (USD Million) Forecast by End Use, 2020-2035
  • Table 40: East Asia Market Volume (Units) Forecast by End Use, 2020-2035
  • Table 41: South Asia Market Value (USD Million) Forecast by Country, 2020-2035
  • Table 42: South Asia Market Volume (Units) Forecast by Country, 2020-2035
  • Table 43: South Asia Market Value (USD Million) Forecast by Material, 2020-2035
  • Table 44: South Asia Market Volume (Units) Forecast by Material, 2020-2035
  • Table 45: South Asia Market Value (USD Million) Forecast by Application, 2020-2035
  • Table 46: South Asia Market Volume (Units) Forecast by Application, 2020-2035
  • Table 47: South Asia Market Value (USD Million) Forecast by End Use, 2020-2035
  • Table 48: South Asia Market Volume (Units) Forecast by End Use, 2020-2035
  • Table 49: Oceania Market Value (USD Million) Forecast by Country, 2020-2035
  • Table 50: Oceania Market Volume (Units) Forecast by Country, 2020-2035
  • Table 51: Oceania Market Value (USD Million) Forecast by Material, 2020-2035
  • Table 52: Oceania Market Volume (Units) Forecast by Material, 2020-2035
  • Table 53: Oceania Market Value (USD Million) Forecast by Application, 2020-2035
  • Table 54: Oceania Market Volume (Units) Forecast by Application, 2020-2035
  • Table 55: Oceania Market Value (USD Million) Forecast by End Use, 2020-2035
  • Table 56: Oceania Market Volume (Units) Forecast by End Use, 2020-2035
  • Table 57: MEA Market Value (USD Million) Forecast by Country, 2020-2035
  • Table 58: MEA Market Volume (Units) Forecast by Country, 2020-2035
  • Table 59: MEA Market Value (USD Million) Forecast by Material, 2020-2035
  • Table 60: MEA Market Volume (Units) Forecast by Material, 2020-2035
  • Table 61: MEA Market Value (USD Million) Forecast by Application, 2020-2035
  • Table 62: MEA Market Volume (Units) Forecast by Application, 2020-2035
  • Table 63: MEA Market Value (USD Million) Forecast by End Use, 2020-2035
  • Table 64: MEA Market Volume (Units) Forecast by End Use, 2020-2035

List of Figures

  • Figure 1: Global Market Volume (Units) Forecast 2020-2035
  • Figure 2: Global Market Pricing Analysis
  • Figure 3: Global Market Value (USD Million) Forecast 2020-2035
  • Figure 4: Global Market Value Share and BPS Analysis by Material, 2025 and 2035
  • Figure 5: Global Market Y-o-Y Growth Comparison by Material, 2025-2035
  • Figure 6: Global Market Attractiveness Analysis by Material
  • Figure 7: Global Market Value Share and BPS Analysis by Application, 2025 and 2035
  • Figure 8: Global Market Y-o-Y Growth Comparison by Application, 2025-2035
  • Figure 9: Global Market Attractiveness Analysis by Application
  • Figure 10: Global Market Value Share and BPS Analysis by End Use, 2025 and 2035
  • Figure 11: Global Market Y-o-Y Growth Comparison by End Use, 2025-2035
  • Figure 12: Global Market Attractiveness Analysis by End Use
  • Figure 13: Global Market Value (USD Million) Share and BPS Analysis by Region, 2025 and 2035
  • Figure 14: Global Market Y-o-Y Growth Comparison by Region, 2025-2035
  • Figure 15: Global Market Attractiveness Analysis by Region
  • Figure 16: North America Market Incremental $ Opportunity, 2025-2035
  • Figure 17: Latin America Market Incremental $ Opportunity, 2025-2035
  • Figure 18: Europe Market Incremental $ Opportunity, 2025-2035
  • Figure 19: East Asia Market Incremental $ Opportunity, 2025-2035
  • Figure 20: South Asia Market Incremental $ Opportunity, 2025-2035
  • Figure 21: Oceania Market Incremental $ Opportunity, 2025-2035
  • Figure 22: MEA Market Incremental $ Opportunity, 2025-2035
  • Figure 23: North America Market Value Share and BPS Analysis by Country, 2025 and 2035
  • Figure 24: North America Market Value Share and BPS Analysis by Material, 2025 and 2035
  • Figure 25: North America Market Y-o-Y Growth Comparison by Material, 2025-2035
  • Figure 26: North America Market Attractiveness Analysis by Material
  • Figure 27: North America Market Value Share and BPS Analysis by Application, 2025 and 2035
  • Figure 28: North America Market Y-o-Y Growth Comparison by Application, 2025-2035
  • Figure 29: North America Market Attractiveness Analysis by Application
  • Figure 30: North America Market Value Share and BPS Analysis by End Use, 2025 and 2035
  • Figure 31: North America Market Y-o-Y Growth Comparison by End Use, 2025-2035
  • Figure 32: North America Market Attractiveness Analysis by End Use
  • Figure 33: Latin America Market Value Share and BPS Analysis by Country, 2025 and 2035
  • Figure 34: Latin America Market Value Share and BPS Analysis by Material, 2025 and 2035
  • Figure 35: Latin America Market Y-o-Y Growth Comparison by Material, 2025-2035
  • Figure 36: Latin America Market Attractiveness Analysis by Material
  • Figure 37: Latin America Market Value Share and BPS Analysis by Application, 2025 and 2035
  • Figure 38: Latin America Market Y-o-Y Growth Comparison by Application, 2025-2035
  • Figure 39: Latin America Market Attractiveness Analysis by Application
  • Figure 40: Latin America Market Value Share and BPS Analysis by End Use, 2025 and 2035
  • Figure 41: Latin America Market Y-o-Y Growth Comparison by End Use, 2025-2035
  • Figure 42: Latin America Market Attractiveness Analysis by End Use
  • Figure 43: Europe Market Value Share and BPS Analysis by Country, 2025 and 2035
  • Figure 44: Europe Market Value Share and BPS Analysis by Material, 2025 and 2035
  • Figure 45: Europe Market Y-o-Y Growth Comparison by Material, 2025-2035
  • Figure 46: Europe Market Attractiveness Analysis by Material
  • Figure 47: Europe Market Value Share and BPS Analysis by Application, 2025 and 2035
  • Figure 48: Europe Market Y-o-Y Growth Comparison by Application, 2025-2035
  • Figure 49: Europe Market Attractiveness Analysis by Application
  • Figure 50: Europe Market Value Share and BPS Analysis by End Use, 2025 and 2035
  • Figure 51: Europe Market Y-o-Y Growth Comparison by End Use, 2025-2035
  • Figure 52: Europe Market Attractiveness Analysis by End Use
  • Figure 53: East Asia Market Value Share and BPS Analysis by Country, 2025 and 2035
  • Figure 54: East Asia Market Value Share and BPS Analysis by Material, 2025 and 2035
  • Figure 55: East Asia Market Y-o-Y Growth Comparison by Material, 2025-2035
  • Figure 56: East Asia Market Attractiveness Analysis by Material
  • Figure 57: East Asia Market Value Share and BPS Analysis by Application, 2025 and 2035
  • Figure 58: East Asia Market Y-o-Y Growth Comparison by Application, 2025-2035
  • Figure 59: East Asia Market Attractiveness Analysis by Application
  • Figure 60: East Asia Market Value Share and BPS Analysis by End Use, 2025 and 2035
  • Figure 61: East Asia Market Y-o-Y Growth Comparison by End Use, 2025-2035
  • Figure 62: East Asia Market Attractiveness Analysis by End Use
  • Figure 63: South Asia Market Value Share and BPS Analysis by Country, 2025 and 2035
  • Figure 64: South Asia Market Value Share and BPS Analysis by Material, 2025 and 2035
  • Figure 65: South Asia Market Y-o-Y Growth Comparison by Material, 2025-2035
  • Figure 66: South Asia Market Attractiveness Analysis by Material
  • Figure 67: South Asia Market Value Share and BPS Analysis by Application, 2025 and 2035
  • Figure 68: South Asia Market Y-o-Y Growth Comparison by Application, 2025-2035
  • Figure 69: South Asia Market Attractiveness Analysis by Application
  • Figure 70: South Asia Market Value Share and BPS Analysis by End Use, 2025 and 2035
  • Figure 71: South Asia Market Y-o-Y Growth Comparison by End Use, 2025-2035
  • Figure 72: South Asia Market Attractiveness Analysis by End Use
  • Figure 73: Oceania Market Value Share and BPS Analysis by Country, 2025 and 2035
  • Figure 74: Oceania Market Value Share and BPS Analysis by Material, 2025 and 2035
  • Figure 75: Oceania Market Y-o-Y Growth Comparison by Material, 2025-2035
  • Figure 76: Oceania Market Attractiveness Analysis by Material
  • Figure 77: Oceania Market Value Share and BPS Analysis by Application, 2025 and 2035
  • Figure 78: Oceania Market Y-o-Y Growth Comparison by Application, 2025-2035
  • Figure 79: Oceania Market Attractiveness Analysis by Application
  • Figure 80: Oceania Market Value Share and BPS Analysis by End Use, 2025 and 2035
  • Figure 81: Oceania Market Y-o-Y Growth Comparison by End Use, 2025-2035
  • Figure 82: Oceania Market Attractiveness Analysis by End Use
  • Figure 83: MEA Market Value Share and BPS Analysis by Country, 2025 and 2035
  • Figure 84: MEA Market Value Share and BPS Analysis by Material, 2025 and 2035
  • Figure 85: MEA Market Y-o-Y Growth Comparison by Material, 2025-2035
  • Figure 86: MEA Market Attractiveness Analysis by Material
  • Figure 87: MEA Market Value Share and BPS Analysis by Application, 2025 and 2035
  • Figure 88: MEA Market Y-o-Y Growth Comparison by Application, 2025-2035
  • Figure 89: MEA Market Attractiveness Analysis by Application
  • Figure 90: MEA Market Value Share and BPS Analysis by End Use, 2025 and 2035
  • Figure 91: MEA Market Y-o-Y Growth Comparison by End Use, 2025-2035
  • Figure 92: MEA Market Attractiveness Analysis by End Use
  • Figure 93: Global Market - Tier Structure Analysis
  • Figure 94: Global Market - Company Share Analysis

Explore Similar Insights

Future Market Insights

Post-Consumer Recycled Plastic Packaging Market