Recycled PET Packaging Market Size and Share Forecast Outlook 2025 to 2035

The global Recycled PET packaging market was valued at approximately USD 3,649.9 million in 2025 and is projected to reach USD 6,723.9 million by 2035, reflecting a robust CAGR of 6.3% during this period.
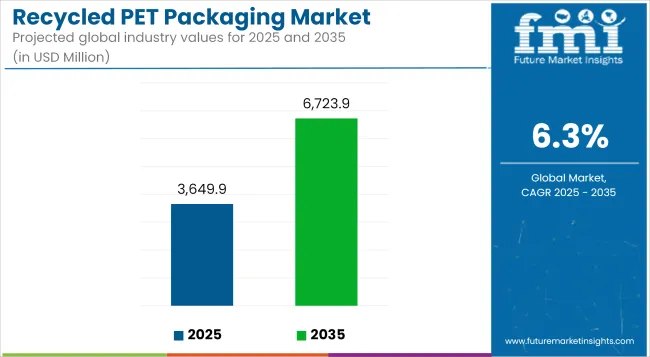
Quick Stats of Recycled PET Packaging Market

  • Market Value (2025): USD 3,649.9 million
  • Forecast Value (2035): USD 6,723.9 million
  • Forecast CAGR: 6.3%
  • Packaging Leader in 2025: Bottles & Jars (41.6% market share)
  • Top End-use Industry: Food and Beverages (54.2% share)
  • Key Growth Region: USA is the fastest-growing market with 6.5% CAGR

Recycled Pet Packaging Market Industry Value Analysis

Metric Value
Market Size (2025E) USD 3,649.9 Million
Market Value (2035F) USD 6,723.9 Million
CAGR (2025 to 2035) 6.3%

Growth has been supported by increasing environmental awareness, government mandates on recycled content, and consumer preference for sustainable packaging solutions. Stringent regulations, such as the EU’s recycled PET mandates and Extended Producer Responsibility (EPR) programs in APAC, have further propelled market expansion.

Demand has been especially pronounced in food & beverage, personal care, and pharmaceutical sectors where brand reputation and regulatory compliance are essential. Innovations in rPET processing technologies have enabled producers to meet both functional requirements and eco‑friendly KPIs, ensuring that brands remain competitive amid rising sustainability expectations.

In October 2024, PLYMOUTH, Mich., announced Plastipak Packaging, Inc., a wholly-owned subsidiary of Plastipak Holdings, Inc. (Plastipak), has announced that its founder President and CEO William C. Young will transition out of his role and welcome the next generation of leadership, Edward V. Morgan.

The recycled PET packaging market has been significantly shaped by the growing emphasis on sustainability, circular economy practices, and regulatory mandates that encourage the reduction of virgin plastic usage. Advancements in recycling technologies especially synthetic and mechanical reusing methods have allowed for the creation of high-quality rPET suitable for various applications, including bottles & jars, trays, clamshells, and pouches.

These formats are increasingly adopted across the food & beverage industry and personal care segments due to their durability, clarity, and environmental appeal. Consumer goods and healthcare sectors have also shown rising adoption, utilizing rPET-based films, sheets, and tubs for safe, lightweight, and cost-effective packaging. This shift has been supported by consumer demand for low-impact packaging and retailers’ preference for packaging with transparent recycled content certification.

The recycled PET packaging sales is poised for continued expansion, driven by the accelerating adoption of rPET in fast-moving consumer goods, personal care, and retail & e-commerce segments. The market’s trajectory suggests growing demand for customizable, recyclable packaging solutions that meet both corporate sustainability targets and global regulatory benchmarks.

Companies investing in closed-loop systems, mono-material packaging designs, and advanced sorting technologies are expected to gain a competitive advantage. The integration of eco-labels, intelligent tracking systems, and lightweight rPET formats will play a pivotal role in shaping future packaging strategies.

With rPET increasingly replacing virgin plastics across applications from pharmaceutical packs to industrial containers the market is expected to play a critical role in advancing the global shift toward responsible packaging practices.

Analyzing Recycled PET Packaging Market by Top Investment Segments

The Recycled PET (rPET) Packaging Market is segmented by packaging type, recycling process, application, and end-use industry. By packaging type, the market includes bottles & jars, trays & clamshells, pouches & sachets, films & sheets, containers & tubs, and others. Among these, bottles & jars represent a dominant investment segment, largely driven by their extensive use in beverages and personal care products. In terms of recycling process, the market is categorized into synthetic recycling and mechanical reusing, with mechanical reusing leading due to its economic feasibility and lower environmental footprint. From an end-use industry perspective, the key sectors include food & beverage, healthcare, personal care, retail & e-commerce, and industrial packaging. The food & beverage industry remains the top investor in rPET packaging solutions, propelled by sustainability mandates, consumer demand for eco-conscious brands, and stringent packaging regulations across developed markets.

Bottles and Jars Drive Recycled PET Demand across Beverage and Personal Care

Bottles and jars are projected to account for 41.6% of the recycled PET (rPET) packaging market by 2025, solidifying their position as the most dominant packaging format. Their widespread usage is attributed to the inherent properties of PET including high clarity, lightweight structure, barrier performance, and excellent recyclability which are retained even in recycled formats.

Within this category, single-use water bottles and carbonated soft drink bottles form the largest volume of rPET consumption. These formats are critical to the beverage industry, where major global brands such as Coca-Cola, PepsiCo, and Nestlé have pledged to use up to 50-100% rPET content in their primary packaging as part of their sustainable packaging roadmaps. The recyclability of PET bottles makes them a primary feedstock for rPET manufacturing, and their established collection infrastructure supports large-scale recycling efforts across developed and emerging markets.

Beyond beverages, personal care jars and bottles, used for products like creams, shampoos, and body lotions, have seen significant penetration of rPET. With consumers increasingly demanding plastic-free and low-carbon alternatives, brands are adopting transparent and tinted rPET jars that combine aesthetics with eco-credentials.
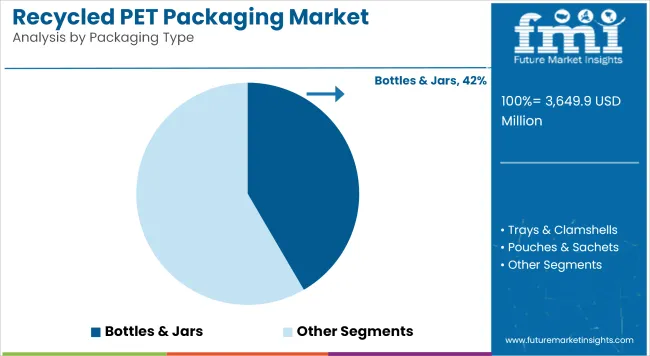
Recycled Pet Packaging Market Analysis By Packaging Type

Food & Beverage Industry Captures Recycled PET Packaging Demand by 2025 Amid Push for Circular Packaging Solutions

The food and beverage industry is projected to contribute approximately 54.2% of the global recycled PET (rPET) packaging market value by 2025, driven by rising regulatory mandates, brand sustainability commitments, and consumer demand for environmentally responsible packaging. Recycled PET has become the material of choice for bottling water, carbonated soft drinks, juices, ready-to-drink teas, and increasingly for food trays, clamshells, and flexible films.

Major food and beverage brands are pledging to use 25&-50% rPET content in their packaging by 2025-2030 as part of global plastic reduction goals, with the EU’s Single-Use Plastics Directive and the USA Plastics Pact accelerating adoption. Bottled water alone represents one of the largest rPET applications, with many brands already transitioning to 100% rPET bottles in key markets.

rPET offers excellent clarity, strength, and barrier properties comparable to virgin PET, making it ideal for food-safe applications. Its recyclability and lightweight nature further contribute to reductions in carbon footprint and logistics costs.

Technological improvements in food-grade rPET production-such as enhanced decontamination processes and closed-loop recycling systems-are also boosting confidence among food manufacturers. As a result, rPET packaging is expected to maintain strong momentum in the food and beverage sector, with demand forecast to exceed 2.1 million metric tons annually by 2027, firmly establishing it as the leading end-use industry in the global rPET packaging landscape.
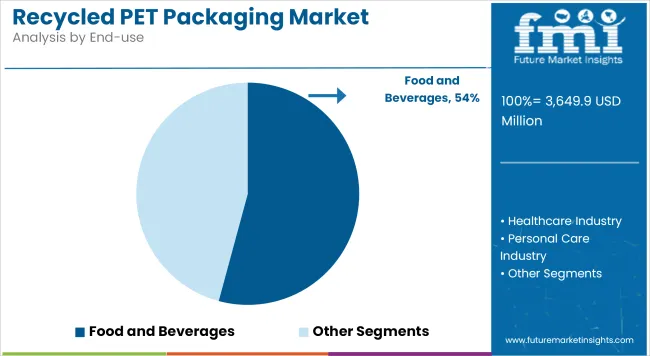
Recycled Pet Packaging Market Analysis By End Use

Challenges and Opportunities

Challenges

Recycling Contamination and High Processing Costs

One big challenge in the recycled PET packaging market is the contamination in the recycling process. This can harm the quality and use of rPET for food containers. Another issue is the high cost of new PET recycling technology, especially chemical recycling. It makes large-scale production hard and costly.

Also, not having the same global rules on recycled content causes uneven use of rPET in different fields and places.

Opportunities

Chemical Recycling Innovations, Refillable Packaging Models, and Biodegradable rPET

Though there are difficulties, the recycled PET packaging market has big chances to grow. The rise of better recycling methods, which make pure rPET with little damage, is helping the market and making it safe for food use.

The growth of refill models, which support ongoing recycling and longer product life, is building new ways for companies to do business. Also, the rise in use of biodegradable rPET mixes, which give better green benefits and stay strong, is likely to help market growth.

New rPET flexible packs, light bottles, and compost-ready rPET choices, aimed at green-minded shoppers and meeting company green goals, are also set to help the market grow faster.
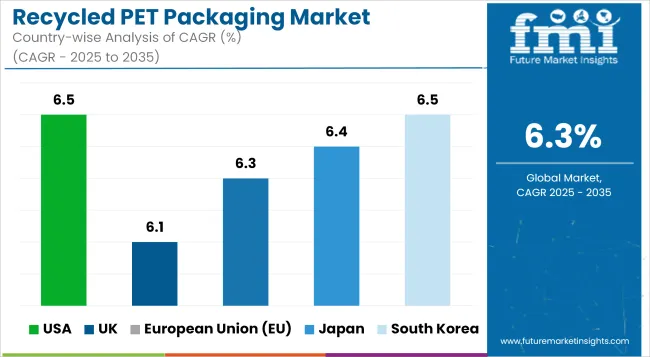
Country-wise Insights

Recycled Pet Packaging Market Cagr Analysis By Country

United States

The market for recycled PET (rPET) packaging in the USA is growing steadily. This growth is due to more rules about plastic waste, higher consumer demand for eco-friendly packages, and big investments in recycling facilities. The EPA and FDA set the safety and recycling standards for rPET packages.

Food-grade rPET uses are expanding. More rPET is used in drink bottles and care product packages. Investments are increasing in systems to recycle and reuse materials. Also, new tech in chemical recycling is making rPET better and cleaner. These changes are guiding trends in the industry.

Country CAGR (2025 to 2035)
USA 6.5%

United Kingdom

The recycled PET (rPET) packagingmarket in the UK is growing fast. This is because the government has tough rules on using plastics only once, and there is more money going into recycling projects. Stores and retailers are also working hard to use more recycled plastic. Two important groups, the UK Environment Agency and the British Plastics Federation, make sure the packaging rules are followed and recycling goals are met.

The market is seeing more recycled plastic used in food, drink, cosmetics, and medicine packaging. Plans to recycle plastic bottles through return schemes are helping this growth. There are also new, strong, and light recycled plastic packages for shipping and shopping online. These new ideas are shaping the industry.

Country CAGR (2025 to 2035)
UK 6.1%

European Union

The recycled PET packaging market in the European Union is growing well. This is all because of strict regulation of recycling plastic, increased application of rPET in food, and additional expenditure on new methods of sorting and recycling plastic. The European Chemicals Agency and the European Commission's plans control the application, safety, and recycling of rPET.

Germany, France, and Italy are at the forefront of utilising food-safe rPET. They are also putting more money into recycling factories for PET and expanding brand promises to use rPET. Besides, the rise in rPET use for flexible packaging and shaped containers is helping the market grow.

Country CAGR (2025 to 2035)
European Union (EU) 6.3%

Japan

The recycled PET (rPET) packaging market in Japan is growing. This is due to strong efforts by the government to cut down on plastic waste and a rising use of rPET in drink bottles and care products. More money is also being put into high-tech recycling methods. The Ministry of the Environment and the Japan PET Bottle Recycling Association (JPR) oversee the safety and green practices of rPET packaging.

Japanese firms are putting money into recycling PET bottles in a loop and making bio-rPET materials better. They are also working on super-clean ways to recycle for food. On top of that, new uses of rPET in electronics and industry are setting new trends in the market.

Country CAGR (2025 to 2035)
Japan 6.4%

South Korea

The recycled PET (rPET) packaging South Korea is growing fast. This is due to the government pushing for recycled packaging, a need for eco-friendly options, and more use of rPET in packaging. The Ministry of Environment and the Korea Packaging Recycling Cooperative (KPRC) manage the recycling rules.

More use of clear rPET for food and drinks, more money put into recycling plants, and better tech for collecting waste are key trends. Also, new investments in AI sorting and better cleaning methods are speeding up rPET use. Together, these factors drive market growth.

Country CAGR (2025 to 2035)
South Korea 6.5%

Competitive Outlook

The recycled PET (rPET) packaging market is growing as more people want sustainable packaging. Governments have rules to cut down on plastic waste. Consumers also choose green products more often now. The market benefits from new PET recycling methods. More companies are following circular economy ideas and using rPET in food, drinks, and personal care packages.

Firms aim to make high-quality, safe, and light rPET to help the environment, improve their brand, and meet rules. This market includes top packaging makers, recycling tech firms, and big drink companies. They are all working on better ways to recycle, make biodegradable PET, and produce clear rPET.

Other Key Players

  • CarbonLITE Industries
  • Phoenix Technologies International, LLC
  • Envision Plastics
  • Veolia Environnement S.A.
  • Clear Path Recycling

Key Segmentation

By Packaging Type:

  • Bottles & Jars
  • Trays & Clamshells
  • Pouches & Sachets
  • Films & Sheets
  • Containers & Tubs
  • Others

By Recycling Process:

  • Synthetic
  • Mechanical reusing

By End-Use Industry:

  • Food & Beverage Industry
  • Healthcare Industry
  • Personal Care Industry
  • Retail & E-commerce
  • Industrial Packaging

By Region:

  • North America
  • Latin America
  • East Asia
  • South Asia & Pacific
  • Eastern Europe
  • Western Europe
  • Oceania
  • Middle East & Africa

Table of Content

  1. Executive Summary
    • Global Market Outlook
    • Demand-side Trends
    • Supply-side Trends
    • Technology Roadmap Analysis
    • Analysis and Recommendations
  2. Market Overview
    • Market Coverage / Taxonomy
    • Market Definition / Scope / Limitations
  3. Market Background
    • Market Dynamics
      • Drivers
      • Restraints
      • Opportunity
      • Trends
    • Scenario Forecast
      • Demand in Optimistic Scenario
      • Demand in Likely Scenario
      • Demand in Conservative Scenario
    • Opportunity Map Analysis
    • Product Life Cycle Analysis
    • Supply Chain Analysis
      • Supply Side Participants and their Roles
        • Producers
        • Mid-Level Participants (Traders/ Agents/ Brokers)
        • Wholesalers and Distributors
      • Margin in the Supply Chain
      • List of Raw Material Suppliers
      • List of Existing and Potential Buyer’s
    • Investment Feasibility Matrix
    • Value Chain Analysis
      • Profit Margin Analysis
      • Wholesalers and Distributors
      • Retailers
    • PESTLE and Porter’s Analysis
    • Regulatory Landscape
      • By Key Regions
      • By Key Countries
    • Regional Parent Market Outlook
    • Production and Consumption Statistics
    • Import and Export Statistics
  4. Global Market Analysis 2020-2024 and Forecast, 2025-2035
    • Historical Market Size Value (USD Million) & Volume (Units) Analysis, 2020-2024
    • Current and Future Market Size Value (USD Million) & Volume (Units) Projections, 2025-2035
      • Y-o-Y Growth Trend Analysis
      • Absolute $ Opportunity Analysis
  5. Global Market Analysis 2020-2024 and Forecast 2025-2035, By Packaging Type
    • Introduction / Key Findings
    • Historical Market Size Value (USD Million) & Volume (Units) Analysis By By Packaging Type, 2020-2024
    • Current and Future Market Size Value (USD Million) & Volume (Units) Analysis and Forecast By By Packaging Type, 2025-2035
      • Bottles & Jars
      • Trays & Clamshells
      • Pouches & Sachets
      • Films & Sheets
      • Containers & Tubs
      • Others
    • Y-o-Y Growth Trend Analysis By By Packaging Type, 2020-2024
    • Absolute $ Opportunity Analysis By By Packaging Type, 2025-2035
  6. Global Market Analysis 2020-2024 and Forecast 2025-2035, By Recycling Process
    • Introduction / Key Findings
    • Historical Market Size Value (USD Million) & Volume (Units) Analysis By By Recycling Process, 2020-2024
    • Current and Future Market Size Value (USD Million) & Volume (Units) Analysis and Forecast By By Recycling Process, 2025-2035
      • Synthetic
      • Mechanical reusing
    • Y-o-Y Growth Trend Analysis By By Recycling Process, 2020-2024
    • Absolute $ Opportunity Analysis By By Recycling Process, 2025-2035
  7. Global Market Analysis 2020-2024 and Forecast 2025-2035, By Application
    • Introduction / Key Findings
    • Historical Market Size Value (USD Million) & Volume (Units) Analysis By By Application, 2020-2024
    • Current and Future Market Size Value (USD Million) & Volume (Units) Analysis and Forecast By By Application, 2025-2035
      • Drugs
      • Refreshments
      • Individual Consideration
      • Customer Merchandise
      • Others
    • Y-o-Y Growth Trend Analysis By By Application, 2020-2024
    • Absolute $ Opportunity Analysis By Application, 2025-2035
  8. Global Market Analysis 2020-2024 and Forecast 2025-2035, By End-Use Industry
    • Introduction / Key Findings
    • Historical Market Size Value (USD Million) & Volume (Units) Analysis By By End-Use Industry, 2020-2024
    • Current and Future Market Size Value (USD Million) & Volume (Units) Analysis and Forecast By By End-Use Industry, 2025-2035
      • Food & Beverage Industry
      • Healthcare Industry
      • Personal Care Industry
      • Retail & E-commerce
      • Industrial Packaging
    • Y-o-Y Growth Trend Analysis By By End-Use Industry, 2020-2024
    • Absolute $ Opportunity Analysis By By End-Use Industry, 2025-2035
  9. Global Market Analysis 2020-2024 and Forecast 2025-2035, By Region
    • Introduction
    • Historical Market Size Value (USD Million) & Volume (Units) Analysis By Region, 2020-2024
    • Current Market Size Value (USD Million) & Volume (Units) Analysis and Forecast By Region, 2025-2035
      • North America
      • Latin America
      • Europe
      • East Asia
      • South Asia
      • Oceania
      • MEA
    • Market Attractiveness Analysis By Region
  10. North America Market Analysis 2020-2024 and Forecast 2025-2035, By Country
    • Historical Market Size Value (USD Million) & Volume (Units) Trend Analysis By Market Taxonomy, 2020-2024
    • Market Size Value (USD Million) & Volume (Units) Forecast By Market Taxonomy, 2025-2035
      • By Country
        • USA
        • Canada
      • By By Packaging Type
      • By By Recycling Process
      • By By Application
      • By By End-Use Industry
    • Market Attractiveness Analysis
      • By Country
      • By By Packaging Type
      • By By Recycling Process
      • By By Application
      • By By End-Use Industry
    • Key Takeaways
  11. Latin America Market Analysis 2020-2024 and Forecast 2025-2035, By Country
    • Historical Market Size Value (USD Million) & Volume (Units) Trend Analysis By Market Taxonomy, 2020-2024
    • Market Size Value (USD Million) & Volume (Units) Forecast By Market Taxonomy, 2025-2035
      • By Country
        • Brazil
        • Mexico
        • Argentina
        • Chile
        • Peru
        • Rest of Latin America
      • By Packaging Type
      • By Recycling Process
      • By Application
      • By End-Use Industry
    • Market Attractiveness Analysis
      • By Country
      • By Packaging Type
      • By Recycling Process
      • By Application
      • By End-Use Industry
    • Key Takeaways
  12. Europe Market Analysis 2020-2024 and Forecast 2025-2035, By Country
    • Historical Market Size Value (USD Million) & Volume (Units) Trend Analysis By Market Taxonomy, 2020-2024
    • Market Size Value (USD Million) & Volume (Units) Forecast By Market Taxonomy, 2025-2035
      • By Country
        • Germany
        • Italy
        • France
        • UK
        • Spain
        • Russia
        • BENELUX
        • Rest of Europe
      • By Packaging Type
      • By Recycling Process
      • By Application
      • By End-Use Industry
    • Market Attractiveness Analysis
      • By Country
      • By Packaging Type
      • By Recycling Process
      • By Application
      • By End-Use Industry
    • Key Takeaways
  13. East Asia Market Analysis 2020-2024 and Forecast 2025-2035, By Country
    • Historical Market Size Value (USD Million) & Volume (Units) Trend Analysis By Market Taxonomy, 2020-2024
    • Market Size Value (USD Million) & Volume (Units) Forecast By Market Taxonomy, 2025-2035
      • By Country
        • China
        • Japan
        • South Korea
      • By Packaging Type
      • By Recycling Process
      • By Application
      • By End-Use Industry
    • Market Attractiveness Analysis
      • By Country
      • By Packaging Type
      • By Recycling Process
      • By Application
      • By End-Use Industry
    • Key Takeaways
  14. South Asia Market Analysis 2020-2024 and Forecast 2025-2035, By Country
    • Historical Market Size Value (USD Million) & Volume (Units) Trend Analysis By Market Taxonomy, 2020-2024
    • Market Size Value (USD Million) & Volume (Units) Forecast By Market Taxonomy, 2025-2035
      • By Country
        • India
        • Thailand
        • Malaysia
        • Indonesia
        • Rest of South Asia
      • By Packaging Type
      • By Recycling Process
      • By Application
      • By End-Use Industry
    • Market Attractiveness Analysis
      • By Country
      • By Packaging Type
      • By Recycling Process
      • By Application
      • By End-Use Industry
    • Key Takeaways
  15. Oceania Market Analysis 2020-2024 and Forecast 2025-2035, By Country
    • Historical Market Size Value (USD Million) & Volume (Units) Trend Analysis By Market Taxonomy, 2020-2024
    • Market Size Value (USD Million) & Volume (Units) Forecast By Market Taxonomy, 2025-2035
      • By Country
        • Australia
        • New Zealand
      • By Packaging Type
      • By Recycling Process
      • By Application
      • By End-Use Industry
    • Market Attractiveness Analysis
      • By Country
      • By Packaging Type
      • By Recycling Process
      • By Application
      • By End-Use Industry
    • Key Takeaways
  16. MEA Market Analysis 2020-2024 and Forecast 2025-2035, By Country
    • Historical Market Size Value (USD Million) & Volume (Units) Trend Analysis By Market Taxonomy, 2020-2024
    • Market Size Value (USD Million) & Volume (Units) Forecast By Market Taxonomy, 2025-2035
      • By Country
        • GCC
        • Rest of MEA
      • By Packaging Type
      • By Recycling Process
      • By Application
      • By End-Use Industry
    • Market Attractiveness Analysis
      • By Country
      • By Packaging Type
      • By Recycling Process
      • By Application
      • By End-Use Industry
    • Key Takeaways
  17. Key Countries Market Analysis
    • USA
      • Pricing Analysis
      • Market Share Analysis, 2024
        • By Packaging Type
        • By Recycling Process
        • By Application
        • By End-Use Industry
    • Canada
      • Pricing Analysis
      • Market Share Analysis, 2024
        • By Packaging Type
        • By Recycling Process
        • By Application
        • By End-Use Industry
    • Brazil
      • Pricing Analysis
      • Market Share Analysis, 2024
        • By Packaging Type
        • By Recycling Process
        • By Application
        • By End-Use Industry
    • Mexico
      • Pricing Analysis
      • Market Share Analysis, 2024
        • By Packaging Type
        • By Recycling Process
        • By Application
        • By End-Use Industry
    • Argentina
      • Pricing Analysis
      • Market Share Analysis, 2024
        • By Packaging Type
        • By Recycling Process
        • By Application
        • By End-Use Industry
  18. Market Structure Analysis
    • Competition Dashboard
    • Competition Benchmarking
    • Market Share Analysis of Top Players
      • By Regional
      • By Packaging Type
      • By Recycling Process
      • By Application
      • By End-Use Industry
  19. Competition Analysis
    • Competition Deep Dive
      • Plastipak Holdings
        • Overview
        • Product Portfolio
        • Profitability by Market Segments (Product/Age /Sales Channel/Region)
        • Sales Footprint
        • Strategy Overview
          • Marketing Strategy
          • Product Strategy
          • Channel Strategy
      • Indorama Ventures
        • Overview
        • Product Portfolio
        • Profitability by Market Segments (Product/Age /Sales Channel/Region)
        • Sales Footprint
        • Strategy Overview
          • Marketing Strategy
          • Product Strategy
          • Channel Strategy
      • ALPLA Group
        • Overview
        • Product Portfolio
        • Profitability by Market Segments (Product/Age /Sales Channel/Region)
        • Sales Footprint
        • Strategy Overview
          • Marketing Strategy
          • Product Strategy
          • Channel Strategy
      • Veolia Environnement
        • Overview
        • Product Portfolio
        • Profitability by Market Segments (Product/Age /Sales Channel/Region)
        • Sales Footprint
        • Strategy Overview
          • Marketing Strategy
          • Product Strategy
          • Channel Strategy
      • Loop Industries
        • Overview
        • Product Portfolio
        • Profitability by Market Segments (Product/Age /Sales Channel/Region)
        • Sales Footprint
        • Strategy Overview
          • Marketing Strategy
          • Product Strategy
          • Channel Strategy
      • Evergreen
        • Overview
        • Product Portfolio
        • Profitability by Market Segments (Product/Age /Sales Channel/Region)
        • Sales Footprint
        • Strategy Overview
          • Marketing Strategy
          • Product Strategy
          • Channel Strategy
      • Phoenix Technologies
        • Overview
        • Product Portfolio
        • Profitability by Market Segments (Product/Age /Sales Channel/Region)
        • Sales Footprint
        • Strategy Overview
          • Marketing Strategy
          • Product Strategy
          • Channel Strategy
      • Far Eastern New Century
        • Overview
        • Product Portfolio
        • Profitability by Market Segments (Product/Age /Sales Channel/Region)
        • Sales Footprint
        • Strategy Overview
          • Marketing Strategy
          • Product Strategy
          • Channel Strategy
      • Clear Path Recycling
        • Overview
        • Product Portfolio
        • Profitability by Market Segments (Product/Age /Sales Channel/Region)
        • Sales Footprint
        • Strategy Overview
          • Marketing Strategy
          • Product Strategy
          • Channel Strategy
      • Shaw Industries
        • Overview
        • Product Portfolio
        • Profitability by Market Segments (Product/Age /Sales Channel/Region)
        • Sales Footprint
        • Strategy Overview
          • Marketing Strategy
          • Product Strategy
          • Channel Strategy
  20. Assumptions & Acronyms Used
  21. Research Methodology

List of Tables

  • Table 1: Global Market Value (USD Million) Forecast by Region, 2020-2035
  • Table 2: Global Market Volume (Units) Forecast by Region, 2020-2035
  • Table 3: Global Market Value (USD Million) Forecast by By Packaging Type, 2020-2035
  • Table 4: Global Market Volume (Units) Forecast by By Packaging Type, 2020-2035
  • Table 5: Global Market Value (USD Million) Forecast by By Recycling Process, 2020-2035
  • Table 6: Global Market Volume (Units) Forecast by By Recycling Process, 2020-2035
  • Table 7: Global Market Value (USD Million) Forecast by By Application, 2020-2035
  • Table 8: Global Market Volume (Units) Forecast by By Application, 2020-2035
  • Table 9: Global Market Value (USD Million) Forecast by By End-Use Industry, 2020-2035
  • Table 10: Global Market Volume (Units) Forecast by By End-Use Industry, 2020-2035
  • Table 11: North America Market Value (USD Million) Forecast by Country, 2020-2035
  • Table 12: North America Market Volume (Units) Forecast by Country, 2020-2035
  • Table 13: North America Market Value (USD Million) Forecast by By Packaging Type, 2020-2035
  • Table 14: North America Market Volume (Units) Forecast by By Packaging Type, 2020-2035
  • Table 15: North America Market Value (USD Million) Forecast by By Recycling Process, 2020-2035
  • Table 16: North America Market Volume (Units) Forecast by By Recycling Process, 2020-2035
  • Table 17: North America Market Value (USD Million) Forecast by By Application, 2020-2035
  • Table 18: North America Market Volume (Units) Forecast by By Application, 2020-2035
  • Table 19: North America Market Value (USD Million) Forecast by By End-Use Industry, 2020-2035
  • Table 20: North America Market Volume (Units) Forecast by By End-Use Industry, 2020-2035
  • Table 21: Latin America Market Value (USD Million) Forecast by Country, 2020-2035
  • Table 22: Latin America Market Volume (Units) Forecast by Country, 2020-2035
  • Table 23: Latin America Market Value (USD Million) Forecast by By Packaging Type, 2020-2035
  • Table 24: Latin America Market Volume (Units) Forecast by By Packaging Type, 2020-2035
  • Table 25: Latin America Market Value (USD Million) Forecast by By Recycling Process, 2020-2035
  • Table 26: Latin America Market Volume (Units) Forecast by By Recycling Process, 2020-2035
  • Table 27: Latin America Market Value (USD Million) Forecast by By Application, 2020-2035
  • Table 28: Latin America Market Volume (Units) Forecast by By Application, 2020-2035
  • Table 29: Latin America Market Value (USD Million) Forecast by By End-Use Industry, 2020-2035
  • Table 30: Latin America Market Volume (Units) Forecast by By End-Use Industry, 2020-2035
  • Table 31: Europe Market Value (USD Million) Forecast by Country, 2020-2035
  • Table 32: Europe Market Volume (Units) Forecast by Country, 2020-2035
  • Table 33: Europe Market Value (USD Million) Forecast by By Packaging Type, 2020-2035
  • Table 34: Europe Market Volume (Units) Forecast by By Packaging Type, 2020-2035
  • Table 35: Europe Market Value (USD Million) Forecast by By Recycling Process, 2020-2035
  • Table 36: Europe Market Volume (Units) Forecast by By Recycling Process, 2020-2035
  • Table 37: Europe Market Value (USD Million) Forecast by By Application, 2020-2035
  • Table 38: Europe Market Volume (Units) Forecast by By Application, 2020-2035
  • Table 39: Europe Market Value (USD Million) Forecast by By End-Use Industry, 2020-2035
  • Table 40: Europe Market Volume (Units) Forecast by By End-Use Industry, 2020-2035
  • Table 41: East Asia Market Value (USD Million) Forecast by Country, 2020-2035
  • Table 42: East Asia Market Volume (Units) Forecast by Country, 2020-2035
  • Table 43: East Asia Market Value (USD Million) Forecast by By Packaging Type, 2020-2035
  • Table 44: East Asia Market Volume (Units) Forecast by By Packaging Type, 2020-2035
  • Table 45: East Asia Market Value (USD Million) Forecast by By Recycling Process, 2020-2035
  • Table 46: East Asia Market Volume (Units) Forecast by By Recycling Process, 2020-2035
  • Table 47: East Asia Market Value (USD Million) Forecast by By Application, 2020-2035
  • Table 48: East Asia Market Volume (Units) Forecast by By Application, 2020-2035
  • Table 49: East Asia Market Value (USD Million) Forecast by By End-Use Industry, 2020-2035
  • Table 50: East Asia Market Volume (Units) Forecast by By End-Use Industry, 2020-2035
  • Table 51: South Asia Market Value (USD Million) Forecast by Country, 2020-2035
  • Table 52: South Asia Market Volume (Units) Forecast by Country, 2020-2035
  • Table 53: South Asia Market Value (USD Million) Forecast by By Packaging Type, 2020-2035
  • Table 54: South Asia Market Volume (Units) Forecast by By Packaging Type, 2020-2035
  • Table 55: South Asia Market Value (USD Million) Forecast by By Recycling Process, 2020-2035
  • Table 56: South Asia Market Volume (Units) Forecast by By Recycling Process, 2020-2035
  • Table 57: South Asia Market Value (USD Million) Forecast by By Application, 2020-2035
  • Table 58: South Asia Market Volume (Units) Forecast by By Application, 2020-2035
  • Table 59: South Asia Market Value (USD Million) Forecast by By End-Use Industry, 2020-2035
  • Table 60: South Asia Market Volume (Units) Forecast by By End-Use Industry, 2020-2035
  • Table 61: Oceania Market Value (USD Million) Forecast by Country, 2020-2035
  • Table 62: Oceania Market Volume (Units) Forecast by Country, 2020-2035
  • Table 63: Oceania Market Value (USD Million) Forecast by By Packaging Type, 2020-2035
  • Table 64: Oceania Market Volume (Units) Forecast by By Packaging Type, 2020-2035
  • Table 65: Oceania Market Value (USD Million) Forecast by By Recycling Process, 2020-2035
  • Table 66: Oceania Market Volume (Units) Forecast by By Recycling Process, 2020-2035
  • Table 67: Oceania Market Value (USD Million) Forecast by By Application, 2020-2035
  • Table 68: Oceania Market Volume (Units) Forecast by By Application, 2020-2035
  • Table 69: Oceania Market Value (USD Million) Forecast by By End-Use Industry, 2020-2035
  • Table 70: Oceania Market Volume (Units) Forecast by By End-Use Industry, 2020-2035
  • Table 71: MEA Market Value (USD Million) Forecast by Country, 2020-2035
  • Table 72: MEA Market Volume (Units) Forecast by Country, 2020-2035
  • Table 73: MEA Market Value (USD Million) Forecast by By Packaging Type, 2020-2035
  • Table 74: MEA Market Volume (Units) Forecast by By Packaging Type, 2020-2035
  • Table 75: MEA Market Value (USD Million) Forecast by By Recycling Process, 2020-2035
  • Table 76: MEA Market Volume (Units) Forecast by By Recycling Process, 2020-2035
  • Table 77: MEA Market Value (USD Million) Forecast by By Application, 2020-2035
  • Table 78: MEA Market Volume (Units) Forecast by By Application, 2020-2035
  • Table 79: MEA Market Value (USD Million) Forecast by By End-Use Industry, 2020-2035
  • Table 80: MEA Market Volume (Units) Forecast by By End-Use Industry, 2020-2035

List of Figures

  • Figure 1: Global Market Value (USD Million) by By Packaging Type, 2025-2035
  • Figure 2: Global Market Value (USD Million) by By Recycling Process, 2025-2035
  • Figure 3: Global Market Value (USD Million) by By Application, 2025-2035
  • Figure 4: Global Market Value (USD Million) by By End-Use Industry, 2025-2035
  • Figure 5: Global Market Value (USD Million) by Region, 2025-2035
  • Figure 6: Global Market Value (USD Million) Analysis by Region, 2020-2035
  • Figure 7: Global Market Volume (Units) Analysis by Region, 2020-2035
  • Figure 8: Global Market Value Share (%) and BPS Analysis by Region, 2025-2035
  • Figure 9: Global Market Y-o-Y Growth (%) Projections by Region, 2025-2035
  • Figure 10: Global Market Value (USD Million) Analysis by By Packaging Type, 2020-2035
  • Figure 11: Global Market Volume (Units) Analysis by By Packaging Type, 2020-2035
  • Figure 12: Global Market Value Share (%) and BPS Analysis by By Packaging Type, 2025-2035
  • Figure 13: Global Market Y-o-Y Growth (%) Projections by By Packaging Type, 2025-2035
  • Figure 14: Global Market Value (USD Million) Analysis by By Recycling Process, 2020-2035
  • Figure 15: Global Market Volume (Units) Analysis by By Recycling Process, 2020-2035
  • Figure 16: Global Market Value Share (%) and BPS Analysis by By Recycling Process, 2025-2035
  • Figure 17: Global Market Y-o-Y Growth (%) Projections by By Recycling Process, 2025-2035
  • Figure 18: Global Market Value (USD Million) Analysis by By Application, 2020-2035
  • Figure 19: Global Market Volume (Units) Analysis by By Application, 2020-2035
  • Figure 20: Global Market Value Share (%) and BPS Analysis by By Application, 2025-2035
  • Figure 21: Global Market Y-o-Y Growth (%) Projections by By Application, 2025-2035
  • Figure 22: Global Market Value (USD Million) Analysis by By End-Use Industry, 2020-2035
  • Figure 23: Global Market Volume (Units) Analysis by By End-Use Industry, 2020-2035
  • Figure 24: Global Market Value Share (%) and BPS Analysis by By End-Use Industry, 2025-2035
  • Figure 25: Global Market Y-o-Y Growth (%) Projections by By End-Use Industry, 2025-2035
  • Figure 26: Global Market Attractiveness by By Packaging Type, 2025-2035
  • Figure 27: Global Market Attractiveness by By Recycling Process, 2025-2035
  • Figure 28: Global Market Attractiveness by By Application, 2025-2035
  • Figure 29: Global Market Attractiveness by By End-Use Industry, 2025-2035
  • Figure 30: Global Market Attractiveness by Region, 2025-2035
  • Figure 31: North America Market Value (USD Million) by By Packaging Type, 2025-2035
  • Figure 32: North America Market Value (USD Million) by By Recycling Process, 2025-2035
  • Figure 33: North America Market Value (USD Million) by By Application, 2025-2035
  • Figure 34: North America Market Value (USD Million) by By End-Use Industry, 2025-2035
  • Figure 35: North America Market Value (USD Million) by Country, 2025-2035
  • Figure 36: North America Market Value (USD Million) Analysis by Country, 2020-2035
  • Figure 37: North America Market Volume (Units) Analysis by Country, 2020-2035
  • Figure 38: North America Market Value Share (%) and BPS Analysis by Country, 2025-2035
  • Figure 39: North America Market Y-o-Y Growth (%) Projections by Country, 2025-2035
  • Figure 40: North America Market Value (USD Million) Analysis by By Packaging Type, 2020-2035
  • Figure 41: North America Market Volume (Units) Analysis by By Packaging Type, 2020-2035
  • Figure 42: North America Market Value Share (%) and BPS Analysis by By Packaging Type, 2025-2035
  • Figure 43: North America Market Y-o-Y Growth (%) Projections by By Packaging Type, 2025-2035
  • Figure 44: North America Market Value (USD Million) Analysis by By Recycling Process, 2020-2035
  • Figure 45: North America Market Volume (Units) Analysis by By Recycling Process, 2020-2035
  • Figure 46: North America Market Value Share (%) and BPS Analysis by By Recycling Process, 2025-2035
  • Figure 47: North America Market Y-o-Y Growth (%) Projections by By Recycling Process, 2025-2035
  • Figure 48: North America Market Value (USD Million) Analysis by By Application, 2020-2035
  • Figure 49: North America Market Volume (Units) Analysis by By Application, 2020-2035
  • Figure 50: North America Market Value Share (%) and BPS Analysis by By Application, 2025-2035
  • Figure 51: North America Market Y-o-Y Growth (%) Projections by By Application, 2025-2035
  • Figure 52: North America Market Value (USD Million) Analysis by By End-Use Industry, 2020-2035
  • Figure 53: North America Market Volume (Units) Analysis by By End-Use Industry, 2020-2035
  • Figure 54: North America Market Value Share (%) and BPS Analysis by By End-Use Industry, 2025-2035
  • Figure 55: North America Market Y-o-Y Growth (%) Projections by By End-Use Industry, 2025-2035
  • Figure 56: North America Market Attractiveness by By Packaging Type, 2025-2035
  • Figure 57: North America Market Attractiveness by By Recycling Process, 2025-2035
  • Figure 58: North America Market Attractiveness by By Application, 2025-2035
  • Figure 59: North America Market Attractiveness by By End-Use Industry, 2025-2035
  • Figure 60: North America Market Attractiveness by Country, 2025-2035
  • Figure 61: Latin America Market Value (USD Million) by By Packaging Type, 2025-2035
  • Figure 62: Latin America Market Value (USD Million) by By Recycling Process, 2025-2035
  • Figure 63: Latin America Market Value (USD Million) by By Application, 2025-2035
  • Figure 64: Latin America Market Value (USD Million) by By End-Use Industry, 2025-2035
  • Figure 65: Latin America Market Value (USD Million) by Country, 2025-2035
  • Figure 66: Latin America Market Value (USD Million) Analysis by Country, 2020-2035
  • Figure 67: Latin America Market Volume (Units) Analysis by Country, 2020-2035
  • Figure 68: Latin America Market Value Share (%) and BPS Analysis by Country, 2025-2035
  • Figure 69: Latin America Market Y-o-Y Growth (%) Projections by Country, 2025-2035
  • Figure 70: Latin America Market Value (USD Million) Analysis by By Packaging Type, 2020-2035
  • Figure 71: Latin America Market Volume (Units) Analysis by By Packaging Type, 2020-2035
  • Figure 72: Latin America Market Value Share (%) and BPS Analysis by By Packaging Type, 2025-2035
  • Figure 73: Latin America Market Y-o-Y Growth (%) Projections by By Packaging Type, 2025-2035
  • Figure 74: Latin America Market Value (USD Million) Analysis by By Recycling Process, 2020-2035
  • Figure 75: Latin America Market Volume (Units) Analysis by By Recycling Process, 2020-2035
  • Figure 76: Latin America Market Value Share (%) and BPS Analysis by By Recycling Process, 2025-2035
  • Figure 77: Latin America Market Y-o-Y Growth (%) Projections by By Recycling Process, 2025-2035
  • Figure 78: Latin America Market Value (USD Million) Analysis by By Application, 2020-2035
  • Figure 79: Latin America Market Volume (Units) Analysis by By Application, 2020-2035
  • Figure 80: Latin America Market Value Share (%) and BPS Analysis by By Application, 2025-2035
  • Figure 81: Latin America Market Y-o-Y Growth (%) Projections by By Application, 2025-2035
  • Figure 82: Latin America Market Value (USD Million) Analysis by By End-Use Industry, 2020-2035
  • Figure 83: Latin America Market Volume (Units) Analysis by By End-Use Industry, 2020-2035
  • Figure 84: Latin America Market Value Share (%) and BPS Analysis by By End-Use Industry, 2025-2035
  • Figure 85: Latin America Market Y-o-Y Growth (%) Projections by By End-Use Industry, 2025-2035
  • Figure 86: Latin America Market Attractiveness by By Packaging Type, 2025-2035
  • Figure 87: Latin America Market Attractiveness by By Recycling Process, 2025-2035
  • Figure 88: Latin America Market Attractiveness by By Application, 2025-2035
  • Figure 89: Latin America Market Attractiveness by By End-Use Industry, 2025-2035
  • Figure 90: Latin America Market Attractiveness by Country, 2025-2035
  • Figure 91: Europe Market Value (USD Million) by By Packaging Type, 2025-2035
  • Figure 92: Europe Market Value (USD Million) by By Recycling Process, 2025-2035
  • Figure 93: Europe Market Value (USD Million) by By Application, 2025-2035
  • Figure 94: Europe Market Value (USD Million) by By End-Use Industry, 2025-2035
  • Figure 95: Europe Market Value (USD Million) by Country, 2025-2035
  • Figure 96: Europe Market Value (USD Million) Analysis by Country, 2020-2035
  • Figure 97: Europe Market Volume (Units) Analysis by Country, 2020-2035
  • Figure 98: Europe Market Value Share (%) and BPS Analysis by Country, 2025-2035
  • Figure 99: Europe Market Y-o-Y Growth (%) Projections by Country, 2025-2035
  • Figure 100: Europe Market Value (USD Million) Analysis by By Packaging Type, 2020-2035
  • Figure 101: Europe Market Volume (Units) Analysis by By Packaging Type, 2020-2035
  • Figure 102: Europe Market Value Share (%) and BPS Analysis by By Packaging Type, 2025-2035
  • Figure 103: Europe Market Y-o-Y Growth (%) Projections by By Packaging Type, 2025-2035
  • Figure 104: Europe Market Value (USD Million) Analysis by By Recycling Process, 2020-2035
  • Figure 105: Europe Market Volume (Units) Analysis by By Recycling Process, 2020-2035
  • Figure 106: Europe Market Value Share (%) and BPS Analysis by By Recycling Process, 2025-2035
  • Figure 107: Europe Market Y-o-Y Growth (%) Projections by By Recycling Process, 2025-2035
  • Figure 108: Europe Market Value (USD Million) Analysis by By Application, 2020-2035
  • Figure 109: Europe Market Volume (Units) Analysis by By Application, 2020-2035
  • Figure 110: Europe Market Value Share (%) and BPS Analysis by By Application, 2025-2035
  • Figure 111: Europe Market Y-o-Y Growth (%) Projections by By Application, 2025-2035
  • Figure 112: Europe Market Value (USD Million) Analysis by By End-Use Industry, 2020-2035
  • Figure 113: Europe Market Volume (Units) Analysis by By End-Use Industry, 2020-2035
  • Figure 114: Europe Market Value Share (%) and BPS Analysis by By End-Use Industry, 2025-2035
  • Figure 115: Europe Market Y-o-Y Growth (%) Projections by By End-Use Industry, 2025-2035
  • Figure 116: Europe Market Attractiveness by By Packaging Type, 2025-2035
  • Figure 117: Europe Market Attractiveness by By Recycling Process, 2025-2035
  • Figure 118: Europe Market Attractiveness by By Application, 2025-2035
  • Figure 119: Europe Market Attractiveness by By End-Use Industry, 2025-2035
  • Figure 120: Europe Market Attractiveness by Country, 2025-2035
  • Figure 121: East Asia Market Value (USD Million) by By Packaging Type, 2025-2035
  • Figure 122: East Asia Market Value (USD Million) by By Recycling Process, 2025-2035
  • Figure 123: East Asia Market Value (USD Million) by By Application, 2025-2035
  • Figure 124: East Asia Market Value (USD Million) by By End-Use Industry, 2025-2035
  • Figure 125: East Asia Market Value (USD Million) by Country, 2025-2035
  • Figure 126: East Asia Market Value (USD Million) Analysis by Country, 2020-2035
  • Figure 127: East Asia Market Volume (Units) Analysis by Country, 2020-2035
  • Figure 128: East Asia Market Value Share (%) and BPS Analysis by Country, 2025-2035
  • Figure 129: East Asia Market Y-o-Y Growth (%) Projections by Country, 2025-2035
  • Figure 130: East Asia Market Value (USD Million) Analysis by By Packaging Type, 2020-2035
  • Figure 131: East Asia Market Volume (Units) Analysis by By Packaging Type, 2020-2035
  • Figure 132: East Asia Market Value Share (%) and BPS Analysis by By Packaging Type, 2025-2035
  • Figure 133: East Asia Market Y-o-Y Growth (%) Projections by By Packaging Type, 2025-2035
  • Figure 134: East Asia Market Value (USD Million) Analysis by By Recycling Process, 2020-2035
  • Figure 135: East Asia Market Volume (Units) Analysis by By Recycling Process, 2020-2035
  • Figure 136: East Asia Market Value Share (%) and BPS Analysis by By Recycling Process, 2025-2035
  • Figure 137: East Asia Market Y-o-Y Growth (%) Projections by By Recycling Process, 2025-2035
  • Figure 138: East Asia Market Value (USD Million) Analysis by By Application, 2020-2035
  • Figure 139: East Asia Market Volume (Units) Analysis by By Application, 2020-2035
  • Figure 140: East Asia Market Value Share (%) and BPS Analysis by By Application, 2025-2035
  • Figure 141: East Asia Market Y-o-Y Growth (%) Projections by By Application, 2025-2035
  • Figure 142: East Asia Market Value (USD Million) Analysis by By End-Use Industry, 2020-2035
  • Figure 143: East Asia Market Volume (Units) Analysis by By End-Use Industry, 2020-2035
  • Figure 144: East Asia Market Value Share (%) and BPS Analysis by By End-Use Industry, 2025-2035
  • Figure 145: East Asia Market Y-o-Y Growth (%) Projections by By End-Use Industry, 2025-2035
  • Figure 146: East Asia Market Attractiveness by By Packaging Type, 2025-2035
  • Figure 147: East Asia Market Attractiveness by By Recycling Process, 2025-2035
  • Figure 148: East Asia Market Attractiveness by By Application, 2025-2035
  • Figure 149: East Asia Market Attractiveness by By End-Use Industry, 2025-2035
  • Figure 150: East Asia Market Attractiveness by Country, 2025-2035
  • Figure 151: South Asia Market Value (USD Million) by By Packaging Type, 2025-2035
  • Figure 152: South Asia Market Value (USD Million) by By Recycling Process, 2025-2035
  • Figure 153: South Asia Market Value (USD Million) by By Application, 2025-2035
  • Figure 154: South Asia Market Value (USD Million) by By End-Use Industry, 2025-2035
  • Figure 155: South Asia Market Value (USD Million) by Country, 2025-2035
  • Figure 156: South Asia Market Value (USD Million) Analysis by Country, 2020-2035
  • Figure 157: South Asia Market Volume (Units) Analysis by Country, 2020-2035
  • Figure 158: South Asia Market Value Share (%) and BPS Analysis by Country, 2025-2035
  • Figure 159: South Asia Market Y-o-Y Growth (%) Projections by Country, 2025-2035
  • Figure 160: South Asia Market Value (USD Million) Analysis by By Packaging Type, 2020-2035
  • Figure 161: South Asia Market Volume (Units) Analysis by By Packaging Type, 2020-2035
  • Figure 162: South Asia Market Value Share (%) and BPS Analysis by By Packaging Type, 2025-2035
  • Figure 163: South Asia Market Y-o-Y Growth (%) Projections by By Packaging Type, 2025-2035
  • Figure 164: South Asia Market Value (USD Million) Analysis by By Recycling Process, 2020-2035
  • Figure 165: South Asia Market Volume (Units) Analysis by By Recycling Process, 2020-2035
  • Figure 166: South Asia Market Value Share (%) and BPS Analysis by By Recycling Process, 2025-2035
  • Figure 167: South Asia Market Y-o-Y Growth (%) Projections by By Recycling Process, 2025-2035
  • Figure 168: South Asia Market Value (USD Million) Analysis by By Application, 2020-2035
  • Figure 169: South Asia Market Volume (Units) Analysis by By Application, 2020-2035
  • Figure 170: South Asia Market Value Share (%) and BPS Analysis by By Application, 2025-2035
  • Figure 171: South Asia Market Y-o-Y Growth (%) Projections by By Application, 2025-2035
  • Figure 172: South Asia Market Value (USD Million) Analysis by By End-Use Industry, 2020-2035
  • Figure 173: South Asia Market Volume (Units) Analysis by By End-Use Industry, 2020-2035
  • Figure 174: South Asia Market Value Share (%) and BPS Analysis by By End-Use Industry, 2025-2035
  • Figure 175: South Asia Market Y-o-Y Growth (%) Projections by By End-Use Industry, 2025-2035
  • Figure 176: South Asia Market Attractiveness by By Packaging Type, 2025-2035
  • Figure 177: South Asia Market Attractiveness by By Recycling Process, 2025-2035
  • Figure 178: South Asia Market Attractiveness by By Application, 2025-2035
  • Figure 179: South Asia Market Attractiveness by By End-Use Industry, 2025-2035
  • Figure 180: South Asia Market Attractiveness by Country, 2025-2035
  • Figure 181: Oceania Market Value (USD Million) by By Packaging Type, 2025-2035
  • Figure 182: Oceania Market Value (USD Million) by By Recycling Process, 2025-2035
  • Figure 183: Oceania Market Value (USD Million) by By Application, 2025-2035
  • Figure 184: Oceania Market Value (USD Million) by By End-Use Industry, 2025-2035
  • Figure 185: Oceania Market Value (USD Million) by Country, 2025-2035
  • Figure 186: Oceania Market Value (USD Million) Analysis by Country, 2020-2035
  • Figure 187: Oceania Market Volume (Units) Analysis by Country, 2020-2035
  • Figure 188: Oceania Market Value Share (%) and BPS Analysis by Country, 2025-2035
  • Figure 189: Oceania Market Y-o-Y Growth (%) Projections by Country, 2025-2035
  • Figure 190: Oceania Market Value (USD Million) Analysis by By Packaging Type, 2020-2035
  • Figure 191: Oceania Market Volume (Units) Analysis by By Packaging Type, 2020-2035
  • Figure 192: Oceania Market Value Share (%) and BPS Analysis by By Packaging Type, 2025-2035
  • Figure 193: Oceania Market Y-o-Y Growth (%) Projections by By Packaging Type, 2025-2035
  • Figure 194: Oceania Market Value (USD Million) Analysis by By Recycling Process, 2020-2035
  • Figure 195: Oceania Market Volume (Units) Analysis by By Recycling Process, 2020-2035
  • Figure 196: Oceania Market Value Share (%) and BPS Analysis by By Recycling Process, 2025-2035
  • Figure 197: Oceania Market Y-o-Y Growth (%) Projections by By Recycling Process, 2025-2035
  • Figure 198: Oceania Market Value (USD Million) Analysis by By Application, 2020-2035
  • Figure 199: Oceania Market Volume (Units) Analysis by By Application, 2020-2035
  • Figure 200: Oceania Market Value Share (%) and BPS Analysis by By Application, 2025-2035
  • Figure 201: Oceania Market Y-o-Y Growth (%) Projections by By Application, 2025-2035
  • Figure 202: Oceania Market Value (USD Million) Analysis by By End-Use Industry, 2020-2035
  • Figure 203: Oceania Market Volume (Units) Analysis by By End-Use Industry, 2020-2035
  • Figure 204: Oceania Market Value Share (%) and BPS Analysis by By End-Use Industry, 2025-2035
  • Figure 205: Oceania Market Y-o-Y Growth (%) Projections by By End-Use Industry, 2025-2035
  • Figure 206: Oceania Market Attractiveness by By Packaging Type, 2025-2035
  • Figure 207: Oceania Market Attractiveness by By Recycling Process, 2025-2035
  • Figure 208: Oceania Market Attractiveness by By Application, 2025-2035
  • Figure 209: Oceania Market Attractiveness by By End-Use Industry, 2025-2035
  • Figure 210: Oceania Market Attractiveness by Country, 2025-2035
  • Figure 211: MEA Market Value (USD Million) by By Packaging Type, 2025-2035
  • Figure 212: MEA Market Value (USD Million) by By Recycling Process, 2025-2035
  • Figure 213: MEA Market Value (USD Million) by By Application, 2025-2035
  • Figure 214: MEA Market Value (USD Million) by By End-Use Industry, 2025-2035
  • Figure 215: MEA Market Value (USD Million) by Country, 2025-2035
  • Figure 216: MEA Market Value (USD Million) Analysis by Country, 2020-2035
  • Figure 217: MEA Market Volume (Units) Analysis by Country, 2020-2035
  • Figure 218: MEA Market Value Share (%) and BPS Analysis by Country, 2025-2035
  • Figure 219: MEA Market Y-o-Y Growth (%) Projections by Country, 2025-2035
  • Figure 220: MEA Market Value (USD Million) Analysis by By Packaging Type, 2020-2035
  • Figure 221: MEA Market Volume (Units) Analysis by By Packaging Type, 2020-2035
  • Figure 222: MEA Market Value Share (%) and BPS Analysis by By Packaging Type, 2025-2035
  • Figure 223: MEA Market Y-o-Y Growth (%) Projections by By Packaging Type, 2025-2035
  • Figure 224: MEA Market Value (USD Million) Analysis by By Recycling Process, 2020-2035
  • Figure 225: MEA Market Volume (Units) Analysis by By Recycling Process, 2020-2035
  • Figure 226: MEA Market Value Share (%) and BPS Analysis by By Recycling Process, 2025-2035
  • Figure 227: MEA Market Y-o-Y Growth (%) Projections by By Recycling Process, 2025-2035
  • Figure 228: MEA Market Value (USD Million) Analysis by By Application, 2020-2035
  • Figure 229: MEA Market Volume (Units) Analysis by By Application, 2020-2035
  • Figure 230: MEA Market Value Share (%) and BPS Analysis by By Application, 2025-2035
  • Figure 231: MEA Market Y-o-Y Growth (%) Projections by By Application, 2025-2035
  • Figure 232: MEA Market Value (USD Million) Analysis by By End-Use Industry, 2020-2035
  • Figure 233: MEA Market Volume (Units) Analysis by By End-Use Industry, 2020-2035
  • Figure 234: MEA Market Value Share (%) and BPS Analysis by By End-Use Industry, 2025-2035
  • Figure 235: MEA Market Y-o-Y Growth (%) Projections by By End-Use Industry, 2025-2035
  • Figure 236: MEA Market Attractiveness by By Packaging Type, 2025-2035
  • Figure 237: MEA Market Attractiveness by By Recycling Process, 2025-2035
  • Figure 238: MEA Market Attractiveness by By Application, 2025-2035
  • Figure 239: MEA Market Attractiveness by By End-Use Industry, 2025-2035
  • Figure 240: MEA Market Attractiveness by Country, 2025-2035

Frequently Asked Questions

What was the overall size of the recycled PET packaging market in 2025?

The overall market size for the recycled PET packaging market was USD 3,649.9 Million in 2025.

How big is the recycled PET packaging market expected to be in 2035?

The recycled PET packaging market is expected to reach USD 6,723.9 Million in 2035.

What will drive the demand for the recycled PET packaging market during the forecast period?

Growing environmental concerns, increasing government regulations on plastic waste, and rising adoption of sustainable packaging solutions will drive market growth.

List the top 5 countries contributing to the recycled PET packaging market?

The USA, China, Germany, India, and the UK are key contributors.

Which segment in type is expected to lead in the Recycled PET Packaging Market?

Bottles are expected to dominate due to their widespread use in the beverage industry and high recyclability.

Explore Similar Insights

Future Market Insights

Recycled PET Packaging Market