The recycled concrete aggregates market is valued at USD 10.6 billion in 2025 and is projected to reach USD 22.9 billion by 2035, rising at a CAGR of 8.0%. This growth is primarily driven by the increasing demand for sustainable construction materials and the growing adoption of circular economy principles in the construction and infrastructure sectors. As industries seek to minimize environmental impact, recycled concrete aggregates (RCA) provide a cost-effective and eco-friendly alternative to virgin aggregates, helping to divert waste from landfills and reduce the consumption of natural resources. Gravel & crushed stone will dominate with a 45.0% market share, being the preferred material for infrastructure and construction projects due to its performance reliability and versatility across various applications, from base courses to concrete production.
The processed form of RCA, which accounts for 65.0% of the market, is expected to lead due to its superior quality characteristics such as enhanced strength and consistency. Roads & pavement applications will remain the largest application segment, making up 38.0% of the market, as demand for road base and sub-base materials grows in urban infrastructure and highway projects. Europe, North America, and Asia Pacific will be the key growth regions, with countries like Poland (9.0% CAGR) and Netherlands (8.4% CAGR) leading expansion due to advanced recycling systems, urban renewal projects, and circular economy initiatives.
The competition in the market is being driven by Heidelberg Materials, Holcim, CRH, and other large construction and waste management companies, which are investing in advanced recycling technologies and quality enhancement systems to ensure high-specification RCA. These companies leverage their extensive processing capabilities, innovative material recovery systems, and sustainability programs to maintain a competitive edge in an increasingly eco-conscious market.
Key industry dynamics include the need for improved quality control and processing techniques to ensure that RCA meets the stringent specifications required for structural applications. While RCA is primarily used in non-structural components, advancements in processing technologies are expanding its use in structural applications as well, allowing it to meet the performance standards typically associated with virgin aggregates. The growth in demand for high-strength concrete, particularly in developing economies undergoing rapid urbanization, encourages the development of more sophisticated recycling and processing methods.
The market faces challenges, including the need for advanced sorting and cleaning technologies to ensure the quality of the material. Contamination from other materials during the demolition process and variability in the properties of recycled aggregates can hinder its widespread acceptance in structural applications. Moreover, logistical challenges in transporting recycled aggregates from demolition sites to processing facilities further add to costs. However, advancements in sorting technologies, such as automated systems, and increased investments in recycling infrastructure are expected to address these issues.
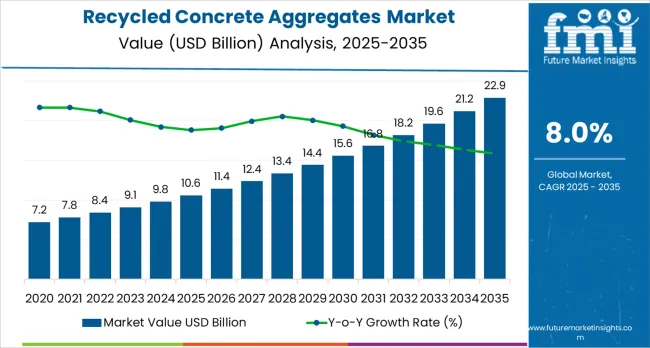
| Metric | Value |
|---|---|
| Estimated Value in (2025E) | USD 10.6 billion |
| Forecast Value in (2035F) | USD 22.9 billion |
| Forecast CAGR (2025 to 2035) | 8% |
Market expansion is being supported by the increasing global demand for sustainable construction practices and the corresponding need for circular economy solutions that can reduce landfill disposal, conserve natural resources, and minimize carbon emissions across various infrastructure, building, and civil engineering applications. Modern construction companies and infrastructure developers are increasingly focused on implementing material solutions that can replace virgin aggregates, reduce environmental footprints, and provide consistent performance in demanding operating conditions. Recycled concrete aggregates'proven ability to deliver cost-effective material supply, operate within circular economy frameworks, and support sustainability objectives makes them essential materials for contemporary infrastructure and building projects.
The growing emphasis on environmental compliance and resource conservation is driving demand for recycled concrete aggregates that can support effective waste diversion, ensure reliable material quality, and enable comprehensive sustainability control. Construction projects'preference for material solutions that combine environmental benefits with operational reliability and cost-effectiveness is creating opportunities for innovative recycled aggregate implementations. The rising influence of green building certifications and circular economy policies is also contributing to increased adoption of recycled concrete aggregates that can provide sustainable material supply without compromising structural performance or project economics.
The market is segmented by product type, form, application, and end use. By product type, the market is divided into gravel &crushed stone, sand, recycled fine aggregates, and other products. Based on form, the market is categorized into processed (washed &screened, pre-sorted structural grade, high-spec fines/fillers) and unprocessed materials. By application, the market includes roads &pavement, concrete production, landscaping, and other uses. Based on end use, the market is divided into non-residential and residential construction sectors.
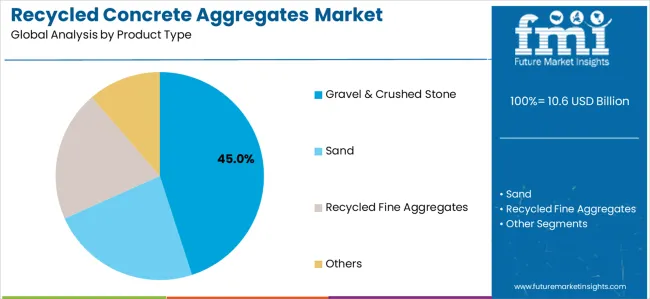
The gravel &crushed stone segment is projected to maintain its leading position in the recycled concrete aggregates market in 2025, accounting for more than 45.0% market share, reaffirming its role as the preferred material category for infrastructure and construction applications.
Construction operators and infrastructure developers increasingly utilize RCA gravel &crushed stone for their cost-effectiveness, performance reliability, and versatile application suitability across various project types and material handling scenarios. Gravel &crushed stone technology's proven effectiveness and operational simplicity directly address the industry requirements for efficient material supply and consistent performance in diverse infrastructure and building applications.
This product segment forms the foundation of modern recycled aggregate utilization, as it represents the material type with the greatest application versatility and established performance record across multiple construction processes and infrastructure projects.
Construction investments in gravel &crushed stone systems continue to strengthen adoption among project developers and engineering teams. With infrastructure applications requiring reliable base course materials and operational consistency, RCA gravel &crushed stone align with both performance objectives and sustainability requirements, making them the central component of comprehensive circular construction strategies.
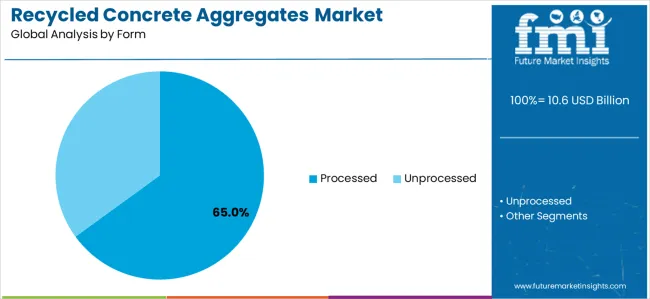
The processed recycled concrete aggregates segment is projected to represent the largest share of RCA demand in 2025, accounting for approximately 65.0% market share, underscoring its critical role as the primary driver for quality aggregate adoption across concrete production, structural applications, and premium infrastructure operations.
Construction operators prefer processed RCA for material supply due to their enhanced quality characteristics, reliable performance standards, and ability to ensure consistent material specifications while supporting project quality and environmental compliance. Positioned as essential materials for modern construction operations, processed RCA systems offer both operational advantages and sustainability benefits.
The segment is supported by continuous innovation in processing technologies and the growing availability of specialized washing and screening systems that enable effective material quality enhancement with improved purity and performance consistency.
Additionally, construction operators are investing in comprehensive quality assurance programs to support large-scale infrastructure requirements and green building objectives. As construction standards become more stringent and environmental regulations increase, the processed RCA application will continue to dominate the market while supporting advanced aggregate utilization and quality optimization strategies.
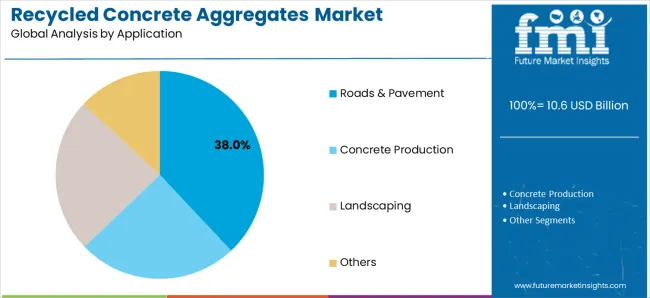
The roads &pavement application segment is projected to represent the largest share of recycled concrete aggregate demand in 2025, accounting for approximately 38.0% market share, reflecting the critical role of RCA in enabling cost-effective infrastructure development and pavement rehabilitation across highway construction, urban roadway projects, and transportation infrastructure operations.
Infrastructure developers prefer recycled concrete aggregates for road base and sub-base applications due to their proven structural performance, cost advantages over virgin materials, and ability to ensure durable pavement systems while supporting sustainability and budget objectives. Positioned as essential materials for modern road construction, RCA systems offer both economic advantages and environmental benefits.
The concrete production segment represents a significant application category, capturing substantial market share through specialized requirements for ready-mix concrete, precast elements, and structural concrete applications where processed RCA can partially replace natural aggregates.
This segment benefits from growing demand for sustainable concrete solutions that meet strength requirements and environmental standards in building and infrastructure projects. The landscaping segment accounts for market share through decorative applications, fill materials, and site development projects, while other applications represent growing demand for drainage systems and miscellaneous civil engineering works.
The recycled concrete aggregates market is advancing steadily due to increasing demand for sustainable construction practices and growing adoption of circular economy technologies that provide enhanced environmental performance and cost-effectiveness across diverse infrastructure and building applications. However, the market faces challenges, including quality variability and contamination concerns, limited acceptance in high-strength structural applications, and logistics complexity in collection and processing systems. Innovation in processing technologies and quality enhancement systems continues to influence product development and market expansion patterns.
The growing adoption of intelligent washing and screening technologies is enabling construction operators to achieve superior material quality, consistent particle grading, and comprehensive contamination removal for enhanced project suitability. Advanced processing systems provide improved aggregate quality while allowing more stringent specification compliance and consistent performance monitoring across various RCA production installations and operating conditions. Manufacturers are increasingly recognizing the competitive advantages of processing integration for quality differentiation and market expansion.
Modern recycled concrete aggregate producers are incorporating circular economy principles and regulatory compliance features to enhance environmental sustainability, reduce natural resource extraction, and support comprehensive construction waste management through optimized recycling and material recovery systems. These frameworks improve ecological performance while enabling new applications, including high-specification structural concrete and premium infrastructure projects. Advanced circular economy integration also allows facilities to support comprehensive sustainability objectives and environmental targets beyond traditional waste disposal approaches.
| Country | CAGR (2025-2035) |
|---|---|
| Poland | 9.0% |
| Netherlands | 8.4% |
| Spain | 8.1% |
| United Kingdom | 7.6% |
| France | 7.4% |
| Germany | 7.2% |
| Italy | 7.0% |
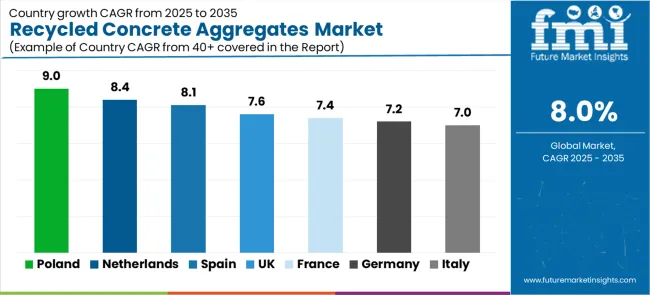
The recycled concrete aggregates market is experiencing solid growth globally, with Poland leading at a 9.0% CAGR through 2035, driven by rapid construction and demolition recycling capacity build-out, expanding motorway and rail infrastructure programs, and municipal waste diversion mandates. The Netherlands follows at 8.4%, supported by mature circular economy targets, high aggregates levy on virgin materials, and urban renewal projects utilizing high-specification RCA. Spain shows growth at 8.1%, emphasizing highway rehabilitation and water management works with rising landfill taxes.
The United Kingdom records 7.6%, focusing on aggregates levy implementation and National Highways reuse specifications. France demonstrates 7.4% growth, supported by Grand Paris and regional transport projects with mandatory construction waste recovery quotas. Germany exhibits 7.2% growth, driven by waste management law enforcement and bridge refurbishment programs. Italy shows 7.0% growth, supported by national recovery plan green works and quarrying constraints in northern regions.
The report covers an in-depth analysis of 40+ countries top-performing European countries are highlighted below.
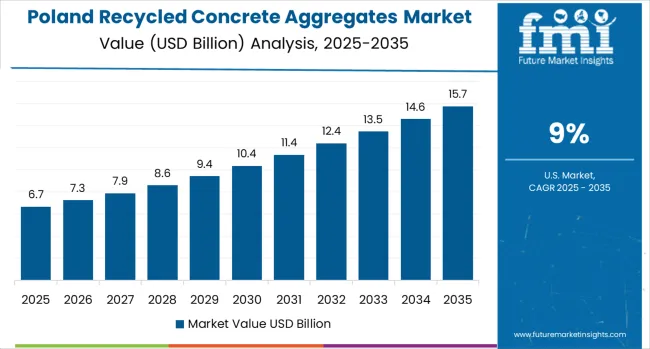
Revenue from recycled concrete aggregates in Poland is projected to exhibit exceptional growth with a CAGR of 9.0% through 2035, driven by rapid construction and demolition recycling capacity expansion and aggressive infrastructure modernization supported by EU cohesion funding and national transport programs.
The country's massive infrastructure investment and increasing implementation of circular economy frameworks are creating substantial demand for sustainable aggregate systems. Major construction companies and material processors are establishing comprehensive recycled aggregate capabilities to serve both domestic infrastructure markets and regional construction projects.
Revenue from recycled concrete aggregates in the Netherlands is expanding at a CAGR of 8.4%, supported by the country's mature circular economy frameworks, high aggregates levy on virgin materials, and sophisticated urban renewal programs requiring high-specification recycled materials in densely-populated metropolitan areas.
The nation's progressive environmental policies and emphasis on resource efficiency are driving sophisticated RCA capabilities throughout the construction sector. Leading construction companies and aggregate producers are investing extensively in advanced processing technology development and quality assurance systems.
Revenue from recycled concrete aggregates in Spain is growing at a CAGR of 8.1%, driven by expanding highway rehabilitation programs, increasing water management infrastructure works, and rising landfill taxes that incentivize construction waste recycling and material recovery.
The country's developing circular economy framework and modernization of infrastructure systems are supporting demand for sustainable aggregate technologies across major construction regions. Construction companies and aggregate suppliers are establishing comprehensive capabilities to serve both domestic infrastructure markets and regional building projects.
Revenue from recycled concrete aggregates in the United Kingdom is expanding at a CAGR of 7.6%, supported by the country's established aggregates levy framework, National Highways reuse specifications, and city-level planning requirements promoting sustainable construction materials across diverse infrastructure applications.
The nation's comprehensive environmental taxation system and advanced facility management practices are driving demand for sophisticated RCA solutions. Construction operators are investing in comprehensive material sourcing programs to serve both operational efficiency and environmental compliance requirements.
Revenue from recycled concrete aggregates in France is growing at a CAGR of 7.4%, driven by the country's ambitious Grand Paris infrastructure expansion, regional transport modernization programs, and mandatory construction and demolition waste recovery quotas supporting circular economy objectives.
The nation's comprehensive infrastructure investment and focus on sustainable construction are supporting investment in advanced RCA capabilities throughout major urban centers and industrial regions. Industry leaders are establishing comprehensive processing systems to serve both domestic construction requirements and environmental compliance objectives.
Revenue from recycled concrete aggregates in Germany is expanding at a CAGR of 7.2%, supported by the country's stringent waste management law (KrWG) enforcement, Länder green procurement requirements, and robust bridge refurbishment pipeline requiring sustainable aggregate solutions.
The nation's mature construction industry and emphasis on environmental compliance are driving sophisticated RCA capabilities throughout the infrastructure sector. Leading construction companies and aggregate producers are investing extensively in advanced processing technology development and comprehensive quality systems.
Revenue from recycled concrete aggregates in Italy is expanding at a CAGR of 7.0%, supported by the country's National Recovery and Resilience Plan (PNRR) green works initiatives, quarrying constraints in northern regions limiting virgin aggregate supply, and seismic retrofit programs requiring substantial material volumes.
Italy's infrastructure modernization and environmental protection measures are supporting demand for alternative aggregate sources and circular economy solutions. Construction companies and material processors are establishing regional capabilities to serve both infrastructure requirements and building applications.
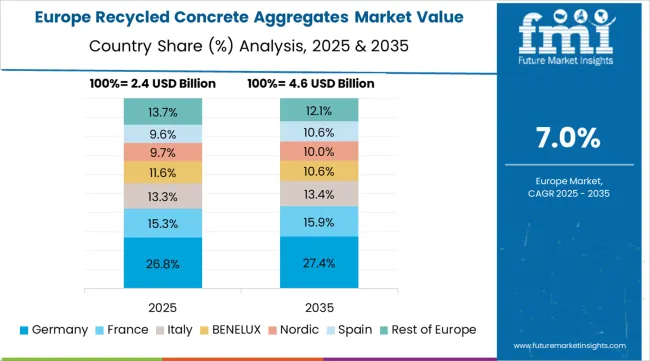
The recycled concrete aggregates market in Europe is projected to grow from USD 3.5 billion in 2025 to USD 5.7 billion by 2035, registering a CAGR of 5.0% over the forecast period. Germany is expected to maintain its leadership position with a 20.0% market share in 2025, supported by its strong construction industry, comprehensive waste management infrastructure, and extensive infrastructure refurbishment programs serving major European markets.
The United Kingdom follows with 14.3% in 2025, driven by established aggregates levy framework, comprehensive highway reuse specifications, and advanced construction waste management programs. France holds 14.3% in 2025, supported by Grand Paris infrastructure expansion and growing adoption of circular economy technologies. Italy commands 11.4% in 2025, while Spain accounts for 8.6% in 2025. The Netherlands maintains a 5.7% share in 2025, driven by mature circular economy targets and high aggregates levy on virgin materials. Poland holds 5.7% in 2025, supported by rapid recycling capacity build-out and EU-funded infrastructure programs.
Belgium and Sweden each maintain 2.9% shares, while Austria and Czechia account for 2.9% each in 2025. The Rest of Europe region, including Nordic countries, Eastern Europe, and other markets, is anticipated to maintain its position at 8.6% through 2035, attributed to increasing infrastructure modernization and growing construction waste recycling adoption across emerging markets implementing circular economy standards.
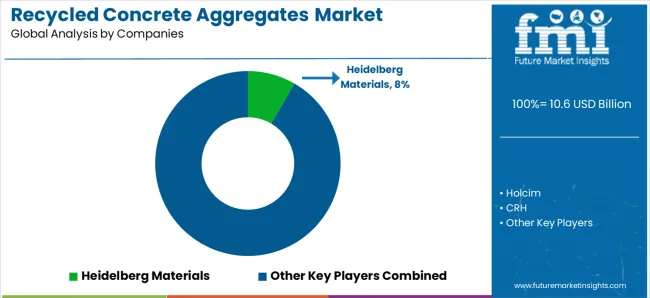
The recycled concrete aggregates (RCA) market features 15–20 players, with the top five companies controlling 50–55% of the global market share, driven by their established recycling infrastructures, large-scale operations, and significant presence in construction, demolition, and infrastructure sectors. Competition centers on processing efficiency, material quality, regulatory compliance, and cost-effectiveness, rather than price alone. Heidelberg Materials leads with an 8% market share, benefiting from its comprehensive global network, advanced recycling technologies, and strong partnerships in the building and infrastructure sectors.
Market leaders such as Heidelberg Materials, Holcim, CRH, CEMEX, and Tarmac maintain dominance through their integrated supply chains, large-scale material handling capabilities, and sustainable practices that align with increasing environmental regulations and demand for green construction solutions. Their competitive advantage lies in optimized recycling processes, enhanced material purity, and long-term supplier relationships, which reduce operational costs and increase reliability in delivering quality RCA to construction projects.
Challengers including Aggregate Industries, REMEX, FCC Environment, and Biffa differentiate through regional expertise, tailored solutions, and focus on localized construction needs. Smaller regional players such as Vinci/Eurovia, Vulcan Materials Company, LafargeHolcim, Green Stone Materials, and Martin Marietta Materials also compete by offering customized recycling services, local sourcing advantages, and flexible production capacities to meet demand in specific geographical areas or project types.
Recycled concrete aggregates represent a sustainable construction materials segment within infrastructure development and building construction, projected to grow from USD 10.6 billion in 2025 to USD 22.8 billion by 2035 at an 8.0% CAGR. These processed demolition materials-primarily gravel &crushed stone configurations for infrastructure applications-provide cost-effective alternatives to virgin aggregates while enabling construction and demolition waste diversion, natural resource conservation, and carbon footprint reduction in roads &pavement, concrete production, and civil engineering applications.
Market expansion is driven by increasing circular economy mandates, growing emphasis on sustainable construction practices, expanding infrastructure rehabilitation programs, and rising demand for cost-effective aggregate solutions in resource-constrained regions.
Construction Waste Management Standards: Establish comprehensive technical specifications for RCA production and utilization, including processing requirements, quality grading systems, contamination limits, and application-specific performance standards that ensure consistent material quality in construction projects.
Mandatory Recycling Targets: Develop regulatory frameworks requiring minimum construction and demolition waste recycling rates, such as the EU's 70% recovery target, with enforcement mechanisms that link project permits to waste management plans and material circularity documentation.
Quality Certification Systems: Implement mandatory quality assurance protocols for processed RCA, including standardized testing procedures, performance verification, and certification schemes that build confidence in recycled aggregate performance and enable widespread adoption.
Sustainable Procurement Requirements: Create public sector purchasing guidelines that mandate minimum recycled content in government-funded infrastructure projects, providing market demand certainty and encouraging private sector adoption through demonstration projects.
Economic Incentive Mechanisms: Provide regulatory support through aggregates levy systems on virgin materials, landfill taxes on construction waste, and financial incentives for recycling infrastructure development that improve RCA cost-competitiveness.
Technical Guidelines Development: Develop comprehensive application guidelines for RCA use in various construction applications, optimizing material selection, mix design procedures, and quality control protocols across road base, concrete production, and civil engineering works.
Performance Standards Harmonization: Establish standardized quality specifications, testing methodologies, and performance benchmarks specifically designed for recycled aggregates that enable consistent material characterization and facilitate cross-border trade.
Industry Collaboration Platforms: Create industry-wide knowledge sharing systems for RCA best practices, quality management approaches, and successful case studies that enable comparative analysis and drive continuous improvement across construction projects.
Professional Training Programs: Develop specialized training for construction professionals, quality control technicians, and project engineers covering RCA specification, application techniques, and quality assurance in diverse construction environments.
Sustainability Certification: Facilitate green building certification integration and sustainability performance documentation that recognizes RCA utilization and supports project environmental rating enhancement.
Advanced Processing Investment: Invest in washing and screening technologies, selective separation systems, and contamination removal equipment that enable superior RCA quality approaching virgin aggregate performance while extending application possibilities.
Quality Management Systems: Develop comprehensive quality control platforms with continuous testing, performance monitoring, and certification documentation that optimize material consistency, build customer confidence, and enable premium market positioning.
Application-Specific Products: Engineer specialized RCA grades for different applications, including structural concrete, high-traffic pavements, and drainage systems, with formulations optimized for specific performance requirements and customer needs.
Supply Chain Integration: Establish strategic partnerships with demolition contractors, construction companies, and infrastructure developers to ensure reliable feedstock supply, optimize logistics, and create closed-loop material systems.
Sustainability Communication: Build comprehensive environmental performance documentation demonstrating carbon footprint reduction, natural resource conservation, and circular economy contributions that support customer sustainability objectives.
Early Planning Integration: Conduct comprehensive material sourcing assessments during project design phases, evaluating RCA availability, quality requirements, and application suitability to optimize specification decisions and procurement strategies.
Quality Assurance Collaboration: Implement rigorous material testing programs, supplier qualification procedures, and performance verification systems that ensure RCA meets project specifications while maintaining cost-effectiveness.
Circular Economy Implementation: Utilize comprehensive demolition waste management planning, on-site material segregation, and recycling integration that optimize material recovery, reduce disposal costs, and support sustainability objectives.
Performance Documentation: Integrate RCA performance monitoring with project quality management systems to validate material behavior, support future specification decisions, and demonstrate environmental compliance.
Sustainability Reporting: Develop systematic environmental impact tracking that quantifies virgin aggregate displacement, carbon footprint reduction, and circular economy contributions supporting corporate sustainability goals.
Material Assessment Services: Provide specialized evaluation of RCA quality, application suitability, and performance characteristics that address specific project requirements, environmental conditions, and regulatory constraints.
Specification Development: Offer expertise in developing project-specific RCA specifications, mix design optimization, and quality control protocols that balance performance requirements with sustainability objectives.
Regulatory Compliance Support: Provide specialized knowledge of construction waste regulations, circular economy requirements, and environmental standards to ensure project designs and material selections meet all applicable compliance obligations.
Sustainability Analysis: Develop comprehensive lifecycle assessments, carbon footprint calculations, and environmental impact evaluations that quantify RCA benefits and support green building certification.
Technology Integration: Facilitate adoption of advanced processing systems, quality management platforms, and digital tracking tools that optimize RCA utilization and performance monitoring.
Processing Facility Financing: Provide capital for construction of advanced recycling plants, washing and screening equipment, and material recovery infrastructure that expand high-quality RCA production capacity.
Technology Development Investment: Finance research and development of breakthrough processing technologies, including selective separation systems, automated quality control, and contamination removal innovations that address current quality limitations.
Infrastructure Project Support: Fund sustainable infrastructure development, green building projects, and circular economy initiatives that drive demand for recycled aggregates and demonstrate commercial viability.
Market Development Capital: Support market expansion in emerging economies through financing of regional processing facilities, technology transfer programs, and supply chain infrastructure that enable RCA adoption.
Circular Economy Integration: Provide financing for comprehensive waste management systems, closed-loop construction programs, and demolition waste valorization projects that strengthen circular economy implementation.
| Items | Values |
|---|---|
| Quantitative Units (2025) | USD 10.6 billion |
| Product Type | Gravel &Crushed Stone, Sand, Recycled Fine Aggregates, Others |
| Form | Processed (Washed &Screened, Pre-sorted Structural Grade, High-spec Fines/Fillers), Unprocessed |
| Application | Roads &Pavement, Concrete Production, Landscaping, Others |
| End Use | Non-residential (Infrastructure, Commercial/Industrial, Public Works), Residential |
| Regions Covered | Europe, North America, Asia Pacific, Latin America, Middle East &Africa |
| Countries Covered | Poland, Netherlands, Spain, United Kingdom, France, Germany, Italy, and 40+ countries |
| Key Companies Profiled | Heidelberg Materials, Holcim, CRH, CEMEX, Tarmac, Aggregate Industries, REMEX, FCC Environment, Biffa, Vinci/Eurovia, Vulcan Materials Company, LafargeHolcim, Green Stone Materials, and Martin Marietta Materials |
| Additional Attributes | Dollar sales by product type and application category, regional demand trends, competitive landscape, technological advancements in processing systems, circular economy integration, quality enhancement innovation, and sustainability performance optimization |
The global recycled concrete aggregates market is estimated to be valued at USD 10.6 billion in 2025.
The market size for the recycled concrete aggregates market is projected to reach USD 22.9 billion by 2035.
The recycled concrete aggregates market is expected to grow at a 8.0% CAGR between 2025 and 2035.
The key product types in recycled concrete aggregates market are gravel & crushed stone, sand, recycled fine aggregates and others.
In terms of form, processed segment to command 65.0% share in the recycled concrete aggregates market in 2025.


Our Research Products

The "Full Research Suite" delivers actionable market intel, deep dives on markets or technologies, so clients act faster, cut risk, and unlock growth.

The Leaderboard benchmarks and ranks top vendors, classifying them as Established Leaders, Leading Challengers, or Disruptors & Challengers.

Locates where complements amplify value and substitutes erode it, forecasting net impact by horizon

We deliver granular, decision-grade intel: market sizing, 5-year forecasts, pricing, adoption, usage, revenue, and operational KPIs—plus competitor tracking, regulation, and value chains—across 60 countries broadly.

Spot the shifts before they hit your P&L. We track inflection points, adoption curves, pricing moves, and ecosystem plays to show where demand is heading, why it is changing, and what to do next across high-growth markets and disruptive tech

Real-time reads of user behavior. We track shifting priorities, perceptions of today’s and next-gen services, and provider experience, then pace how fast tech moves from trial to adoption, blending buyer, consumer, and channel inputs with social signals (#WhySwitch, #UX).

Partner with our analyst team to build a custom report designed around your business priorities. From analysing market trends to assessing competitors or crafting bespoke datasets, we tailor insights to your needs.
Supplier Intelligence
Discovery & Profiling
Capacity & Footprint
Performance & Risk
Compliance & Governance
Commercial Readiness
Who Supplies Whom
Scorecards & Shortlists
Playbooks & Docs
Category Intelligence
Definition & Scope
Demand & Use Cases
Cost Drivers
Market Structure
Supply Chain Map
Trade & Policy
Operating Norms
Deliverables
Buyer Intelligence
Account Basics
Spend & Scope
Procurement Model
Vendor Requirements
Terms & Policies
Entry Strategy
Pain Points & Triggers
Outputs
Pricing Analysis
Benchmarks
Trends
Should-Cost
Indexation
Landed Cost
Commercial Terms
Deliverables
Brand Analysis
Positioning & Value Prop
Share & Presence
Customer Evidence
Go-to-Market
Digital & Reputation
Compliance & Trust
KPIs & Gaps
Outputs
Full Research Suite comprises of:
Market outlook & trends analysis
Interviews & case studies
Strategic recommendations
Vendor profiles & capabilities analysis
5-year forecasts
8 regions and 60+ country-level data splits
Market segment data splits
12 months of continuous data updates
DELIVERED AS:
PDF EXCEL ONLINE
Recycled Glass Aggregates Market Size and Share Forecast Outlook 2025 to 2035
Concrete Epoxy Repair Market Size and Share Forecast Outlook 2025 to 2035
Recycled Plastic Packaging Market Size and Share Forecast Outlook 2025 to 2035
Concrete Fiber Market Size and Share Forecast Outlook 2025 to 2035
Recycled Plastic Pipes Market Size and Share Forecast Outlook 2025 to 2035
Concrete Densification and Polishing Material Market Size and Share Forecast Outlook 2025 to 2035
Concrete Surface Retarders Market Size and Share Forecast Outlook 2025 to 2035
Concrete Densifier Market Size and Share Forecast Outlook 2025 to 2035
Concrete Containing Polymer Market Size and Share Forecast Outlook 2025 to 2035
Recycled Ocean Plastic Packaging Market Size and Share Forecast Outlook 2025 to 2035
Concrete Bonding Agents Market Size and Share Forecast Outlook 2025 to 2035
Concrete Block Making Machines Market Size and Share Forecast Outlook 2025 to 2035
Concrete Air Entraining Agents Market Size and Share Forecast Outlook 2025 to 2035
Concrete Placing Booms Market Size and Share Forecast Outlook 2025 to 2035
Recycled Metal Market Size and Share Forecast Outlook 2025 to 2035
Recycled Elastomers Market Size and Share Forecast Outlook 2025 to 2035
Recycled Glass Market Size and Share Forecast Outlook 2025 to 2035
Recycled Thermoplastic Market Size and Share Forecast Outlook 2025 to 2035
Recycled Asphalt Pavement Market Size and Share Forecast Outlook 2025 to 2035
Concrete Accelerators And Retarders Market Size and Share Forecast Outlook 2025 to 2035

Thank you!
You will receive an email from our Business Development Manager. Please be sure to check your SPAM/JUNK folder too.
Chat With
MaRIA