Reports

- Global Locations -

Headquarters

Future Market Insights, Inc.

Christiana Corporate, 200
Continental Drive, Suite 401,
Newark, Delaware - 19713,
United States

T: +1-845-579-5705

Americas

Future Market Insights, Inc.

616 Corporate Way, Suite 2-9018,
Valley Cottage, NY 10989, United States

T: +1-347-918-3531

MEA

Future Market Insights

1602-6 Jumeirah Bay X2 Tower, Plot No: JLT-PH2-X2A,
Jumeirah Lakes Towers, Dubai,
United Arab Emirates

Europe

Future Market Insights

3rd Floor, 207 Regent Street,
W1B 3HH London
United Kingdom

T: + 44 (0) 20 8123 9659
D: +44 (0) 20 3287 4268

Asia Pacific

Future Market Insights

IndiaLand Global Tech Park, Unit UG-1, Behind Grand HighStreet, Phase 1, Hinjawadi, MH, Pune – 411057, India

Recycled Plastic Packaging Market Outlook from 2024 to 2034

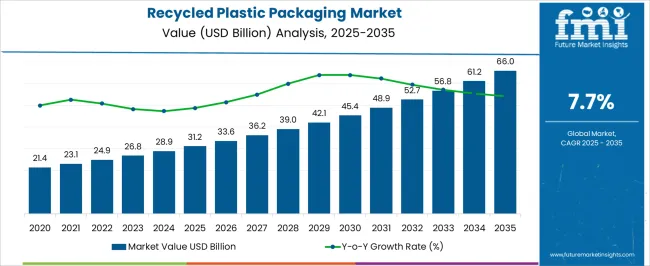
The global recycled plastic packaging market size is estimated to stand at US$ 28.9 billion in 2024. The market valuation is projected to surpass US$ 61.2 billion by 2034, registering a promising CAGR of 7.8%.

Key Highlights

  • Consumers are increasingly concerned about the environmental impact of plastic waste, driving recycled plastic packaging demand.
  • Businesses are joining the global campaign to minimize plastic pollution by using recycled plastic packaging in their sustainability programs.
  • Innovations in recycling technologies are improving the quality and availability of recycled plastics, boosting their acceptance in the packaging industry.
  • By 2034, there is likely to be a twofold surge in the sales of recycled plastic packaging from consumers. This is driven by retailers aiming for sustainability and rising regulatory standards.
  • An encouraging upsurge is anticipated in developing countries like China and India as they welcome recycled plastic packaging and set the stage for substantial expansion.
Attributes Details
Recycled Plastic Packaging Market Size (2024) US$ 28.9 billion
Recycled Plastic Packaging Market Forecasted Size (2034) US$ 61.2 billion
Projected Value CAGR (2024 to 2034) 7.8%

Don't pay for what you don't need

Customize your report by selecting specific countries or regions and save 30%!

Key Factors Influencing the Recycled Plastic Packaging Market Growth: A Comprehensive Analysis of the Top 3 Dynamics

The Rise of Recycled Plastic Consumption in Today's Market: Companies, recognizing environmental concerns, increasingly opt for recycled materials. Contrary to a common belief, sustainable packaging is not always pricier for retailers compared to less eco-friendly options. Also, consumers are crucial since they choose environmentally friendly products. As demand and sustainability converge, a more conscientious and environmentally conscious market is created. This is a sign of positive developments. Meeting sustainability commitments is likely to lead to a surge in demand for recycled plastic packaging by 2034.

Innovative Brands Lead the Way with Recycled Content in Packaging Solutions: Brand owners are actively launching new packaging formats and creating innovative solutions to increase product recyclability and the amount of recycled content. This is driven by their commitment to sustainable packaging, addressing consumer concerns, and adapting to the growing regulatory pressure. These innovative companies understand the importance of minimizing their ecological footprint and have adopted eco-friendly practices. For instance, Unilever's Love Beauty & Planet demonstrates a commitment to environmental stewardship by crafting the packaging for its hair and body care products entirely from 100% recycled plastic.

Governments are Crafting Regulations for Packaging to Redefine a Sustainable Future: Governments are making rules for recycled plastic packaging. They want to make sure it helps the environment. The goal is to reuse materials, stop waste, and encourage responsible production. For instance, in April 2022, plastic packaging taxation (PPT) was implemented with the aim of encouraging businesses to utilize recycled plastic in their plastic packaging. Businesses that import or manufacture 10 tons or more of plastic packaging into the United Kingdom during a rolling 12-month period are required to file paperwork with HMRC in order to pay PPT.

Historical Recycled Plastic Packaging Market Statistic Analysis alongside Future Projections

From 2019 to 2023, the recycled plastic packaging industry showed modest growth, boasting a 4.0% CAGR. During this period, the market witnessed a substantial increase in size, climbing from US$ 23.1 billion in 2019 to reach US$ 27.1 billion in 2023. All through these years, there has been a notable shift in consumer perceptions about sustainable packaging.

Recycled plastic packaging received a lot of attention from retailers, fast-moving consumer goods (FMCG) corporations, and regulatory agencies were taking significant action in this field. FMCG businesses and retailers have taken significant steps in response to public concerns over the waste of single-use packaging. With a growing recyclability ratio, companies are adapting their production processes to meet this eco-conscious demand. This led to substantial actions, fostering a notable trajectory in the growth of post-consumer recycled plastic packaging market.

Historical CAGR (2019 to 2023) 4.0%
Forecasted CAGR (2024 to 2034) 7.8%

Looking at the table above, it is clear that the projected CAGR for the recycled plastic packaging market is higher than its historical CAGR. This suggests positive growth trends. Recycled plastic packaging is becoming a versatile and eco-friendly choice across various industries. This global trends in recycled plastic packaging is expected to continue in the upcoming years. Its sustainable touch can be found in sectors ranging from food and beverage to personal care and beyond. Companies in the consumer goods, retail, and electronics industries are also embracing recycled plastic packaging to reduce environmental impact. As a result, there is a notable increase in per capita packaging consumption, highlighting the positive shift toward environmentally friendly choices across various markets.

Industry Future Prospects
Food and Beverage Governments are promoting the use of recycled plastic packaging across the food and beverage industry. For example, In India, the Food Safety and Standards Authority of India (FSSAI) recently circulated a directive concerning the implementation of the Draft FSS (Packaging) Amendment Regulations, 2022, which allow the implement of recycled plastic for food packaging.
Personal Care and Cosmetics Several businesses have already adopted recycled plastic packaging. L'Oréal, for instance, employs post-consumer recycled plastics in its environmentally friendly cosmetic packaging. Furthermore, recyclable materials make up 80% of the plastic packaging used by Kiehl. As recycling processes become more efficient, the industry is likely to witness a further surge in recycled plastic packaging demand.
Retail and Consumer Goods The future outlook in this industry suggests a shift toward a circular economy where the life cycle of plastic is extended through recycling. Companies with a strong commitment to creating a sustainable future include The Coca-Cola Company. It currently uses only recycled plastic for its 500 ml bottles, saving 29,000 tons of virgin plastic annually.
Electronics The industry is increasingly recognizing the importance of sustainability, prompting a shift toward eco-friendly practices. The top smartphone manufacturer in the world, Samsung Electronics, has made the decision to stop utilizing plastic in packaging by 2025 and to employ recycled plastic components in all of its new flagship Galaxy devices.
Logistics and eCommerce In the ever-evolving landscape of the eCommerce and logistics industry, the utilization of recycled content in packaging industry is gaining momentum. In addition to offering a line of clothes made of recycled materials, Patagonia distributes its goods in bags created from recycled plastic. Flipkart, a company owned by Walmart, likewise wants its supply chain to contain only recycled plastic.
Ismail Sutaria
Ismail Sutaria

Principal Consultant

Talk to Analyst

Find your sweet spots for generating winning opportunities in this market.

Recycled Plastic Packaging Market Trends and Opportunities

Attributes Details
Trends
  • Technological developments have enhanced recycling procedures, increasing their efficiency and cost-effectiveness.
  • Recycled plastic packaging helps create a more resource-efficient and sustainable supply chain by adhering to the principles of the circular economy.
Opportunities
  • With a growing production capacity for recycled materials, the industry is poised to meet the rising package demand while making significant strides toward a more eco-friendly future.
  • Collaboration between packaging manufacturers, retailers, and recycling facilities creates opportunities for integrated and efficient recycling systems.

Comparative Analysis of the Adjacent Recycled Plastic Packaging Market

When it comes to reusability and recyclability in packaging, the recycled plastic packaging market, the biodegradable packaging market, and the zero-waste packaging market are distinguished as separate domains. As per the provided table, from 2024 to 2034, the recycled plastic packaging market exhibits a relatively lower CAGR than the zero-waste packaging market. While recycled plastic packaging remains a crucial component of sustainable practices, its growth rate is somewhat tempered by challenges such as limited recycling infrastructure. Interestingly, it records a higher CAGR than that of the biodegradable packaging market. The advancements in plastic waste recycling in packaging technologies have made it more economically viable for companies to incorporate recycled plastics into their packaging solutions.

Recycled Plastic Packaging Market:

Differentiating Aspects Recycled Plastic Packaging Market
CAGR (2024 to 2034) 7.8%
Projected Market Value in 2034 US$ 61.2 billion
Growth Factor Government regulations promoting the use of recycled materials packaging solutions
Opportunity Innovation in design and manufacturing processes for recycled plastics
Key Trend Brand initiatives showcasing commitment to sustainable packaging

Biodegradable Packaging Market:

Differentiating Aspects Biodegradable Packaging Market
CAGR (2024 to 2034) 6.1%
Projected Market Value in 2034 US$ 912.13 billion
Growth Factor Biodegradable packaging is perceived as a positive choice by consumers
Opportunity Ongoing research is leading to the development of advanced biodegradable materials
Key Trend The rise of eCommerce has spurred demand for sustainable packaging solutions.

Zero-waste Packaging Market:

Differentiating Aspects Zero-waste Packaging Market
CAGR (2024 to 2034) 8.8%
Projected Market Value in 2034 US$ 2.71 billion
Growth Factor Favorable regulations encourage businesses to adopt zero-waste packaging
Opportunity Customization and branding opportunities for sustainable packaging
Key Trend Adoption of compostable materials and emphasis on minimalist design

Get the data you need at a Fraction of the cost

Personalize your report by choosing insights you need
and save 40%!

Recycled Plastic Packaging Market Analysis by Region

North America stands out as a dominant force in the recycled plastic packaging industry, with a substantial increase in demand for sustainable packaging solutions. Meanwhile, Asia Pacific is experiencing rapid growth, fueled by its growing commitment to environmentally friendly practices. These dynamics underscore a global shift toward ecological packaging solutions, with North America leading the way and the Asia Pacific emerging as a key player in this sprouting landscape.

Eco-friendly Wave Sweeps North America's Packaging Industry with Recycled Plastic Surge

North America's packaging sector has experienced significant transformation in recent years, driven by advancements in digital printing, sustainability, and eCommerce expansion. This has led to a rise in the demand for packaging made of recycled plastic. Since recycled plastics have a lower carbon footprint during production than virgin plastics, end-use industries are turning their attention to using recycled plastics for packaging.

Countries Forecasted CAGR (2024 to 2034)
United States 5.3%
Canada 6.5%

The United States’ market is driven by ever-sophisticated and better processing methods of eco-friendly plastic packaging. Government agencies and other organizations work with the leading players in the recyclable packaging materials industry to promote their packaging. Several businesses and brand houses have made promises to include 25% of post-consumer recycled plastic in their packaging by 2025 in response to growing investor and consumer scrutiny of the environmental effects of plastic packaging. For instance, Hamilton Perkins Collection took a sustainable leap by crafting Earth Bags exclusively from 100% recycled plastic bottles.

Canada is expected to expand at a faster rate since numerous sectors are implementing innovative packaging processes. The surge in exports of packaged foods is driving a growing demand for recycled plastic packaging. Canada exports processed food products to a staggering 190 countries, with a substantial portion reaching key markets such as the United States, China, Japan, Mexico, Russia, and South Korea. In October 2023, Coca-Cola declared that by early 2024, all 500 ml sparkling beverage bottles in Canada are going to be constructed entirely of recycled plastic.

Europe's Commitment to Sustainability Boosts Recycled Plastic Packaging Demand

In terms of sustainability, Europe is renowned for its rigorous regulations. Europe's expanding demand for packaged food and non-food products is driving growth in the retail sector. It generates an exclusive demand for environmentally friendly packaging options, which is anticipated to greatly boost the recycled plastic packaging market growth.

Countries Forecasted CAGR (2024 to 2034)
United Kingdom 6.3%
Germany 5.0%

The government of the United Kingdom has put laws into place to support recycling, cut down on single-use plastics, and increase the amount of recycled plastic that is used in packaging. As a result of these more stringent regulations, many firms are working toward incorporating eco-friendly plastic packaging. These factors are likely to propel the expansion of the recycled plastic packaging market in the United Kingdom. Magnum wants 100% of their tubs to be composed of recycled plastic by 2025. In 2021, Magnum produced over 30 million tubs using 750MT of recycled plastic.

Consumers are becoming more health conscious, which is driving up demand for healthier food and beverages. This is one of the main factors propelling the Germany recycled plastic packaging market growth. Gutfried, BASF, SABIC, and SÜDPACK united to develop an eco-friendly recycled plastic packaging solution for sausages in Germany. Packaging design for recycling and recyclability, as well as the use of recyclable and renewable materials, are imposed by German package law. Germany is going to enforce the 'Mehrwegpflicht,' or the requirement to provide reusable packaging, as of January 2023.

Asia Pacific Ramps up Infrastructure, Boosting Availability of Recycled Plastic Materials

With a sizable middle class and rising population, Asia Pacific is becoming a hotspot for the recycled plastic packaging market, especially in the food and beverage industry, where there is a growing need for packaged goods. Growing consumption has made sustainable packaging solutions a top priority for local and global businesses in order to comply with regulations and address environmental issues.

Countries Forecasted CAGR (2024 to 2034)
China 8.7%
India 9.1%

China is making significant investments in cutting-edge recycling technology, such as the recycling of biodegradable plastic and industrial composting. High-quality recyclable packaging materials are now more readily available as a result of their concentration on improving waste management and recycling infrastructure. Recycled plastic packaging is becoming increasingly popular in China, a country with enormous development potential due to a move toward eco-friendly alternatives. Mengniu, a well-known dairy company in China, is the first company in the country's food business to employ recycled plastic shrink film for its dairy products' secondary packaging.

The growing food and beverage industry in India, together with the personal care and cosmetics sectors, is driving the recycled plastic packaging market expansion. In July 2023, Himalaya Herbals, a much-loved Indian brand known for its diverse range of personal care and wellness products, took significant strides toward environmental responsibility. It has embraced sustainability by minimizing plastic packaging and instead opting for eco-friendly alternatives such as recyclable bottles and tubes crafted from post-consumer recycled plastic. The market in India has also benefited from the tremendous expansion of eCommerce sector.

Recycled Plastic Packaging Market Analysis by Segment

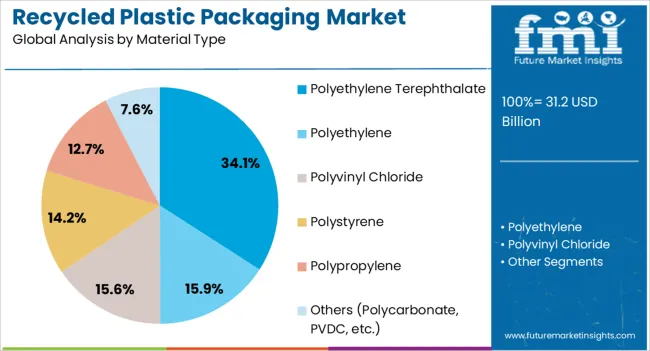
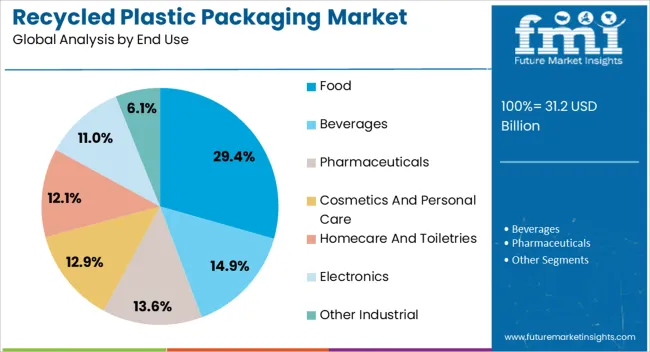
As far as the material is concerned, the polyethylene terephthalate (PET) segment is likely to dominate the industry in 2024, accounting for a 43.7% market share. Similarly, the food segment is expected to take the lead when considering end use, commanding an 18.90% recycled plastic packaging market share in 2024.

Segment Market Share in 2024
Polyethylene Terephthalate (PET) Material 43.7%
Food End Use 31.8%

PET is Redefining Packaging with Strength, Recyclability, and Cost Efficiency

PET, or polyethylene terephthalate, is a common polymer used in packaging. The widespread usage of PET in beverage and food packaging is the main reason behind its dominance in the market. PET is a material that has several benefits, including a high strength-to-weight ratio, shatterproof nature, and non-reactivity when exposed to food or beverage. When items are transported in PET packaging, lightweightness also results in cost savings.

PET is more appealing since it can be recycled, which is compatible with the increasing emphasis on environmental conscience. The material's supremacy in the market is primarily due to its simplicity of processing, which offers solutions at a reasonable price without sacrificing quality. PET continues to set the standard for recycled plastic packaging in response to the growing sales of recycled plastic envelope.

Food Industry Pioneers Embrace Recycled Plastic Packaging for a Green Future

The burgeoning food and beverage sector offers a substantial prospect for the recycled plastic packaging market. Companies are actively looking for sustainable packaging solutions worldwide to meet customer expectations and environmental aims as the world's food consumption rises. With its eco-friendly reputation and less carbon impact, recycled plastic packaging is well-positioned to satisfy this demand.
Several food businesses are switching to recycled plastic materials to show their dedication to sustainability and lessen their reliance on virgin plastics. One of the top food and beverage businesses in the world uses rPET (recycled plastic PET) food packaging, which is made in South America by New World Recycling. The company uses a method that complies with food contact regulations to recycle plastics for use in food packaging. About 300 million PET bottles are recycled in a closed-loop process and repurposed into useful containers as a consequence of their food packaging recycling program.

Start-ups Strategically Seize Opportunities in the Recycled Plastic Packaging Market

In a bid to dominate the market, start-ups leverage innovation by developing eco-friendly alternatives. They focus on cost-effective solutions, ensuring competitive pricing while maintaining high-quality standards. EcoPackables, a forward-thinking start-up rooted in the United States, is on a mission to craft sustainable packaging solutions from repurposed materials. The company employs compostable and customizable raw materials, including polymers, recycled plastic, and recycled paper. Its product line encompasses compostable shipping labels made from post-consumer recycled white paper with a non-toxic adhesive. This showcases the commitment to environmentally friendly solutions.
Competitive Landscape

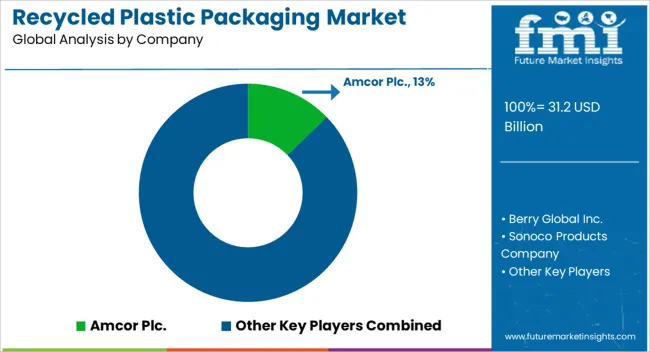
Recycled plastic packaging market players deploy multiple strategies to hone down on their specialty. Certain emphasize state-of-the-art technical advancements that improve their longevity and performance. A strong eco-friendly brand image is established by those who value sustainable sourcing. A handful of them prioritize cost leadership by optimizing production procedures to provide competitive prices. Some companies' strong supply chains are a result of their strategic partnership with suppliers and relationships with important recycling industry players.

Recent Developments

  • In February 2023, Mobil™, a pioneer in the field of innovative lubrication technology, introduced 50% Post-consumer Recycled plastic pails as part of an effort to promote environmentally friendly packaging. Incentives such as the PCR pails encourage the use of recycled plastic, which lowers plastic waste in the packaging industry and promotes sustainable development.
  • In July 2023, Berry Global, an Indiana-based firm, developed a line of reusable bottles for The Bio-D Co., a Hull, United Kingdom cleaning company that prioritizes ethics and the environment. These bottles are manufactured completely of recycled plastic (PCR). The bottles are going to come in three different capacities: 25 ounces, 33 ounces, and 1.3 gallons.
  • In September 2023, the top-selling Organic Potting Mix Company in North America, Back to the Roots, announced a groundbreaking initiative for the upcoming 2024 gardening season. The company’s packaging is going to convert to 100% post-consumer-recycled (PCR) certified circular plastic bags, an unprecedented move for the soil segment.

Key Industry Players in the Recycled Plastic Packaging Market

  • Amcor Plc.
  • Berry Global Inc.
  • Sonoco Products Company
  • Sealed Air Corporation
  • Indorama Ventures Public Co., Ltd
  • Gerresheimer AG
  • ALPLA Werke Alwin Lehner GmbH & Co KG
  • Plastipak Holdings, Inc.
  • UFlex Limited
  • Placon Corp.
  • Retal Industries LTD.
  • Genpak, LLC
  • Alpha Packaging
  • Phoenix Technologies
  • CKF, Inc.
  • Pactiv Corporation
  • Anchor Packaging Inc.
  • Faerch A/S

Key Segments in the Recycled Plastic Packaging Market Report

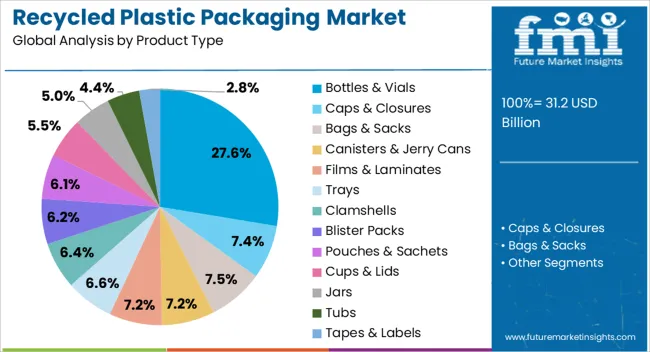
By Product Type:

  • Caps & Closures
  • Bags & Sacks
  • Bottles & Vials
  • Canisters & Jerry Cans
  • Films & Laminates
  • Trays
  • Clamshells
  • Blister Packs
  • Pouches & Sachets
  • Cups & Lids
  • Jars
  • Tubs
  • Tapes & Labels

By Material Type:

  • Polyethylene
  • Polyvinyl Chloride
  • Polystyrene
  • Polypropylene
  • Polyethylene Terephthalate
  • Others (Polycarbonate, PVDC, etc.)

By End Use:

  • Food
  • Beverages
  • Pharmaceuticals
  • Cosmetics and Personal Care
  • Homecare and Toiletries
  • Electronics
  • Other Industrial

By Manufacturing:

  • In-house Manufacturing
  • Contract Manufacturing

By Region:

  • North America
  • Latin America
  • East Asia
  • South Asia & Pacific
  • Western Europe
  • Eastern Europe
  • Central Asia
  • Russia & Belarus
  • Balkan Countries
  • Baltic Countries
  • Middle East and Africa (MEA)

Frequently Asked Questions

How Big is the Recycled Plastic Packaging Industry?

The recycled plastic packaging market is set to be valued at US$ 28.9 billion in 2024.

What is the Future Forecast of the Recycled Plastic Packaging Market?

The global recycled plastic packaging market size is projected to surpass US$ 61.2 billion by 2034.

What is the Projected CAGR for the Recycled Plastic Packaging Market?

The CAGR of the recycled plastic packaging industry is estimated to be around 7.8% through 2034.

Who is the Market Leader in Recycled Plastic Packaging?

Amcor Plc. and Berry Global Inc. are recycled plastic packaging market leaders.

Which Countries Drive the Demand for Recycled Plastic Packaging?

The United States, Germany, and India are key consumers of recycled plastic packaging.

Table of Content

1. Executive Summary

    1.1. Global Market Outlook

    1.2. Market Analysis

    1.3. Analysis and Recommendations

2. Market Overview

    2.1. Market Coverage / Taxonomy

    2.2. Market Definition / Scope / Limitations

3. Key Market Trends

    3.1. Key Trends Impacting the Market

    3.2. Technological Trends

    3.3. Product Innovation / Development Trends

4. Key Success Factors

    4.1. Product Adoption / Usage Analysis

    4.2. Product USPs / Features

    4.3. Go-To-Market Strategies

5. Global Market Demand Analysis 2019 to 2023 and Forecast, 2024 to 2034

    5.1. Historical Market Volume (Tons) Analysis, 2019 to 2023

    5.2. Current and Future Market Volume (Tons) Projections, 2024 to 2034

    5.3. Y-o-Y Growth Trend Analysis

6. Global Market - Pricing Analysis

    6.1. Regional Pricing Analysis By Product Type

    6.2. Global Average Pricing Analysis Benchmark

7. Global Market Demand (in Value or Size in US$ Million) Analysis 2019 to 2023 and Forecast, 2024 to 2034

    7.1. Historical Market Value (US$ Million) Analysis, 2019 to 2023

    7.2. Current and Future Market Value (US$ Million) Projections, 2024 to 2034

        7.2.1. Y-o-Y Growth Trend Analysis

        7.2.2. Absolute $ Opportunity Analysis

8. Market Background

    8.1. Global Packaging Market Outlook

    8.2. Forecast Factors - Relevance & Impact

    8.3. Value Chain Analysis

        8.3.1. Exhaustive List of Raw Material Suppliers

        8.3.2. Exhaustive List of Manufacturers

        8.3.3. Exhaustive List of End Users / Brand Owners

    8.4. Case-based Scenario – Impact Assessment

        8.4.1. Current Statistics

        8.4.2. Short-Mid-Long Term Outlook

        8.4.3. Likely Rebound

    8.5. Market Dynamics

        8.5.1. Drivers

        8.5.2. Restraints

        8.5.3. Opportunity Analysis

    8.6. Supply Demand Analysis for Recycled Plastic Packaging

        8.6.1. Import Data

        8.6.2. Export Data

9. Global Market Analysis 2019 to 2023 and Forecast 2024 to 2034, By Product Type

    9.1. Introduction / Key Findings

    9.2. Historical Market Size (US$ Million) and Volume (Tons) Analysis By Product Type, 2019 to 2023

    9.3. Current and Future Market Size (US$ Million) and Volume (Tons) Analysis and Forecast By Product Type, 2024 to 2034

        9.3.1. Caps & Closures

        9.3.2. Bags & Sacks

        9.3.3. Bottles & Vials

        9.3.4. Canisters & Jerry Cans

        9.3.5. Films & Laminates

        9.3.6. Trays

        9.3.7. Clamshells

        9.3.8. Blister Packs

        9.3.9. Pouches & Sachets

        9.3.10. Cups & Lids

        9.3.11. Jars

        9.3.12. Tubs

        9.3.13. Tapes & Labels

    9.4. Market Attractiveness Analysis By Product Type

10. Global Market Analysis 2019 to 2023 and Forecast 2024 to 2034, By Material Type

    10.1. Introduction / Key Findings

    10.2. Historical Market Size (US$ Million) and Volume (Tons) Analysis By Material Type, 2019 to 2023

    10.3. Current and Future Market Size (US$ Million) and Volume (Tons) Analysis and Forecast By Material Type, 2024 to 2034

        10.3.1. Polyethylene

            10.3.1.1. Low Density Polyethylene (LDPE)

            10.3.1.2. High Density Polyethylene (HDPE)

            10.3.1.3. Linear Low Density Polyethylene (LLDPE)

        10.3.2. Polyvinyl Chloride

        10.3.3. Polystyrene

        10.3.4. Polypropylene

        10.3.5. Bi-axially Oriented Polypropylene (BOPP)

        10.3.6. Cast Polypropylene (CPP)

        10.3.7. Polyethylene Terephthalate

            10.3.7.1. Bi-axially oriented Polyethylene Terephthalate (BoPET)

            10.3.7.2. Metallized PET

        10.3.8. Others (Polycarbonate, PVDC, etc.)

    10.4. Market Attractiveness Analysis By Material Type

11. Global Market Analysis 2019 to 2023 and Forecast 2024 to 2034, By Manufacturing

    11.1. Introduction / Key Findings

    11.2. Historical Market Size (US$ Million) and Volume (Tons) Analysis By Manufacturing, 2019 to 2023

    11.3. Current and Future Market Size (US$ Million) and Volume (Tons) Analysis and Forecast By Manufacturing, 2024 to 2034

        11.3.1. In-house Manufacturing

        11.3.2. Contract Manufacturing

    11.4. Market Attractiveness Analysis By Manufacturing

12. Global Market Analysis 2019 to 2023 and Forecast 2024 to 2034, by End Use Industry

    12.1. Introduction / Key Findings

    12.2. Historical Market Size (US$ Million) and Volume (Tons) Analysis By End Use Industry, 2019 to 2023

    12.3. Current and Future Market Size (US$ Million) and Volume (Tons) Analysis and Forecast By End Use Industry, 2024 to 2034

        12.3.1. Food

            12.3.1.1. Fresh Produce

            12.3.1.2. Dairy Products

            12.3.1.3. Bakery & Confectionery

            12.3.1.4. Sauces & Condiments

            12.3.1.5. Snacks

            12.3.1.6. Edible Oil

            12.3.1.7. Processed Food Products

        12.3.2. Beverages

            12.3.2.1. Alcoholic Beverages

            12.3.2.2. Non-Alcoholic Beverages

        12.3.3. Pharmaceuticals

        12.3.4. Cosmetics and Personal Care

            12.3.4.1. Skin Care

            12.3.4.2. Hair Care

            12.3.4.3. Color Cosmetics

        12.3.5. Homecare and Toiletries

        12.3.6. Electronics

        12.3.7. Other Industrial

    12.4. Market Attractiveness Analysis By End Use Industry

13. Global Market Analysis 2019 to 2023 and Forecast 2024 to 2034, by Region

    13.1. Introduction / Key Findings

    13.2. Historical Market Size (US$ Million) and Volume (Tons) Analysis By Region, 2019 to 2023

    13.3. Current and Future Market Size (US$ Million) and Volume (Tons) Analysis and Forecast By Region, 2024 to 2034

        13.3.1. North America

        13.3.2. Latin America

        13.3.3. East Asia

        13.3.4. South Asia & Pacific

        13.3.5. Western Europe

        13.3.6. Eastern Europe

        13.3.7. Central Asia

        13.3.8. Russia & Belarus

        13.3.9. Balkan Countries

        13.3.10. Baltic Countries

        13.3.11. Middle East and Africa (MEA)

    13.4. Market Attractiveness Analysis By Region

14. North America Market Analysis 2019 to 2023 and Forecast 2024 to 2034

    14.1. Introduction / Key Findings

    14.2. Historical Market Size (US$ Million) and Volume (Tons) Analysis by Market Taxonomy, 2019 to 2023

    14.3. Current Market Size (US$ Million) and Volume (Tons) Analysis and Forecast by Market Taxonomy, 2024 to 2034

        14.3.1. By Country

            14.3.1.1. USA

            14.3.1.2. Canada

        14.3.2. By Material Type

        14.3.3. By Product Type

        14.3.4. By Manufacturing

        14.3.5. By End Use Industry

    14.4. Market Attractiveness Analysis

        14.4.1. By Country

        14.4.2. By Material Type

        14.4.3. By Product Type

        14.4.4. By Manufacturing

        14.4.5. By End Use Industry

15. Latin America Market Analysis 2019 to 2023 and Forecast 2024 to 2034

    15.1. Introduction / Key Findings

    15.2. Historical Market Size (US$ Million) and Volume (Tons) Analysis by Market Taxonomy, 2019 to 2023

    15.3. Current Market Size (US$ Million) and Volume (Tons) Analysis and Forecast by Market Taxonomy, 2024 to 2034

        15.3.1. By Country

            15.3.1.1. Brazil

            15.3.1.2. Mexico

            15.3.1.3. Argentina

            15.3.1.4. Rest of Latin America

        15.3.2. By Material Type

        15.3.3. By Product Type

        15.3.4. By Manufacturing

        15.3.5. By End Use Industry

    15.4. Market Attractiveness Analysis

        15.4.1. By Country

        15.4.2. By Material Type

        15.4.3. By Product Type

        15.4.4. By Manufacturing

        15.4.5. By End Use Industry

16. East Asia Market Analysis 2019 to 2023 and Forecast 2024 to 2034

    16.1. Introduction / Key Findings

    16.2. Historical Market Size (US$ Million) and Volume (Tons) Analysis by Market Taxonomy, 2019 to 2023

    16.3. Current Market Size (US$ Million) and Volume (Tons) Analysis and Forecast by Market Taxonomy, 2024 to 2034

        16.3.1. By Country

            16.3.1.1. China

            16.3.1.2. Japan

            16.3.1.3. South Korea

        16.3.2. By Material Type

        16.3.3. By Product Type

        16.3.4. By Manufacturing

        16.3.5. By End Use Industry

    16.4. Market Attractiveness Analysis

        16.4.1. By Country

        16.4.2. By Material Type

        16.4.3. By Product Type

        16.4.4. By Manufacturing

        16.4.5. By End Use Industry

17. South Asia & Pacific Market Analysis 2019 to 2023 and Forecast 2024 to 2034

    17.1. Introduction / Key Findings

    17.2. Historical Market Size (US$ Million) and Volume (Tons) Analysis by Market Taxonomy, 2019 to 2023

    17.3. Current Market Size (US$ Million) and Volume (Tons) Analysis and Forecast by Market Taxonomy, 2024 to 2034

        17.3.1. By Country

            17.3.1.1. India

            17.3.1.2. ASEAN

            17.3.1.3. Australia & New Zealand

        17.3.2. By Material Type

        17.3.3. By Product Type

        17.3.4. By Manufacturing

        17.3.5. By End Use Industry

    17.4. Market Attractiveness Analysis

        17.4.1. By Country

        17.4.2. By Material Type

        17.4.3. By Product Type

        17.4.4. By Manufacturing

        17.4.5. By End Use Industry

18. Western Europe Market Analysis 2019 to 2023 and Forecast 2024 to 2034

    18.1. Introduction / Key Findings

    18.2. Historical Market Size (US$ million) and Volume (Tons) Analysis by Market Taxonomy, 2019 to 2023

    18.3. Current Market Size (US$ million) and Volume (Tons) Analysis and Forecast by Market Taxonomy, 2024 to 2034

        18.3.1. By Country

            18.3.1.1. Germany

            18.3.1.2. France

            18.3.1.3. Spain

            18.3.1.4. Italy

            18.3.1.5. United Kingdom

            18.3.1.6. BENELUX

            18.3.1.7. Nordics

            18.3.1.8. Rest of Western Europe

        18.3.2. By Material Type

        18.3.3. By Product Type

        18.3.4. By Manufacturing

        18.3.5. By End Use Industry

    18.4. Market Attractiveness Analysis

        18.4.1. By Country

        18.4.2. By Material Type

        18.4.3. By Product Type

        18.4.4. By Manufacturing

        18.4.5. By End Use Industry

19. Eastern Europe Market Analysis 2019 to 2023 and Forecast 2024 to 2034

    19.1. Introduction / Key Findings

    19.2. Historical Market Size (US$ million) and Volume (Tons) Analysis by Market Taxonomy, 2019 to 2023

    19.3. Current Market Size (US$ million) and Volume (Tons) Analysis and Forecast by Market Taxonomy, 2024 to 2034

        19.3.1. By Country

            19.3.1.1. Poland

            19.3.1.2. Hungary

            19.3.1.3. Austria

            19.3.1.4. Czech Republic

            19.3.1.5. Rest of Eastern Europe

        19.3.2. By Material Type

        19.3.3. By Product Type

        19.3.4. By Manufacturing

        19.3.5. By End Use Industry

    19.4. Market Attractiveness Analysis

        19.4.1. By Country

        19.4.2. By Material Type

        19.4.3. By Product Type

        19.4.4. By Manufacturing

        19.4.5. By End Use Industry

20. Central Asia Market Analysis 2019 to 2023 and Forecast 2024 to 2034

    20.1. Introduction / Key Findings

    20.2. Historical Market Size (US$ million) and Volume (Tons) Analysis by Market Taxonomy, 2019 to 2023

    20.3. Current Market Size (US$ million) and Volume (Tons) Analysis and Forecast by Market Taxonomy, 2024 to 2034

        20.3.1. By Country

            20.3.1.1. Kazakhstan

            20.3.1.2. Kyrgyzstan

            20.3.1.3. Tajikistan

            20.3.1.4. Turkmenistan

            20.3.1.5. Uzbekistan

        20.3.2. By Material Type

        20.3.3. By Product Type

        20.3.4. By Manufacturing

        20.3.5. By End Use Industry

    20.4. Market Attractiveness Analysis

        20.4.1. By Country

        20.4.2. By Material Type

        20.4.3. By Product Type

        20.4.4. By Manufacturing

        20.4.5. By End Use Industry

21. Russia & Belarus Market Analysis 2019 to 2023 and Forecast 2024 to 2034

    21.1. Introduction / Key Findings

    21.2. Historical Market Size (US$ million) and Volume (Tons) Analysis by Market Taxonomy, 2019 to 2023

    21.3. Current Market Size (US$ million) and Volume (Tons) Analysis and Forecast by Market Taxonomy, 2024 to 2034

        21.3.1. By Country

            21.3.1.1. Russia

            21.3.1.2. Belarus

        21.3.2. By Material Type

        21.3.3. By Product Type

        21.3.4. By Manufacturing

        21.3.5. By End Use Industry

    21.4. Market Attractiveness Analysis

        21.4.1. By Country

        21.4.2. By Material Type

        21.4.3. By Product Type

        21.4.4. By Manufacturing

        21.4.5. By End Use Industry

22. Balkan Countries Market Analysis 2019 to 2023 and Forecast 2024 to 2034

    22.1. Introduction / Key Findings

    22.2. Historical Market Size (US$ million) and Volume (Tons) Analysis by Market Taxonomy, 2019 to 2023

    22.3. Current Market Size (US$ million) and Volume (Tons) Analysis and Forecast by Market Taxonomy, 2024 to 2034

        22.3.1. By Country

            22.3.1.1. Romania

            22.3.1.2. Greece

            22.3.1.3. Bulgaria

        22.3.2. By Material Type

        22.3.3. By Product Type

        22.3.4. By Manufacturing

        22.3.5. By End Use Industry

    22.4. Market Attractiveness Analysis

        22.4.1. By Country

        22.4.2. By Material Type

        22.4.3. By Product Type

        22.4.4. By Manufacturing

        22.4.5. By End Use Industry

23. Baltic Countries Market Analysis 2019 to 2023 and Forecast 2024 to 2034

    23.1. Introduction / Key Findings

    23.2. Historical Market Size (US$ million) and Volume (Tons) Analysis by Market Taxonomy, 2019 to 2023

    23.3. Current Market Size (US$ million) and Volume (Tons) Analysis and Forecast by Market Taxonomy, 2024 to 2034

        23.3.1. By Country

            23.3.1.1. Lithuania

            23.3.1.2. Estonia

            23.3.1.3. Latvia

        23.3.2. By Material Type

        23.3.3. By Product Type

        23.3.4. By Manufacturing

        23.3.5. By End Use Industry

    23.4. Market Attractiveness Analysis

        23.4.1. By Country

        23.4.2. By Material Type

        23.4.3. By Product Type

        23.4.4. By Manufacturing

        23.4.5. By End Use Industry

24. Middle East & Africa Market Analysis 2019 to 2023 and Forecast 2024 to 2034

    24.1. Introduction / Key Findings

    24.2. Historical Market Size (US$ million) and Volume (Tons) Analysis by Market Taxonomy, 2019 to 2023

    24.3. Current Market Size (US$ million) and Volume (Tons) Analysis and Forecast by Market Taxonomy, 2024 to 2034

        24.3.1. By Country

            24.3.1.1. GCC Countries

            24.3.1.2. Turkey

            24.3.1.3. Northern Africa

            24.3.1.4. South Africa

            24.3.1.5. Israel

        24.3.2. By Material Type

        24.3.3. By Product Type

        24.3.4. By Manufacturing

        24.3.5. By End Use Industry

    24.4. Market Attractiveness Analysis

        24.4.1. By Country

        24.4.2. By Material Type

        24.4.3. By Product Type

        24.4.4. By Manufacturing

        24.4.5. By End Use Industry

25. Country wise Market Analysis 2024 to 2034

    25.1. USA Market Analysis

        25.1.1. By Material Type

        25.1.2. By Product Type

        25.1.3. By Manufacturing

        25.1.4. By End Use Industry

    25.2. Canada Market Analysis

        25.2.1. By Material Type

        25.2.2. By Product Type

        25.2.3. By Manufacturing

        25.2.4. By End Use Industry

    25.3. Brazil Market Analysis

        25.3.1. By Material Type

        25.3.2. By Product Type

        25.3.3. By Manufacturing

        25.3.4. By End Use Industry

    25.4. Mexico Market Analysis

        25.4.1. By Material Type

        25.4.2. By Product Type

        25.4.3. By Manufacturing

        25.4.4. By End Use Industry

    25.5. Germany Market Analysis

        25.5.1. By Material Type

        25.5.2. By Product Type

        25.5.3. By Manufacturing

        25.5.4. By End Use Industry

    25.6. UK Market Analysis

        25.6.1. By Material Type

        25.6.2. By Product Type

        25.6.3. By Manufacturing

        25.6.4. By End Use Industry

    25.7. Spain Market Analysis

        25.7.1. By Material Type

        25.7.2. By Product Type

        25.7.3. By Manufacturing

        25.7.4. By End Use Industry

    25.8. France Market Analysis

        25.8.1. By Material Type

        25.8.2. By Product Type

        25.8.3. By Manufacturing

        25.8.4. By End Use Industry

    25.9. Italy Market Analysis

        25.9.1. By Material Type

        25.9.2. By Product Type

        25.9.3. By Manufacturing

        25.9.4. By End Use Industry

    25.10. Russia Market Analysis

        25.10.1. By Material Type

        25.10.2. By Product Type

        25.10.3. By Manufacturing

        25.10.4. By End Use Industry

    25.11. China Market Analysis

        25.11.1. By Material Type

        25.11.2. By Product Type

        25.11.3. By Manufacturing

        25.11.4. By End Use Industry

    25.12. Japan Market Analysis

        25.12.1. By Material Type

        25.12.2. By Product Type

        25.12.3. By Manufacturing

        25.12.4. By End Use Industry

    25.13. India Market Analysis

        25.13.1. By Material Type

        25.13.2. By Product Type

        25.13.3. By Manufacturing

        25.13.4. By End Use Industry

    25.14. GCC Market Analysis

        25.14.1. By Material Type

        25.14.2. By Product Type

        25.14.3. By Manufacturing

        25.14.4. By End Use Industry

    25.15. Australia Market Analysis

        25.15.1. By Material Type

        25.15.2. By Product Type

        25.15.3. By Manufacturing

        25.15.4. By End Use Industry

26. Market Structure Analysis

    26.1. Market Analysis by Tier of Companies

    26.2. Market Share Analysis of Top Players

    26.3. Market Presence Analysis

27. Competition Analysis

    27.1. Competition Dashboard

    27.2. Competition Benchmarking

    27.3. Competition Deep Dive

        27.3.1. Amcor Plc

            27.3.1.1. Overview

            27.3.1.2. Material Portfolio

            27.3.1.3. Profitability by Market Segments (Material/Channel/Region)

            27.3.1.4. Sales Footprint

            27.3.1.5. Strategy Overview

        27.3.2. Berry Global Inc

        27.3.3. Sonoco Products Company

        27.3.4. Sealed Air Corporation

        27.3.5. Indorama Ventures Public Co., Ltd

        27.3.6. Gerresheimer AG

        27.3.7. ALPLA Werke Alwin Lehner GmbH & Co KG

        27.3.8. Plastipak Holdings, Inc.

        27.3.9. UFlex Limited

        27.3.10. Placon Corp

        27.3.11. Retal Industries LTD.

        27.3.12. Genpak, LLC

        27.3.13. Alpha Packaging

        27.3.14. Phoenix Technologies

        27.3.15. CKF, Inc.

        27.3.16. Pactiv Corporation

        27.3.17. Anchor Packaging Inc.

        27.3.18. Faerch A/S

28. Assumptions and Acronyms Used

29. Research Methodology

List of Tables

Table 1: Global Market Value (US$ Million) Forecast by Region, 2019 to 2034

Table 2: Global Market Volume (Tons) Forecast by Region, 2019 to 2034

Table 3: Global Market Value (US$ Million) Forecast by Product Type, 2019 to 2034

Table 4: Global Market Volume (Tons) Forecast by Product Type, 2019 to 2034

Table 5: Global Market Value (US$ Million) Forecast by Material , 2019 to 2034

Table 6: Global Market Volume (Tons) Forecast by Material , 2019 to 2034

Table 7: Global Market Value (US$ Million) Forecast by Manufacturing, 2019 to 2034

Table 8: Global Market Volume (Tons) Forecast by Manufacturing, 2019 to 2034

Table 9: Global Market Value (US$ Million) Forecast by End Use Industry, 2019 to 2034

Table 10: Global Market Volume (Tons) Forecast by End Use Industry, 2019 to 2034

Table 11: North America Market Value (US$ Million) Forecast by Country, 2019 to 2034

Table 12: North America Market Volume (Tons) Forecast by Country, 2019 to 2034

Table 13: North America Market Value (US$ Million) Forecast by Product Type, 2019 to 2034

Table 14: North America Market Volume (Tons) Forecast by Product Type, 2019 to 2034

Table 15: North America Market Value (US$ Million) Forecast by Material , 2019 to 2034

Table 16: North America Market Volume (Tons) Forecast by Material , 2019 to 2034

Table 17: North America Market Value (US$ Million) Forecast by Manufacturing, 2019 to 2034

Table 18: North America Market Volume (Tons) Forecast by Manufacturing, 2019 to 2034

Table 19: North America Market Value (US$ Million) Forecast by End Use Industry, 2019 to 2034

Table 20: North America Market Volume (Tons) Forecast by End Use Industry, 2019 to 2034

Table 21: Latin America Market Value (US$ Million) Forecast by Country, 2019 to 2034

Table 22: Latin America Market Volume (Tons) Forecast by Country, 2019 to 2034

Table 23: Latin America Market Value (US$ Million) Forecast by Product Type, 2019 to 2034

Table 24: Latin America Market Volume (Tons) Forecast by Product Type, 2019 to 2034

Table 25: Latin America Market Value (US$ Million) Forecast by Material , 2019 to 2034

Table 26: Latin America Market Volume (Tons) Forecast by Material , 2019 to 2034

Table 27: Latin America Market Value (US$ Million) Forecast by Manufacturing, 2019 to 2034

Table 28: Latin America Market Volume (Tons) Forecast by Manufacturing, 2019 to 2034

Table 29: Latin America Market Value (US$ Million) Forecast by End Use Industry, 2019 to 2034

Table 30: Latin America Market Volume (Tons) Forecast by End Use Industry, 2019 to 2034

Table 31: East Asia Market Value (US$ Million) Forecast by Country, 2019 to 2034

Table 32: East Asia Market Volume (Tons) Forecast by Country, 2019 to 2034

Table 33: East Asia Market Value (US$ Million) Forecast by Product Type, 2019 to 2034

Table 34: East Asia Market Volume (Tons) Forecast by Product Type, 2019 to 2034

Table 35: East Asia Market Value (US$ Million) Forecast by Material , 2019 to 2034

Table 36: East Asia Market Volume (Tons) Forecast by Material , 2019 to 2034

Table 37: East Asia Market Value (US$ Million) Forecast by Manufacturing, 2019 to 2034

Table 38: East Asia Market Volume (Tons) Forecast by Manufacturing, 2019 to 2034

Table 39: East Asia Market Value (US$ Million) Forecast by End Use Industry, 2019 to 2034

Table 40: East Asia Market Volume (Tons) Forecast by End Use Industry, 2019 to 2034

Table 41: South Asia and Pacific Market Value (US$ Million) Forecast by Country, 2019 to 2034

Table 42: South Asia and Pacific Market Volume (Tons) Forecast by Country, 2019 to 2034

Table 43: South Asia and Pacific Market Value (US$ Million) Forecast by Product Type, 2019 to 2034

Table 44: South Asia and Pacific Market Volume (Tons) Forecast by Product Type, 2019 to 2034

Table 45: South Asia and Pacific Market Value (US$ Million) Forecast by Material , 2019 to 2034

Table 46: South Asia and Pacific Market Volume (Tons) Forecast by Material , 2019 to 2034

Table 47: South Asia and Pacific Market Value (US$ Million) Forecast by Manufacturing, 2019 to 2034

Table 48: South Asia and Pacific Market Volume (Tons) Forecast by Manufacturing, 2019 to 2034

Table 49: South Asia and Pacific Market Value (US$ Million) Forecast by End Use Industry, 2019 to 2034

Table 50: South Asia and Pacific Market Volume (Tons) Forecast by End Use Industry, 2019 to 2034

Table 51: Western Europe Market Value (US$ Million) Forecast by Country, 2019 to 2034

Table 52: Western Europe Market Volume (Tons) Forecast by Country, 2019 to 2034

Table 53: Western Europe Market Value (US$ Million) Forecast by Product Type, 2019 to 2034

Table 54: Western Europe Market Volume (Tons) Forecast by Product Type, 2019 to 2034

Table 55: Western Europe Market Value (US$ Million) Forecast by Material , 2019 to 2034

Table 56: Western Europe Market Volume (Tons) Forecast by Material , 2019 to 2034

Table 57: Western Europe Market Value (US$ Million) Forecast by Manufacturing, 2019 to 2034

Table 58: Western Europe Market Volume (Tons) Forecast by Manufacturing, 2019 to 2034

Table 59: Western Europe Market Value (US$ Million) Forecast by End Use Industry, 2019 to 2034

Table 60: Western Europe Market Volume (Tons) Forecast by End Use Industry, 2019 to 2034

Table 61: Eastern Europe Market Value (US$ Million) Forecast by Country, 2019 to 2034

Table 62: Eastern Europe Market Volume (Tons) Forecast by Country, 2019 to 2034

Table 63: Eastern Europe Market Value (US$ Million) Forecast by Product Type, 2019 to 2034

Table 64: Eastern Europe Market Volume (Tons) Forecast by Product Type, 2019 to 2034

Table 65: Eastern Europe Market Value (US$ Million) Forecast by Material , 2019 to 2034

Table 66: Eastern Europe Market Volume (Tons) Forecast by Material , 2019 to 2034

Table 67: Eastern Europe Market Value (US$ Million) Forecast by Manufacturing, 2019 to 2034

Table 68: Eastern Europe Market Volume (Tons) Forecast by Manufacturing, 2019 to 2034

Table 69: Eastern Europe Market Value (US$ Million) Forecast by End Use Industry, 2019 to 2034

Table 70: Eastern Europe Market Volume (Tons) Forecast by End Use Industry, 2019 to 2034

Table 71: Central Asia Market Value (US$ Million) Forecast by Country, 2019 to 2034

Table 72: Central Asia Market Volume (Tons) Forecast by Country, 2019 to 2034

Table 73: Central Asia Market Value (US$ Million) Forecast by Product Type, 2019 to 2034

Table 74: Central Asia Market Volume (Tons) Forecast by Product Type, 2019 to 2034

Table 75: Central Asia Market Value (US$ Million) Forecast by Material , 2019 to 2034

Table 76: Central Asia Market Volume (Tons) Forecast by Material , 2019 to 2034

Table 77: Central Asia Market Value (US$ Million) Forecast by Manufacturing, 2019 to 2034

Table 78: Central Asia Market Volume (Tons) Forecast by Manufacturing, 2019 to 2034

Table 79: Central Asia Market Value (US$ Million) Forecast by End Use Industry, 2019 to 2034

Table 80: Central Asia Market Volume (Tons) Forecast by End Use Industry, 2019 to 2034

Table 81: Russia & Belarus Market Value (US$ Million) Forecast by Country, 2019 to 2034

Table 82: Russia & Belarus Market Volume (Tons) Forecast by Country, 2019 to 2034

Table 83: Russia & Belarus Market Value (US$ Million) Forecast by Product Type, 2019 to 2034

Table 84: Russia & Belarus Market Volume (Tons) Forecast by Product Type, 2019 to 2034

Table 85: Russia & Belarus Market Value (US$ Million) Forecast by Material , 2019 to 2034

Table 86: Russia & Belarus Market Volume (Tons) Forecast by Material , 2019 to 2034

Table 87: Russia & Belarus Market Value (US$ Million) Forecast by Manufacturing, 2019 to 2034

Table 88: Russia & Belarus Market Volume (Tons) Forecast by Manufacturing, 2019 to 2034

Table 89: Russia & Belarus Market Value (US$ Million) Forecast by End Use Industry, 2019 to 2034

Table 90: Russia & Belarus Market Volume (Tons) Forecast by End Use Industry, 2019 to 2034

Table 91: Balkan Countries Market Value (US$ Million) Forecast by Country, 2019 to 2034

Table 92: Balkan Countries Market Volume (Tons) Forecast by Country, 2019 to 2034

Table 93: Balkan Countries Market Value (US$ Million) Forecast by Product Type, 2019 to 2034

Table 94: Balkan Countries Market Volume (Tons) Forecast by Product Type, 2019 to 2034

Table 95: Balkan Countries Market Value (US$ Million) Forecast by Material , 2019 to 2034

Table 96: Balkan Countries Market Volume (Tons) Forecast by Material , 2019 to 2034

Table 97: Balkan Countries Market Value (US$ Million) Forecast by Manufacturing, 2019 to 2034

Table 98: Balkan Countries Market Volume (Tons) Forecast by Manufacturing, 2019 to 2034

Table 99: Balkan Countries Market Value (US$ Million) Forecast by End Use Industry, 2019 to 2034

Table 100: Balkan Countries Market Volume (Tons) Forecast by End Use Industry, 2019 to 2034

Table 101: Baltic Countries Market Value (US$ Million) Forecast by Country, 2019 to 2034

Table 102: Baltic Countries Market Volume (Tons) Forecast by Country, 2019 to 2034

Table 103: Baltic Countries Market Value (US$ Million) Forecast by Product Type, 2019 to 2034

Table 104: Baltic Countries Market Volume (Tons) Forecast by Product Type, 2019 to 2034

Table 105: Baltic Countries Market Value (US$ Million) Forecast by Material , 2019 to 2034

Table 106: Baltic Countries Market Volume (Tons) Forecast by Material , 2019 to 2034

Table 107: Baltic Countries Market Value (US$ Million) Forecast by Manufacturing, 2019 to 2034

Table 108: Baltic Countries Market Volume (Tons) Forecast by Manufacturing, 2019 to 2034

Table 109: Baltic Countries Market Value (US$ Million) Forecast by End Use Industry, 2019 to 2034

Table 110: Baltic Countries Market Volume (Tons) Forecast by End Use Industry, 2019 to 2034

Table 111: Middle East and Africa (MEA) Market Value (US$ Million) Forecast by Country, 2019 to 2034

Table 112: Middle East and Africa (MEA) Market Volume (Tons) Forecast by Country, 2019 to 2034

Table 113: Middle East and Africa (MEA) Market Value (US$ Million) Forecast by Product Type, 2019 to 2034

Table 114: Middle East and Africa (MEA) Market Volume (Tons) Forecast by Product Type, 2019 to 2034

Table 115: Middle East and Africa (MEA) Market Value (US$ Million) Forecast by Material , 2019 to 2034

Table 116: Middle East and Africa (MEA) Market Volume (Tons) Forecast by Material , 2019 to 2034

Table 117: Middle East and Africa (MEA) Market Value (US$ Million) Forecast by Manufacturing, 2019 to 2034

Table 118: Middle East and Africa (MEA) Market Volume (Tons) Forecast by Manufacturing, 2019 to 2034

Table 119: Middle East and Africa (MEA) Market Value (US$ Million) Forecast by End Use Industry, 2019 to 2034

Table 120: Middle East and Africa (MEA) Market Volume (Tons) Forecast by End Use Industry, 2019 to 2034

List of Charts

Figure 1: Global Market Value (US$ Million) by Product Type, 2024 to 2034

Figure 2: Global Market Value (US$ Million) by Material , 2024 to 2034

Figure 3: Global Market Value (US$ Million) by Manufacturing, 2024 to 2034

Figure 4: Global Market Value (US$ Million) by End Use Industry, 2024 to 2034

Figure 5: Global Market Value (US$ Million) by Region, 2024 to 2034

Figure 6: Global Market Value (US$ Million) Analysis by Region, 2019 to 2034

Figure 7: Global Market Volume (Tons) Analysis by Region, 2019 to 2034

Figure 8: Global Market Value Share (%) and BPS Analysis by Region, 2024 to 2034

Figure 9: Global Market Y-o-Y Growth (%) Projections by Region, 2024 to 2034

Figure 10: Global Market Value (US$ Million) Analysis by Product Type, 2019 to 2034

Figure 11: Global Market Volume (Tons) Analysis by Product Type, 2019 to 2034

Figure 12: Global Market Value Share (%) and BPS Analysis by Product Type, 2024 to 2034

Figure 13: Global Market Y-o-Y Growth (%) Projections by Product Type, 2024 to 2034

Figure 14: Global Market Value (US$ Million) Analysis by Material , 2019 to 2034

Figure 15: Global Market Volume (Tons) Analysis by Material , 2019 to 2034

Figure 16: Global Market Value Share (%) and BPS Analysis by Material , 2024 to 2034

Figure 17: Global Market Y-o-Y Growth (%) Projections by Material , 2024 to 2034

Figure 18: Global Market Value (US$ Million) Analysis by Manufacturing, 2019 to 2034

Figure 19: Global Market Volume (Tons) Analysis by Manufacturing, 2019 to 2034

Figure 20: Global Market Value Share (%) and BPS Analysis by Manufacturing, 2024 to 2034

Figure 21: Global Market Y-o-Y Growth (%) Projections by Manufacturing, 2024 to 2034

Figure 22: Global Market Value (US$ Million) Analysis by End Use Industry, 2019 to 2034

Figure 23: Global Market Volume (Tons) Analysis by End Use Industry, 2019 to 2034

Figure 24: Global Market Value Share (%) and BPS Analysis by End Use Industry, 2024 to 2034

Figure 25: Global Market Y-o-Y Growth (%) Projections by End Use Industry, 2024 to 2034

Figure 26: Global Market Attractiveness by Product Type, 2024 to 2034

Figure 27: Global Market Attractiveness by Material , 2024 to 2034

Figure 28: Global Market Attractiveness by Manufacturing, 2024 to 2034

Figure 29: Global Market Attractiveness by End Use Industry, 2024 to 2034

Figure 30: Global Market Attractiveness by Region, 2024 to 2034

Figure 31: North America Market Value (US$ Million) by Product Type, 2024 to 2034

Figure 32: North America Market Value (US$ Million) by Material , 2024 to 2034

Figure 33: North America Market Value (US$ Million) by Manufacturing, 2024 to 2034

Figure 34: North America Market Value (US$ Million) by End Use Industry, 2024 to 2034

Figure 35: North America Market Value (US$ Million) by Country, 2024 to 2034

Figure 36: North America Market Value (US$ Million) Analysis by Country, 2019 to 2034

Figure 37: North America Market Volume (Tons) Analysis by Country, 2019 to 2034

Figure 38: North America Market Value Share (%) and BPS Analysis by Country, 2024 to 2034

Figure 39: North America Market Y-o-Y Growth (%) Projections by Country, 2024 to 2034

Figure 40: North America Market Value (US$ Million) Analysis by Product Type, 2019 to 2034

Figure 41: North America Market Volume (Tons) Analysis by Product Type, 2019 to 2034

Figure 42: North America Market Value Share (%) and BPS Analysis by Product Type, 2024 to 2034

Figure 43: North America Market Y-o-Y Growth (%) Projections by Product Type, 2024 to 2034

Figure 44: North America Market Value (US$ Million) Analysis by Material , 2019 to 2034

Figure 45: North America Market Volume (Tons) Analysis by Material , 2019 to 2034

Figure 46: North America Market Value Share (%) and BPS Analysis by Material , 2024 to 2034

Figure 47: North America Market Y-o-Y Growth (%) Projections by Material , 2024 to 2034

Figure 48: North America Market Value (US$ Million) Analysis by Manufacturing, 2019 to 2034

Figure 49: North America Market Volume (Tons) Analysis by Manufacturing, 2019 to 2034

Figure 50: North America Market Value Share (%) and BPS Analysis by Manufacturing, 2024 to 2034

Figure 51: North America Market Y-o-Y Growth (%) Projections by Manufacturing, 2024 to 2034

Figure 52: North America Market Value (US$ Million) Analysis by End Use Industry, 2019 to 2034

Figure 53: North America Market Volume (Tons) Analysis by End Use Industry, 2019 to 2034

Figure 54: North America Market Value Share (%) and BPS Analysis by End Use Industry, 2024 to 2034

Figure 55: North America Market Y-o-Y Growth (%) Projections by End Use Industry, 2024 to 2034

Figure 56: North America Market Attractiveness by Product Type, 2024 to 2034

Figure 57: North America Market Attractiveness by Material , 2024 to 2034

Figure 58: North America Market Attractiveness by Manufacturing, 2024 to 2034

Figure 59: North America Market Attractiveness by End Use Industry, 2024 to 2034

Figure 60: North America Market Attractiveness by Country, 2024 to 2034

Figure 61: Latin America Market Value (US$ Million) by Product Type, 2024 to 2034

Figure 62: Latin America Market Value (US$ Million) by Material , 2024 to 2034

Figure 63: Latin America Market Value (US$ Million) by Manufacturing, 2024 to 2034

Figure 64: Latin America Market Value (US$ Million) by End Use Industry, 2024 to 2034

Figure 65: Latin America Market Value (US$ Million) by Country, 2024 to 2034

Figure 66: Latin America Market Value (US$ Million) Analysis by Country, 2019 to 2034

Figure 67: Latin America Market Volume (Tons) Analysis by Country, 2019 to 2034

Figure 68: Latin America Market Value Share (%) and BPS Analysis by Country, 2024 to 2034

Figure 69: Latin America Market Y-o-Y Growth (%) Projections by Country, 2024 to 2034

Figure 70: Latin America Market Value (US$ Million) Analysis by Product Type, 2019 to 2034

Figure 71: Latin America Market Volume (Tons) Analysis by Product Type, 2019 to 2034

Figure 72: Latin America Market Value Share (%) and BPS Analysis by Product Type, 2024 to 2034

Figure 73: Latin America Market Y-o-Y Growth (%) Projections by Product Type, 2024 to 2034

Figure 74: Latin America Market Value (US$ Million) Analysis by Material , 2019 to 2034

Figure 75: Latin America Market Volume (Tons) Analysis by Material , 2019 to 2034

Figure 76: Latin America Market Value Share (%) and BPS Analysis by Material , 2024 to 2034

Figure 77: Latin America Market Y-o-Y Growth (%) Projections by Material , 2024 to 2034

Figure 78: Latin America Market Value (US$ Million) Analysis by Manufacturing, 2019 to 2034

Figure 79: Latin America Market Volume (Tons) Analysis by Manufacturing, 2019 to 2034

Figure 80: Latin America Market Value Share (%) and BPS Analysis by Manufacturing, 2024 to 2034

Figure 81: Latin America Market Y-o-Y Growth (%) Projections by Manufacturing, 2024 to 2034

Figure 82: Latin America Market Value (US$ Million) Analysis by End Use Industry, 2019 to 2034

Figure 83: Latin America Market Volume (Tons) Analysis by End Use Industry, 2019 to 2034

Figure 84: Latin America Market Value Share (%) and BPS Analysis by End Use Industry, 2024 to 2034

Figure 85: Latin America Market Y-o-Y Growth (%) Projections by End Use Industry, 2024 to 2034

Figure 86: Latin America Market Attractiveness by Product Type, 2024 to 2034

Figure 87: Latin America Market Attractiveness by Material , 2024 to 2034

Figure 88: Latin America Market Attractiveness by Manufacturing, 2024 to 2034

Figure 89: Latin America Market Attractiveness by End Use Industry, 2024 to 2034

Figure 90: Latin America Market Attractiveness by Country, 2024 to 2034

Figure 91: East Asia Market Value (US$ Million) by Product Type, 2024 to 2034

Figure 92: East Asia Market Value (US$ Million) by Material , 2024 to 2034

Figure 93: East Asia Market Value (US$ Million) by Manufacturing, 2024 to 2034

Figure 94: East Asia Market Value (US$ Million) by End Use Industry, 2024 to 2034

Figure 95: East Asia Market Value (US$ Million) by Country, 2024 to 2034

Figure 96: East Asia Market Value (US$ Million) Analysis by Country, 2019 to 2034

Figure 97: East Asia Market Volume (Tons) Analysis by Country, 2019 to 2034

Figure 98: East Asia Market Value Share (%) and BPS Analysis by Country, 2024 to 2034

Figure 99: East Asia Market Y-o-Y Growth (%) Projections by Country, 2024 to 2034

Figure 100: East Asia Market Value (US$ Million) Analysis by Product Type, 2019 to 2034

Figure 101: East Asia Market Volume (Tons) Analysis by Product Type, 2019 to 2034

Figure 102: East Asia Market Value Share (%) and BPS Analysis by Product Type, 2024 to 2034

Figure 103: East Asia Market Y-o-Y Growth (%) Projections by Product Type, 2024 to 2034

Figure 104: East Asia Market Value (US$ Million) Analysis by Material , 2019 to 2034

Figure 105: East Asia Market Volume (Tons) Analysis by Material , 2019 to 2034

Figure 106: East Asia Market Value Share (%) and BPS Analysis by Material , 2024 to 2034

Figure 107: East Asia Market Y-o-Y Growth (%) Projections by Material , 2024 to 2034

Figure 108: East Asia Market Value (US$ Million) Analysis by Manufacturing, 2019 to 2034

Figure 109: East Asia Market Volume (Tons) Analysis by Manufacturing, 2019 to 2034

Figure 110: East Asia Market Value Share (%) and BPS Analysis by Manufacturing, 2024 to 2034

Figure 111: East Asia Market Y-o-Y Growth (%) Projections by Manufacturing, 2024 to 2034

Figure 112: East Asia Market Value (US$ Million) Analysis by End Use Industry, 2019 to 2034

Figure 113: East Asia Market Volume (Tons) Analysis by End Use Industry, 2019 to 2034

Figure 114: East Asia Market Value Share (%) and BPS Analysis by End Use Industry, 2024 to 2034

Figure 115: East Asia Market Y-o-Y Growth (%) Projections by End Use Industry, 2024 to 2034

Figure 116: East Asia Market Attractiveness by Product Type, 2024 to 2034

Figure 117: East Asia Market Attractiveness by Material , 2024 to 2034

Figure 118: East Asia Market Attractiveness by Manufacturing, 2024 to 2034

Figure 119: East Asia Market Attractiveness by End Use Industry, 2024 to 2034

Figure 120: East Asia Market Attractiveness by Country, 2024 to 2034

Figure 121: South Asia and Pacific Market Value (US$ Million) by Product Type, 2024 to 2034

Figure 122: South Asia and Pacific Market Value (US$ Million) by Material , 2024 to 2034

Figure 123: South Asia and Pacific Market Value (US$ Million) by Manufacturing, 2024 to 2034

Figure 124: South Asia and Pacific Market Value (US$ Million) by End Use Industry, 2024 to 2034

Figure 125: South Asia and Pacific Market Value (US$ Million) by Country, 2024 to 2034

Figure 126: South Asia and Pacific Market Value (US$ Million) Analysis by Country, 2019 to 2034

Figure 127: South Asia and Pacific Market Volume (Tons) Analysis by Country, 2019 to 2034

Figure 128: South Asia and Pacific Market Value Share (%) and BPS Analysis by Country, 2024 to 2034

Figure 129: South Asia and Pacific Market Y-o-Y Growth (%) Projections by Country, 2024 to 2034

Figure 130: South Asia and Pacific Market Value (US$ Million) Analysis by Product Type, 2019 to 2034

Figure 131: South Asia and Pacific Market Volume (Tons) Analysis by Product Type, 2019 to 2034

Figure 132: South Asia and Pacific Market Value Share (%) and BPS Analysis by Product Type, 2024 to 2034

Figure 133: South Asia and Pacific Market Y-o-Y Growth (%) Projections by Product Type, 2024 to 2034

Figure 134: South Asia and Pacific Market Value (US$ Million) Analysis by Material , 2019 to 2034

Figure 135: South Asia and Pacific Market Volume (Tons) Analysis by Material , 2019 to 2034

Figure 136: South Asia and Pacific Market Value Share (%) and BPS Analysis by Material , 2024 to 2034

Figure 137: South Asia and Pacific Market Y-o-Y Growth (%) Projections by Material , 2024 to 2034

Figure 138: South Asia and Pacific Market Value (US$ Million) Analysis by Manufacturing, 2019 to 2034

Figure 139: South Asia and Pacific Market Volume (Tons) Analysis by Manufacturing, 2019 to 2034

Figure 140: South Asia and Pacific Market Value Share (%) and BPS Analysis by Manufacturing, 2024 to 2034

Figure 141: South Asia and Pacific Market Y-o-Y Growth (%) Projections by Manufacturing, 2024 to 2034

Figure 142: South Asia and Pacific Market Value (US$ Million) Analysis by End Use Industry, 2019 to 2034

Figure 143: South Asia and Pacific Market Volume (Tons) Analysis by End Use Industry, 2019 to 2034

Figure 144: South Asia and Pacific Market Value Share (%) and BPS Analysis by End Use Industry, 2024 to 2034

Figure 145: South Asia and Pacific Market Y-o-Y Growth (%) Projections by End Use Industry, 2024 to 2034

Figure 146: South Asia and Pacific Market Attractiveness by Product Type, 2024 to 2034

Figure 147: South Asia and Pacific Market Attractiveness by Material , 2024 to 2034

Figure 148: South Asia and Pacific Market Attractiveness by Manufacturing, 2024 to 2034

Figure 149: South Asia and Pacific Market Attractiveness by End Use Industry, 2024 to 2034

Figure 150: South Asia and Pacific Market Attractiveness by Country, 2024 to 2034

Figure 151: Western Europe Market Value (US$ Million) by Product Type, 2024 to 2034

Figure 152: Western Europe Market Value (US$ Million) by Material , 2024 to 2034

Figure 153: Western Europe Market Value (US$ Million) by Manufacturing, 2024 to 2034

Figure 154: Western Europe Market Value (US$ Million) by End Use Industry, 2024 to 2034

Figure 155: Western Europe Market Value (US$ Million) by Country, 2024 to 2034

Figure 156: Western Europe Market Value (US$ Million) Analysis by Country, 2019 to 2034

Figure 157: Western Europe Market Volume (Tons) Analysis by Country, 2019 to 2034

Figure 158: Western Europe Market Value Share (%) and BPS Analysis by Country, 2024 to 2034

Figure 159: Western Europe Market Y-o-Y Growth (%) Projections by Country, 2024 to 2034

Figure 160: Western Europe Market Value (US$ Million) Analysis by Product Type, 2019 to 2034

Figure 161: Western Europe Market Volume (Tons) Analysis by Product Type, 2019 to 2034

Figure 162: Western Europe Market Value Share (%) and BPS Analysis by Product Type, 2024 to 2034

Figure 163: Western Europe Market Y-o-Y Growth (%) Projections by Product Type, 2024 to 2034

Figure 164: Western Europe Market Value (US$ Million) Analysis by Material , 2019 to 2034

Figure 165: Western Europe Market Volume (Tons) Analysis by Material , 2019 to 2034

Figure 166: Western Europe Market Value Share (%) and BPS Analysis by Material , 2024 to 2034

Figure 167: Western Europe Market Y-o-Y Growth (%) Projections by Material , 2024 to 2034

Figure 168: Western Europe Market Value (US$ Million) Analysis by Manufacturing, 2019 to 2034

Figure 169: Western Europe Market Volume (Tons) Analysis by Manufacturing, 2019 to 2034

Figure 170: Western Europe Market Value Share (%) and BPS Analysis by Manufacturing, 2024 to 2034

Figure 171: Western Europe Market Y-o-Y Growth (%) Projections by Manufacturing, 2024 to 2034

Figure 172: Western Europe Market Value (US$ Million) Analysis by End Use Industry, 2019 to 2034

Figure 173: Western Europe Market Volume (Tons) Analysis by End Use Industry, 2019 to 2034

Figure 174: Western Europe Market Value Share (%) and BPS Analysis by End Use Industry, 2024 to 2034

Figure 175: Western Europe Market Y-o-Y Growth (%) Projections by End Use Industry, 2024 to 2034

Figure 176: Western Europe Market Attractiveness by Product Type, 2024 to 2034

Figure 177: Western Europe Market Attractiveness by Material , 2024 to 2034

Figure 178: Western Europe Market Attractiveness by Manufacturing, 2024 to 2034

Figure 179: Western Europe Market Attractiveness by End Use Industry, 2024 to 2034

Figure 180: Western Europe Market Attractiveness by Country, 2024 to 2034

Figure 181: Eastern Europe Market Value (US$ Million) by Product Type, 2024 to 2034

Figure 182: Eastern Europe Market Value (US$ Million) by Material , 2024 to 2034

Figure 183: Eastern Europe Market Value (US$ Million) by Manufacturing, 2024 to 2034

Figure 184: Eastern Europe Market Value (US$ Million) by End Use Industry, 2024 to 2034

Figure 185: Eastern Europe Market Value (US$ Million) by Country, 2024 to 2034

Figure 186: Eastern Europe Market Value (US$ Million) Analysis by Country, 2019 to 2034

Figure 187: Eastern Europe Market Volume (Tons) Analysis by Country, 2019 to 2034

Figure 188: Eastern Europe Market Value Share (%) and BPS Analysis by Country, 2024 to 2034

Figure 189: Eastern Europe Market Y-o-Y Growth (%) Projections by Country, 2024 to 2034

Figure 190: Eastern Europe Market Value (US$ Million) Analysis by Product Type, 2019 to 2034

Figure 191: Eastern Europe Market Volume (Tons) Analysis by Product Type, 2019 to 2034

Figure 192: Eastern Europe Market Value Share (%) and BPS Analysis by Product Type, 2024 to 2034

Figure 193: Eastern Europe Market Y-o-Y Growth (%) Projections by Product Type, 2024 to 2034

Figure 194: Eastern Europe Market Value (US$ Million) Analysis by Material , 2019 to 2034

Figure 195: Eastern Europe Market Volume (Tons) Analysis by Material , 2019 to 2034

Figure 196: Eastern Europe Market Value Share (%) and BPS Analysis by Material , 2024 to 2034

Figure 197: Eastern Europe Market Y-o-Y Growth (%) Projections by Material , 2024 to 2034

Figure 198: Eastern Europe Market Value (US$ Million) Analysis by Manufacturing, 2019 to 2034

Figure 199: Eastern Europe Market Volume (Tons) Analysis by Manufacturing, 2019 to 2034

Figure 200: Eastern Europe Market Value Share (%) and BPS Analysis by Manufacturing, 2024 to 2034

Figure 201: Eastern Europe Market Y-o-Y Growth (%) Projections by Manufacturing, 2024 to 2034

Figure 202: Eastern Europe Market Value (US$ Million) Analysis by End Use Industry, 2019 to 2034

Figure 203: Eastern Europe Market Volume (Tons) Analysis by End Use Industry, 2019 to 2034

Figure 204: Eastern Europe Market Value Share (%) and BPS Analysis by End Use Industry, 2024 to 2034

Figure 205: Eastern Europe Market Y-o-Y Growth (%) Projections by End Use Industry, 2024 to 2034

Figure 206: Eastern Europe Market Attractiveness by Product Type, 2024 to 2034

Figure 207: Eastern Europe Market Attractiveness by Material , 2024 to 2034

Figure 208: Eastern Europe Market Attractiveness by Manufacturing, 2024 to 2034

Figure 209: Eastern Europe Market Attractiveness by End Use Industry, 2024 to 2034

Figure 210: Eastern Europe Market Attractiveness by Country, 2024 to 2034

Figure 211: Central Asia Market Value (US$ Million) by Product Type, 2024 to 2034

Figure 212: Central Asia Market Value (US$ Million) by Material , 2024 to 2034

Figure 213: Central Asia Market Value (US$ Million) by Manufacturing, 2024 to 2034

Figure 214: Central Asia Market Value (US$ Million) by End Use Industry, 2024 to 2034

Figure 215: Central Asia Market Value (US$ Million) by Country, 2024 to 2034

Figure 216: Central Asia Market Value (US$ Million) Analysis by Country, 2019 to 2034

Figure 217: Central Asia Market Volume (Tons) Analysis by Country, 2019 to 2034

Figure 218: Central Asia Market Value Share (%) and BPS Analysis by Country, 2024 to 2034

Figure 219: Central Asia Market Y-o-Y Growth (%) Projections by Country, 2024 to 2034

Figure 220: Central Asia Market Value (US$ Million) Analysis by Product Type, 2019 to 2034

Figure 221: Central Asia Market Volume (Tons) Analysis by Product Type, 2019 to 2034

Figure 222: Central Asia Market Value Share (%) and BPS Analysis by Product Type, 2024 to 2034

Figure 223: Central Asia Market Y-o-Y Growth (%) Projections by Product Type, 2024 to 2034

Figure 224: Central Asia Market Value (US$ Million) Analysis by Material , 2019 to 2034

Figure 225: Central Asia Market Volume (Tons) Analysis by Material , 2019 to 2034

Figure 226: Central Asia Market Value Share (%) and BPS Analysis by Material , 2024 to 2034

Figure 227: Central Asia Market Y-o-Y Growth (%) Projections by Material , 2024 to 2034

Figure 228: Central Asia Market Value (US$ Million) Analysis by Manufacturing, 2019 to 2034

Figure 229: Central Asia Market Volume (Tons) Analysis by Manufacturing, 2019 to 2034

Figure 230: Central Asia Market Value Share (%) and BPS Analysis by Manufacturing, 2024 to 2034

Figure 231: Central Asia Market Y-o-Y Growth (%) Projections by Manufacturing, 2024 to 2034

Figure 232: Central Asia Market Value (US$ Million) Analysis by End Use Industry, 2019 to 2034

Figure 233: Central Asia Market Volume (Tons) Analysis by End Use Industry, 2019 to 2034

Figure 234: Central Asia Market Value Share (%) and BPS Analysis by End Use Industry, 2024 to 2034

Figure 235: Central Asia Market Y-o-Y Growth (%) Projections by End Use Industry, 2024 to 2034

Figure 236: Central Asia Market Attractiveness by Product Type, 2024 to 2034

Figure 237: Central Asia Market Attractiveness by Material , 2024 to 2034

Figure 238: Central Asia Market Attractiveness by Manufacturing, 2024 to 2034

Figure 239: Central Asia Market Attractiveness by End Use Industry, 2024 to 2034

Figure 240: Central Asia Market Attractiveness by Country, 2024 to 2034

Figure 241: Russia & Belarus Market Value (US$ Million) by Product Type, 2024 to 2034

Figure 242: Russia & Belarus Market Value (US$ Million) by Material , 2024 to 2034

Figure 243: Russia & Belarus Market Value (US$ Million) by Manufacturing, 2024 to 2034

Figure 244: Russia & Belarus Market Value (US$ Million) by End Use Industry, 2024 to 2034

Figure 245: Russia & Belarus Market Value (US$ Million) by Country, 2024 to 2034

Figure 246: Russia & Belarus Market Value (US$ Million) Analysis by Country, 2019 to 2034

Figure 247: Russia & Belarus Market Volume (Tons) Analysis by Country, 2019 to 2034

Figure 248: Russia & Belarus Market Value Share (%) and BPS Analysis by Country, 2024 to 2034

Figure 249: Russia & Belarus Market Y-o-Y Growth (%) Projections by Country, 2024 to 2034

Figure 250: Russia & Belarus Market Value (US$ Million) Analysis by Product Type, 2019 to 2034

Figure 251: Russia & Belarus Market Volume (Tons) Analysis by Product Type, 2019 to 2034

Figure 252: Russia & Belarus Market Value Share (%) and BPS Analysis by Product Type, 2024 to 2034

Figure 253: Russia & Belarus Market Y-o-Y Growth (%) Projections by Product Type, 2024 to 2034

Figure 254: Russia & Belarus Market Value (US$ Million) Analysis by Material , 2019 to 2034

Figure 255: Russia & Belarus Market Volume (Tons) Analysis by Material , 2019 to 2034

Figure 256: Russia & Belarus Market Value Share (%) and BPS Analysis by Material , 2024 to 2034

Figure 257: Russia & Belarus Market Y-o-Y Growth (%) Projections by Material , 2024 to 2034

Figure 258: Russia & Belarus Market Value (US$ Million) Analysis by Manufacturing, 2019 to 2034

Figure 259: Russia & Belarus Market Volume (Tons) Analysis by Manufacturing, 2019 to 2034

Figure 260: Russia & Belarus Market Value Share (%) and BPS Analysis by Manufacturing, 2024 to 2034

Figure 261: Russia & Belarus Market Y-o-Y Growth (%) Projections by Manufacturing, 2024 to 2034

Figure 262: Russia & Belarus Market Value (US$ Million) Analysis by End Use Industry, 2019 to 2034

Figure 263: Russia & Belarus Market Volume (Tons) Analysis by End Use Industry, 2019 to 2034

Figure 264: Russia & Belarus Market Value Share (%) and BPS Analysis by End Use Industry, 2024 to 2034

Figure 265: Russia & Belarus Market Y-o-Y Growth (%) Projections by End Use Industry, 2024 to 2034

Figure 266: Russia & Belarus Market Attractiveness by Product Type, 2024 to 2034

Figure 267: Russia & Belarus Market Attractiveness by Material , 2024 to 2034

Figure 268: Russia & Belarus Market Attractiveness by Manufacturing, 2024 to 2034

Figure 269: Russia & Belarus Market Attractiveness by End Use Industry, 2024 to 2034

Figure 270: Russia & Belarus Market Attractiveness by Country, 2024 to 2034

Figure 271: Balkan Countries Market Value (US$ Million) by Product Type, 2024 to 2034

Figure 272: Balkan Countries Market Value (US$ Million) by Material , 2024 to 2034

Figure 273: Balkan Countries Market Value (US$ Million) by Manufacturing, 2024 to 2034

Figure 274: Balkan Countries Market Value (US$ Million) by End Use Industry, 2024 to 2034

Figure 275: Balkan Countries Market Value (US$ Million) by Country, 2024 to 2034

Figure 276: Balkan Countries Market Value (US$ Million) Analysis by Country, 2019 to 2034

Figure 277: Balkan Countries Market Volume (Tons) Analysis by Country, 2019 to 2034

Figure 278: Balkan Countries Market Value Share (%) and BPS Analysis by Country, 2024 to 2034

Figure 279: Balkan Countries Market Y-o-Y Growth (%) Projections by Country, 2024 to 2034

Figure 280: Balkan Countries Market Value (US$ Million) Analysis by Product Type, 2019 to 2034

Figure 281: Balkan Countries Market Volume (Tons) Analysis by Product Type, 2019 to 2034

Figure 282: Balkan Countries Market Value Share (%) and BPS Analysis by Product Type, 2024 to 2034

Figure 283: Balkan Countries Market Y-o-Y Growth (%) Projections by Product Type, 2024 to 2034

Figure 284: Balkan Countries Market Value (US$ Million) Analysis by Material , 2019 to 2034

Figure 285: Balkan Countries Market Volume (Tons) Analysis by Material , 2019 to 2034

Figure 286: Balkan Countries Market Value Share (%) and BPS Analysis by Material , 2024 to 2034

Figure 287: Balkan Countries Market Y-o-Y Growth (%) Projections by Material , 2024 to 2034

Figure 288: Balkan Countries Market Value (US$ Million) Analysis by Manufacturing, 2019 to 2034

Figure 289: Balkan Countries Market Volume (Tons) Analysis by Manufacturing, 2019 to 2034

Figure 290: Balkan Countries Market Value Share (%) and BPS Analysis by Manufacturing, 2024 to 2034

Figure 291: Balkan Countries Market Y-o-Y Growth (%) Projections by Manufacturing, 2024 to 2034

Figure 292: Balkan Countries Market Value (US$ Million) Analysis by End Use Industry, 2019 to 2034

Figure 293: Balkan Countries Market Volume (Tons) Analysis by End Use Industry, 2019 to 2034

Figure 294: Balkan Countries Market Value Share (%) and BPS Analysis by End Use Industry, 2024 to 2034

Figure 295: Balkan Countries Market Y-o-Y Growth (%) Projections by End Use Industry, 2024 to 2034

Figure 296: Balkan Countries Market Attractiveness by Product Type, 2024 to 2034

Figure 297: Balkan Countries Market Attractiveness by Material , 2024 to 2034

Figure 298: Balkan Countries Market Attractiveness by Manufacturing, 2024 to 2034

Figure 299: Balkan Countries Market Attractiveness by End Use Industry, 2024 to 2034

Figure 300: Balkan Countries Market Attractiveness by Country, 2024 to 2034

Figure 301: Baltic Countries Market Value (US$ Million) by Product Type, 2024 to 2034

Figure 302: Baltic Countries Market Value (US$ Million) by Material , 2024 to 2034

Figure 303: Baltic Countries Market Value (US$ Million) by Manufacturing, 2024 to 2034

Figure 304: Baltic Countries Market Value (US$ Million) by End Use Industry, 2024 to 2034

Figure 305: Baltic Countries Market Value (US$ Million) by Country, 2024 to 2034

Figure 306: Baltic Countries Market Value (US$ Million) Analysis by Country, 2019 to 2034

Figure 307: Baltic Countries Market Volume (Tons) Analysis by Country, 2019 to 2034

Figure 308: Baltic Countries Market Value Share (%) and BPS Analysis by Country, 2024 to 2034

Figure 309: Baltic Countries Market Y-o-Y Growth (%) Projections by Country, 2024 to 2034

Figure 310: Baltic Countries Market Value (US$ Million) Analysis by Product Type, 2019 to 2034

Figure 311: Baltic Countries Market Volume (Tons) Analysis by Product Type, 2019 to 2034

Figure 312: Baltic Countries Market Value Share (%) and BPS Analysis by Product Type, 2024 to 2034

Figure 313: Baltic Countries Market Y-o-Y Growth (%) Projections by Product Type, 2024 to 2034

Figure 314: Baltic Countries Market Value (US$ Million) Analysis by Material , 2019 to 2034

Figure 315: Baltic Countries Market Volume (Tons) Analysis by Material , 2019 to 2034

Figure 316: Baltic Countries Market Value Share (%) and BPS Analysis by Material , 2024 to 2034

Figure 317: Baltic Countries Market Y-o-Y Growth (%) Projections by Material , 2024 to 2034

Figure 318: Baltic Countries Market Value (US$ Million) Analysis by Manufacturing, 2019 to 2034

Figure 319: Baltic Countries Market Volume (Tons) Analysis by Manufacturing, 2019 to 2034

Figure 320: Baltic Countries Market Value Share (%) and BPS Analysis by Manufacturing, 2024 to 2034

Figure 321: Baltic Countries Market Y-o-Y Growth (%) Projections by Manufacturing, 2024 to 2034

Figure 322: Baltic Countries Market Value (US$ Million) Analysis by End Use Industry, 2019 to 2034

Figure 323: Baltic Countries Market Volume (Tons) Analysis by End Use Industry, 2019 to 2034

Figure 324: Baltic Countries Market Value Share (%) and BPS Analysis by End Use Industry, 2024 to 2034

Figure 325: Baltic Countries Market Y-o-Y Growth (%) Projections by End Use Industry, 2024 to 2034

Figure 326: Baltic Countries Market Attractiveness by Product Type, 2024 to 2034

Figure 327: Baltic Countries Market Attractiveness by Material , 2024 to 2034

Figure 328: Baltic Countries Market Attractiveness by Manufacturing, 2024 to 2034

Figure 329: Baltic Countries Market Attractiveness by End Use Industry, 2024 to 2034

Figure 330: Baltic Countries Market Attractiveness by Country, 2024 to 2034

Figure 331: Middle East and Africa (MEA) Market Value (US$ Million) by Product Type, 2024 to 2034

Figure 332: Middle East and Africa (MEA) Market Value (US$ Million) by Material , 2024 to 2034

Figure 333: Middle East and Africa (MEA) Market Value (US$ Million) by Manufacturing, 2024 to 2034

Figure 334: Middle East and Africa (MEA) Market Value (US$ Million) by End Use Industry, 2024 to 2034

Figure 335: Middle East and Africa (MEA) Market Value (US$ Million) by Country, 2024 to 2034

Figure 336: Middle East and Africa (MEA) Market Value (US$ Million) Analysis by Country, 2019 to 2034

Figure 337: Middle East and Africa (MEA) Market Volume (Tons) Analysis by Country, 2019 to 2034

Figure 338: Middle East and Africa (MEA) Market Value Share (%) and BPS Analysis by Country, 2024 to 2034

Figure 339: Middle East and Africa (MEA) Market Y-o-Y Growth (%) Projections by Country, 2024 to 2034

Figure 340: Middle East and Africa (MEA) Market Value (US$ Million) Analysis by Product Type, 2019 to 2034

Figure 341: Middle East and Africa (MEA) Market Volume (Tons) Analysis by Product Type, 2019 to 2034

Figure 342: Middle East and Africa (MEA) Market Value Share (%) and BPS Analysis by Product Type, 2024 to 2034

Figure 343: Middle East and Africa (MEA) Market Y-o-Y Growth (%) Projections by Product Type, 2024 to 2034

Figure 344: Middle East and Africa (MEA) Market Value (US$ Million) Analysis by Material , 2019 to 2034

Figure 345: Middle East and Africa (MEA) Market Volume (Tons) Analysis by Material , 2019 to 2034

Figure 346: Middle East and Africa (MEA) Market Value Share (%) and BPS Analysis by Material , 2024 to 2034

Figure 347: Middle East and Africa (MEA) Market Y-o-Y Growth (%) Projections by Material , 2024 to 2034

Figure 348: Middle East and Africa (MEA) Market Value (US$ Million) Analysis by Manufacturing, 2019 to 2034

Figure 349: Middle East and Africa (MEA) Market Volume (Tons) Analysis by Manufacturing, 2019 to 2034

Figure 350: Middle East and Africa (MEA) Market Value Share (%) and BPS Analysis by Manufacturing, 2024 to 2034

Figure 351: Middle East and Africa (MEA) Market Y-o-Y Growth (%) Projections by Manufacturing, 2024 to 2034

Figure 352: Middle East and Africa (MEA) Market Value (US$ Million) Analysis by End Use Industry, 2019 to 2034

Figure 353: Middle East and Africa (MEA) Market Volume (Tons) Analysis by End Use Industry, 2019 to 2034

Figure 354: Middle East and Africa (MEA) Market Value Share (%) and BPS Analysis by End Use Industry, 2024 to 2034

Figure 355: Middle East and Africa (MEA) Market Y-o-Y Growth (%) Projections by End Use Industry, 2024 to 2034

Figure 356: Middle East and Africa (MEA) Market Attractiveness by Product Type, 2024 to 2034

Figure 357: Middle East and Africa (MEA) Market Attractiveness by Material , 2024 to 2034

Figure 358: Middle East and Africa (MEA) Market Attractiveness by Manufacturing, 2024 to 2034

Figure 359: Middle East and Africa (MEA) Market Attractiveness by End Use Industry, 2024 to 2034

Figure 360: Middle East and Africa (MEA) Market Attractiveness by Country, 2024 to 2034

Recommendations

Packaging

Sustainable Packaging Market

Published : February 2024

Packaging

Recyclable Packaging Market

Published : September 2022

Explore Packaging Insights

View Reports

Recycled Plastic Packaging Market