Recycled Fabric Bag Market Size, Share & Forecast Outlook 2025 to 2035

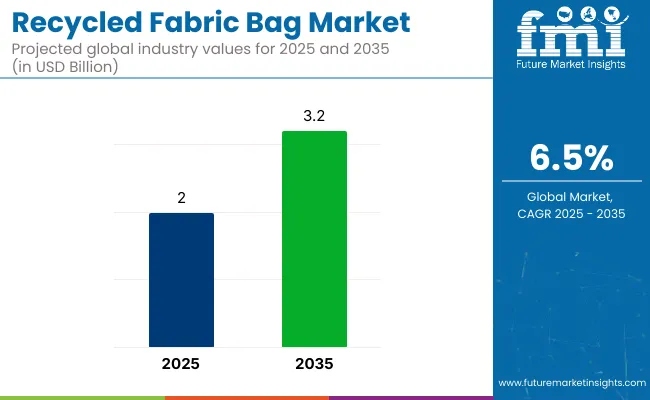
The global recycled fabric bag market is projected to grow from USD 2 billion in 2025 to USD 3.2 billion by 2035, registering a CAGR of 6.5% during the forecast period. This growth is being driven by the increasing demand for eco-friendly packaging solutions and rising consumer awareness about environmental responsibility.
Quick Stats for the Recycled Fabric Bag Market

  • Market Value (2025): USD 2 billion
  • Forecast Value (2035): USD 3.2 billion
  • Forecast CAGR: 6.5%
  • Leading Segment in 2025: Cotton (~63% share)
  • Key Growth Region: Asia (China), North America
  • Top Key Players: LeelineBags, Enviro-Tote, Bags Manufacturer, EcoPackables, Chicobag, Eco-Bags, BagsGoGreen, EcoSacks, Jinyabag, and Orient.

Recycled Fabric Bag Market

As businesses and consumers alike move away from single-use plastic bags, these bags are gaining significant popularity as a durable and eco-conscious alternative. The demand for reusable bags across various industries such as retail, fashion, and food and beverage is accelerating, with a growing focus on reducing environmental impact.

The demand for eco-friendly packaging solutions is expected to further fuel industry growth. Recycled fabric bags, made from post-consumer and post-industrial recycled materials, offer a reusable and biodegradable alternative to traditional plastic packaging. The growing adoption of customized solutions and automated packaging systems is also contributing to the industry's expansion. As more regulations are introduced to promote green packaging, the industry is anticipated to experience continued growth through 2035.

Several USA states and cities have implemented or are planning to implement bans on single-use plastic bags, encouraging the adoption of reusable alternatives. For instance, California's statewide ban on plastic bags is set to take effect in 2026. As a result, community groups, such as Anne-Marie Bonneau's sewing bee in California, are upcycling fabric waste to create reusable produce bags as per an article published in The Guardian. These grassroots efforts not only reduce textile waste but also promote plastic-free practices at the local level.

Analyzing Recycled Fabric Bag Market by Top Investment Segments

The market is expected to experience significant growth in 2025, with major investment areas such as cotton material, retail end-users, and supermarkets/hypermarkets as distribution channels driving this expansion.

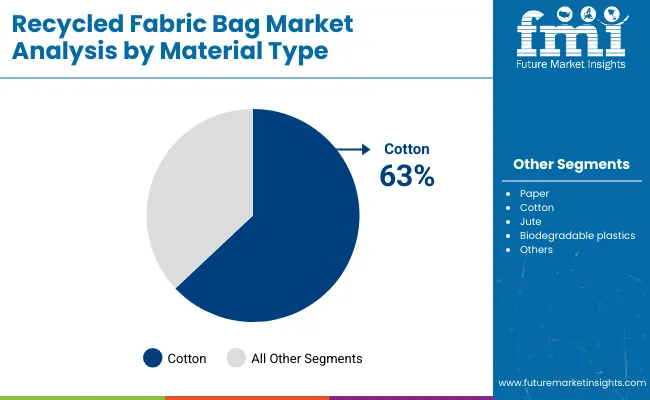
Cotton is projected to lead the industry with 63% share in 2025

Cotton is expected to dominate the industry in 2025, accounting for 63% of the industry share. This material is favored for its natural environmental benefits, biodegradability, and durability, making it an ideal alternative to plastic. As global environmental concerns grow, there is an increasing demand for eco-friendly materials, and cotton fabric bags offer a solution.
  • Leading brands such as Hanesbrands Inc. and Cotton Incorporated are investing in the production of recycled cotton bags, further boosting the industry.
  • Cotton’s versatility in design and comfort makes it a popular choice for consumers seeking durable and fashionable bags.

Recycled Fabric Bag Market Analysis By Material Type

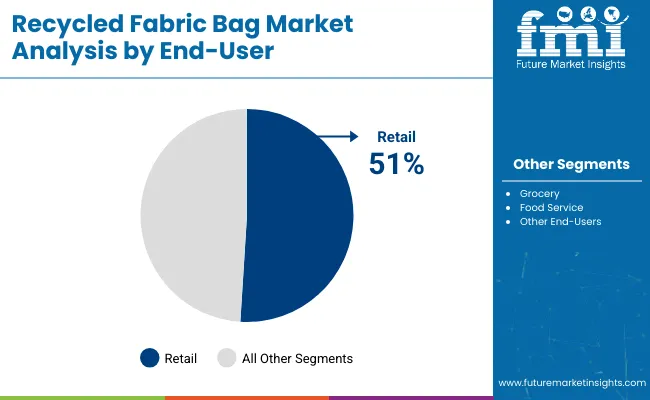
Retail is expected to capture 51% of market share by 2025

The retail sector is forecast to account for 51% of the industry share in 2025. Retailers are at the forefront of the shift toward eco-conscious packaging, increasingly adopting recycled fabric bags as part of their green strategies.
  • Companies such as Whole Foods Market and Target have integrated these bags into their product lines, encouraging customers to reduce plastic use. This change is driven by consumer demand for environmentally responsible alternatives and regulations aimed at reducing plastic waste.
  • The retail sector’s strong push for these bags is expected to continue fueling industry growth in the coming years.

Recycled Fabric Bag Market Analysis By End User

Supermarkets and hypermarkets are expected to capture 40% of the distribution share in 2025

Supermarkets and hypermarkets are projected to hold 40% of the industry share in the distribution channel segment of the industry by 2025. Large retailers such as Walmart and Tesco are driving this growth by promoting recycled fabric bags in stores, offering them as affordable and eco-conscious alternatives to plastic bags.

  • The high visibility and widespread consumer access provided by supermarkets and hypermarkets make these outlets key players in expanding the adoption of recycled fabric bags.
  • Through in-store campaigns and discounts, these retailers are educating customers about the environmental benefits of using reusable fabric bags, further accelerating their industry presence.

Top Recycled Fabric Bag Market Dynamics

The industry is growing due to rising consumer demand for eco-friendly products and environmentally responsible materials. However, high production costs and limited availability of recycled materials are challenging broader industry expansion.

Increasing consumer demand for eco-friendly products is driving growth

The growing awareness among consumers about environmental issues is significantly boosting the demand for eco-friendly products. These bags offer an alternative to traditional plastic bags, aligning with the increasing preference for products that contribute to environmental conservation.

As a result, manufacturers are focusing on producing fabric bags to meet consumer expectations and capitalize on the eco-conscious trend. This shift in consumer behavior is driving the growth of the recycled fabric bag industry, encouraging innovation and investment in environmentally friendly packaging solutions.

High production costs and limited availability of recycled materials are limiting industry growth

Despite the growing demand, the industry faces challenges related to high production costs and limited availability of recycled materials. The process of collecting, sorting, and processing recycled fabrics can be resource-intensive and costly, impacting the overall affordability of the bags.

Additionally, the supply of quality recycled materials may be inconsistent, affecting production efficiency and scalability. These factors can hinder the widespread adoption of recycled fabric bags, posing challenges for manufacturers aiming to meet industry demand while maintaining cost-effectiveness.

Analyzing Top Countries Manufacturing, Distributing, and Supplying Recycled Fabric Bag

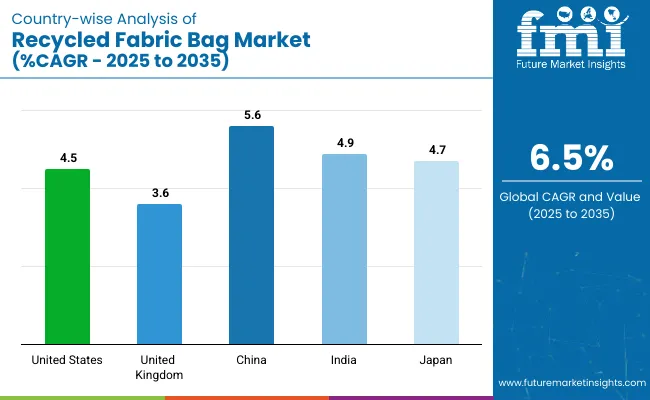
The industry is expected to grow steadily through 2035, driven by rising consumer demand for eco-friendly packaging, government regulations, and growing environmental awareness, with China and India leading expansion.
Country Wise Analysis Of Recycled Fabric Bag Market Cagr 2025 To 2035

Countries CAGR (2025 to 2035)
United States 4.5%
United Kingdom 3.6%
China 5.6%
India 4.9%
Japan 4.7%

An Overview of USA Recycled Fabric Bag Industry Growth

The industry in United States is expected to grow at a CAGR of 4.5% through 2035. Growth is supported by rising environmental awareness and consumer demand for eco-friendly packaging solutions.

  • Leading companies like Eco-Bags Products, Reusable Bags, and Baggu are innovating in fabric bags, catering to the growing demand for eco-conscious products.
  • Government regulations promoting reduced plastic use and encouraging environmentally responsible alternatives are further driving adoption. The rise of e-commerce, where packaging plays an important role, boosts industry expansion. Innovations in fabric durability and aesthetics support the continued demand for recycled fabric bags in the USA

UK Recycled Fabric Bag Market Analysis and Growth

The industry in United Kingdom is projected to grow at a CAGR of 3.6% through 2035. Growth is driven by an increasing preference for eco-conscious packaging solutions and growing consumer consciousness about the environmental impact of plastic waste.

  • Companies like Earthwise Bags, Cottonbag.co.uk, and Bag It Up are leading innovations in recycled fabric bag production. Regulations limiting single-use plastic bags are contributing to demand for alternatives.
  • The United Kingdom industry benefits from strong retail sector support, with many stores and supermarkets adopting recycled fabric bags. Further expansion is supported by eco-conscious consumer behavior and government-backed green initiatives.

China Recycled Fabric Bag Market Analysis and Growth

The industry is expected to grow at a CAGR of 5.6% through 2035. Expansion is driven by rapid urbanization, growing disposable incomes, and increasing consumer preference for eco-friendly products.

  • Leading companies such as Xiamen Bagai Textile Co. and EcoEnclose are investing in the development of recycled bags for packaging and retail use. Government policies promoting eco-friendly practices, reducing plastic usage, and supporting eco-conscious production are further accelerating the demand.
  • The shift toward eco-friendly packaging in e-commerce and retail sectors is boosting the growth. Continuous innovations in fabric materials and designs contribute to the rising popularity.

India Recycled Fabric Bag Market Analysis and Growth

The industry in India is expected to grow at a CAGR of 4.9% through 2035. Growth is driven by increasing urbanization, rising disposable income, and growing awareness about the environmental impact of plastic waste. Local companies like Jute India, Eco-Pak, and Super Green are expanding their portfolios.

  • Demand for eco-friendly and durable products is rising, particularly in the retail and e-commerce sectors.
  • Government policies supporting green initiatives and the reduction of plastic waste are promoting the adoption of eco-conscious alternatives. The industry benefits from innovations in fabric production and increasing consumer focus on eco-friendly living.

Japan Recycled Fabric Bag Market Analysis and Growth

The industry is projected to grow at a CAGR of 4.7% through 2035. Growth is supported by the country’s commitment to eco-friendly practices and environmental regulations. Leading companies like Mizuno, Lotte, and Sumitomo Chemical are developing innovative recycled bags for the packaging and retail industries.
  • Japan’s industry is driven by the demand for environmentally responsible and reusable packaging materials in response to growing environmental concerns.
  • The government’s push for reducing plastic waste and promoting eco-conscious alternatives is further supporting industry expansion. Advances in fabric quality and strength, along with increasing consumer awareness, contribute to steady growth.

Leading Suppliers of Recycled Fabric Bags

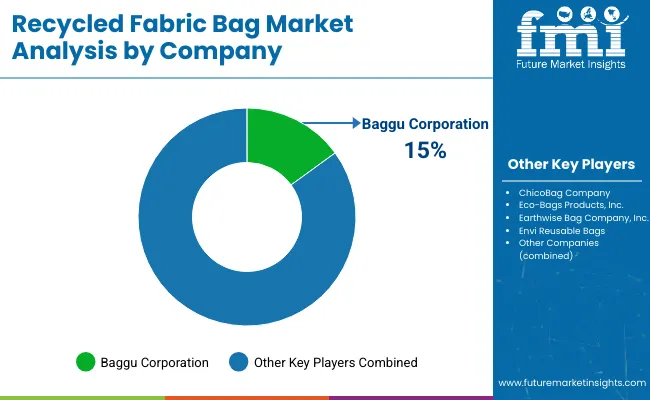
Recycled Fabric Bag Market Analysis By Company

The industry is characterized by both well-established key players and emerging companies, each employing distinct strategies to drive growth. Major players like LeelineBags, Enviro-Tote, and Eco-Bags leverage their extensive product portfolios and focus on R&D to maintain industry leadership.

For instance, EcoSacks introduced a new range of durable, recyclable bags, responding to the growing demand for sustainable alternatives. Smaller, emerging players like Jinyabag and BagsGoGreen are carving niches by offering customizable, eco-friendly options, tapping into consumer preferences for unique and sustainable products.

The industry faces entry barriers such as high production costs and limited access to quality recycled materials, which can hinder new players. It remains fragmented, with numerous small to medium-sized companies vying for market share. However, consolidation is gradually taking place as companies pursue strategic alliances and acquisitions to expand their reach and improve operational efficiencies. Innovation and overcoming supply chain challenges are key to remaining competitive.

Recent Recycled Fabric Bags Industry News

  • Between 2024 and 2025, significant advancements were made in the recycled fabric bag industry. In 2024, a new line of recycled nylon tote bags, featuring enhanced durability and functionality, was launched by VeeCollective.
  • In 2025, an innovative collection of recycled fabric bags, incorporating eco-conscious materials and modern designs, was introduced by Baggu. These developments have been seen as a reflection of the industry's ongoing commitment to enhancing product offerings. The growing demand for eco-friendly and durable fabric bags has been addressed through these innovations, further driving the industry's shift toward eco-friendly products.

Research Coverage and Scope Summary

Report Attributes Details
Current Total Industry Size (2025) USD 2 billion
Projected Market Size (2035) USD 3.2 billion
CAGR (2025 to 2035) 6.5%
Base Year for Estimation 2024
Historical Period 2020 to 2024
Projections Period 2025 to 2035
Quantitative Units USD billion for value
Material Types Analyzed Paper; Cotton; Jute; Biodegradable plastics; Other materials
End-User Segments Covered Retail; Grocery; Food service; Other end-users
Distribution Channels Covered Online stores; Supermarkets/hypermarkets; Specialty stores; Other channels
Regions Covered Asia Pacific; North America; Latin America; Europe; Middle East & Africa
Countries Covered United States; Canada; Mexico; Germany; United Kingdom; France; Italy; Spain; Netherlands; China; India; Japan; South Korea; Brazil; Argentina; Australia; South Africa; Saudi Arabia; UAE
Key Players Influencing the Industry LeelineBags, Enviro-Tote, Bags Manufacturer, EcoPackables, Chicobag, Eco-Bags, BagsGoGreen, EcoSacks, Jinyabag, and Orient.
Additional Attributes Dollar sales by material type (paper, cotton, jute, biodegradable plastics); Growth in online sales vs traditional retail; Regional demand for eco-friendly packaging solutions; Trends in biodegradable materials and eco-consciousness in fabric bags

Key Players in the Reusable Bag Industry

  • LeelineBags
  • Enviro-Tote
  • Bags Manufacturer
  • EcoPackables
  • Chicobag
  • Eco-Bags
  • BagsGoGreen
  • EcoSacks
  • Jinyabag
  • Orient

Recycled Fabric Bag Market Analyzed by Key Investment Segments

By Material Type:

The industry is segmented into paper, cotton, jute, biodegradable plastics, and others.

By End-User:

The industry includes retail, grocery, food service, and other end-users.

By Distribution Channel:

The industry is categorized by distribution channels into online stores, supermarkets/hypermarkets, specialty stores, and others.

By Region:

The industry spans across Asia Pacific, North America, Latin America, Europe, and the Middle East & Africa.

Table of Content

  1. Executive Summary
    • Global Market Outlook
    • Demand-side Trends
    • Supply-side Trends
    • Technology Roadmap Analysis
    • Analysis and Recommendations
  2. Market Overview
    • Market Coverage / Taxonomy
    • Market Definition / Scope / Limitations
  3. Market Background
    • Market Dynamics
      • Drivers
      • Restraints
      • Opportunity
      • Trends
    • Scenario Forecast
      • Demand in Optimistic Scenario
      • Demand in Likely Scenario
      • Demand in Conservative Scenario
    • Opportunity Map Analysis
    • Product Life Cycle Analysis
    • Supply Chain Analysis
      • Supply Side Participants and their Roles
        • Producers
        • Mid-Level Participants (Traders/ Agents/ Brokers)
        • Wholesalers and Distributors
      • Value Added and Value Created at Node in the Supply Chain
      • List of Raw Material Suppliers
      • List of Existing and Potential Buyer’s
    • Investment Feasibility Matrix
    • Value Chain Analysis
      • Profit Margin Analysis
      • Wholesalers and Distributors
      • Retailers
    • PESTLE and Porter’s Analysis
    • Regulatory Landscape
      • By Key Regions
      • By Key Countries
    • Regional Parent Market Outlook
    • Production and Consumption Statistics
    • Import and Export Statistics
  4. Global Analysis 2020 to 2024 and Forecast, 2025 to 2035
    • Historical Market Size Value (USD Billion) & Volume (Million Units) Analysis, 2020 to 2024
    • Current and Future Market Size Value (USD Billion) & Volume (Million Units) Projections, 2025 to 2035
      • Y-o-Y Growth Trend Analysis
      • Absolute $ Opportunity Analysis
  5. Global Pricing Analysis 2020 to 2024 and Forecast 2025 to 2035
  6. Global Analysis 2020 to 2024 and Forecast 2025 to 2035, By Material Type
    • Introduction / Key Findings
    • Historical Market Size Value (USD Billion) & Volume (Million Units) Analysis By Material Type, 2020 to 2024
    • Current and Future Market Size Value (USD Billion) & Volume (Million Units) Analysis and Forecast By Material Type, 2025 to 2035
      • Paper
      • Cotton
      • Jute
      • Biodegradable Plastics
      • Others
    • Y-o-Y Growth Trend Analysis By Material Type, 2020 to 2024
    • Absolute $ Opportunity Analysis By Material Type, 2025 to 2035
  7. Global Analysis 2020 to 2024 and Forecast 2025 to 2035, By End-User
    • Introduction / Key Findings
    • Historical Market Size Value (USD Billion) & Volume (Million Units) Analysis By End-User, 2020 to 2024
    • Current and Future Market Size Value (USD Billion) & Volume (Million Units) Analysis and Forecast By End-User, 2025 to 2035
      • Retail
      • Grocery
      • Food Service
      • Other End-Users
    • Y-o-Y Growth Trend Analysis By End-User, 2020 to 2024
    • Absolute $ Opportunity Analysis By End-User, 2025 to 2035
  8. Global Analysis 2020 to 2024 and Forecast 2025 to 2035, By Region
    • Introduction
    • Historical Market Size Value (USD Billion) & Volume (Million Units) Analysis By Region, 2020 to 2024
    • Current Market Size Value (USD Billion) & Volume (Million Units) Analysis and Forecast By Region, 2025 to 2035
      • North America
      • Latin America
      • Europe
      • East Asia
      • South Asia
      • Oceania
      • MEA
    • Market Attractiveness Analysis By Region
  9. North America Analysis 2020 to 2024 and Forecast 2025 to 2035, By Country
    • Historical Market Size Value (USD Billion) & Volume (Million Units) Trend Analysis By Market Taxonomy, 2020 to 2024
    • Market Size Value (USD Billion) & Volume (Million Units) Forecast By Market Taxonomy, 2025 to 2035
      • By Country
        • USA
        • Canada
      • By Material Type
      • By End-User
    • Market Attractiveness Analysis
      • By Country
      • By Material Type
      • By End-User
    • Key Takeaways
  10. Latin America Analysis 2020 to 2024 and Forecast 2025 to 2035, By Country
    • Historical Market Size Value (USD Billion) & Volume (Million Units) Trend Analysis By Market Taxonomy, 2020 to 2024
    • Market Size Value (USD Billion) & Volume (Million Units) Forecast By Market Taxonomy, 2025 to 2035
      • By Country
        • Brazil
        • Mexico
        • Argentina
        • Chile
        • Peru
        • Rest of Latin America
      • By Material Type
      • By End-User
    • Market Attractiveness Analysis
      • By Country
      • By Material Type
      • By End-User
    • Key Takeaways
  11. Europe Analysis 2020 to 2024 and Forecast 2025 to 2035, By Country
    • Historical Market Size Value (USD Billion) & Volume (Million Units) Trend Analysis By Market Taxonomy, 2020 to 2024
    • Market Size Value (USD Billion) & Volume (Million Units) Forecast By Market Taxonomy, 2025 to 2035
      • By Country
        • Germany
        • Italy
        • France
        • UK
        • Spain
        • Russia
        • BENELUX
        • Rest of Europe
      • By Material Type
      • By End-User
    • Market Attractiveness Analysis
      • By Country
      • By Material Type
      • By End-User
    • Key Takeaways
  12. East Asia Analysis 2020 to 2024 and Forecast 2025 to 2035, By Country
    • Historical Market Size Value (USD Billion) & Volume (Million Units) Trend Analysis By Market Taxonomy, 2020 to 2024
    • Market Size Value (USD Billion) & Volume (Million Units) Forecast By Market Taxonomy, 2025 to 2035
      • By Country
        • China
        • Japan
        • South Korea
      • By Material Type
      • By End-User
    • Market Attractiveness Analysis
      • By Country
      • By Material Type
      • By End-User
    • Key Takeaways
  13. South Asia Analysis 2020 to 2024 and Forecast 2025 to 2035, By Country
    • Historical Market Size Value (USD Billion) & Volume (Million Units) Trend Analysis By Market Taxonomy, 2020 to 2024
    • Market Size Value (USD Billion) & Volume (Million Units) Forecast By Market Taxonomy, 2025 to 2035
      • By Country
        • India
        • Thailand
        • Malaysia
        • Indonesia
        • Rest of South Asia
      • By Material Type
      • By End-User
    • Market Attractiveness Analysis
      • By Country
      • By Material Type
      • By End-User
    • Key Takeaways
  14. Oceania Analysis 2020 to 2024 and Forecast 2025 to 2035, By Country
    • Historical Market Size Value (USD Billion) & Volume (Million Units) Trend Analysis By Market Taxonomy, 2020 to 2024
    • Market Size Value (USD Billion) & Volume (Million Units) Forecast By Market Taxonomy, 2025 to 2035
      • By Country
        • Australia
        • New Zealand
      • By Material Type
      • By End-User
    • Market Attractiveness Analysis
      • By Country
      • By Material Type
      • By End-User
    • Key Takeaways
  15. MEA Analysis 2020 to 2024 and Forecast 2025 to 2035, By Country
    • Historical Market Size Value (USD Billion) & Volume (Million Units) Trend Analysis By Market Taxonomy, 2020 to 2024
    • Market Size Value (USD Billion) & Volume (Million Units) Forecast By Market Taxonomy, 2025 to 2035
      • By Country
        • GCC
        • Rest of MEA
      • By Material Type
      • By End-User
    • Market Attractiveness Analysis
      • By Country
      • By Material Type
      • By End-User
    • Key Takeaways
  16. Key Countries Analysis
    • USA
      • Pricing Analysis
      • Market Share Analysis, 2024
        • By Material Type
        • By End-User
    • Canada
      • Pricing Analysis
      • Market Share Analysis, 2024
        • By Material Type
        • By End-User
    • Brazil
      • Pricing Analysis
      • Market Share Analysis, 2024
        • By Material Type
        • By End-User
    • Mexico
      • Pricing Analysis
      • Market Share Analysis, 2024
        • By Material Type
        • By End-User
    • Argentina
      • Pricing Analysis
      • Market Share Analysis, 2024
        • By Material Type
        • By End-User
  17. Market Structure Analysis
    • Competition Dashboard
    • Competition Benchmarking
    • Market Share Analysis of Top Players
      • By Regional
      • By Material Type
      • By End-User
  18. Competition Analysis
    • Competition Deep Dive
      • Eco Bags Products, Inc.
        • Overview
        • Product Portfolio
        • Profitability by Market Segments (Product/Age /Sales Channel/Region)
        • Sales Footprint
        • Strategy Overview
          • Marketing Strategy
          • Product Strategy
          • Channel Strategy
      • Earthwise Bag Company, Inc.
        • Overview
        • Product Portfolio
        • Profitability by Market Segments (Product/Age /Sales Channel/Region)
        • Sales Footprint
        • Strategy Overview
          • Marketing Strategy
          • Product Strategy
          • Channel Strategy
      • Envi Reusable Bags
        • Overview
        • Product Portfolio
        • Profitability by Market Segments (Product/Age /Sales Channel/Region)
        • Sales Footprint
        • Strategy Overview
          • Marketing Strategy
          • Product Strategy
          • Channel Strategy
      • ChicoBag Company
        • Overview
        • Product Portfolio
        • Profitability by Market Segments (Product/Age /Sales Channel/Region)
        • Sales Footprint
        • Strategy Overview
          • Marketing Strategy
          • Product Strategy
          • Channel Strategy
      • Baggu Corporation
        • Overview
        • Product Portfolio
        • Profitability by Market Segments (Product/Age /Sales Channel/Region)
        • Sales Footprint
        • Strategy Overview
          • Marketing Strategy
          • Product Strategy
          • Channel Strategy
      • Simple Ecology
        • Overview
        • Product Portfolio
        • Profitability by Market Segments (Product/Age /Sales Channel/Region)
        • Sales Footprint
        • Strategy Overview
          • Marketing Strategy
          • Product Strategy
          • Channel Strategy
      • Reusable Bags USA
        • Overview
        • Product Portfolio
        • Profitability by Market Segments (Product/Age /Sales Channel/Region)
        • Sales Footprint
        • Strategy Overview
          • Marketing Strategy
          • Product Strategy
          • Channel Strategy
      • Tote Bag Factory
        • Overview
        • Product Portfolio
        • Profitability by Market Segments (Product/Age /Sales Channel/Region)
        • Sales Footprint
        • Strategy Overview
          • Marketing Strategy
          • Product Strategy
          • Channel Strategy
      • Custom Earth Promos
        • Overview
        • Product Portfolio
        • Profitability by Market Segments (Product/Age /Sales Channel/Region)
        • Sales Footprint
        • Strategy Overview
          • Marketing Strategy
          • Product Strategy
          • Channel Strategy
      • Vita Bags
        • Overview
        • Product Portfolio
        • Profitability by Market Segments (Product/Age /Sales Channel/Region)
        • Sales Footprint
        • Strategy Overview
          • Marketing Strategy
          • Product Strategy
          • Channel Strategy
      • Paper Bag Co.
        • Overview
        • Product Portfolio
        • Profitability by Market Segments (Product/Age /Sales Channel/Region)
        • Sales Footprint
        • Strategy Overview
          • Marketing Strategy
          • Product Strategy
          • Channel Strategy
      • Green Bag Company
        • Overview
        • Product Portfolio
        • Profitability by Market Segments (Product/Age /Sales Channel/Region)
        • Sales Footprint
        • Strategy Overview
          • Marketing Strategy
          • Product Strategy
          • Channel Strategy
      • The Carry Bag Company
        • Overview
        • Product Portfolio
        • Profitability by Market Segments (Product/Age /Sales Channel/Region)
        • Sales Footprint
        • Strategy Overview
          • Marketing Strategy
          • Product Strategy
          • Channel Strategy
      • ReBag
        • Overview
        • Product Portfolio
        • Profitability by Market Segments (Product/Age /Sales Channel/Region)
        • Sales Footprint
        • Strategy Overview
          • Marketing Strategy
          • Product Strategy
          • Channel Strategy
      • EcoRight
        • Overview
        • Product Portfolio
        • Profitability by Market Segments (Product/Age /Sales Channel/Region)
        • Sales Footprint
        • Strategy Overview
          • Marketing Strategy
          • Product Strategy
          • Channel Strategy
      • Onya Life
        • Overview
        • Product Portfolio
        • Profitability by Market Segments (Product/Age /Sales Channel/Region)
        • Sales Footprint
        • Strategy Overview
          • Marketing Strategy
          • Product Strategy
          • Channel Strategy
      • Enviro Tote, Inc.
        • Overview
        • Product Portfolio
        • Profitability by Market Segments (Product/Age /Sales Channel/Region)
        • Sales Footprint
        • Strategy Overview
          • Marketing Strategy
          • Product Strategy
          • Channel Strategy
      • Bag the Habit
        • Overview
        • Product Portfolio
        • Profitability by Market Segments (Product/Age /Sales Channel/Region)
        • Sales Footprint
        • Strategy Overview
          • Marketing Strategy
          • Product Strategy
          • Channel Strategy
      • Simply Green Solutions
        • Overview
        • Product Portfolio
        • Profitability by Market Segments (Product/Age /Sales Channel/Region)
        • Sales Footprint
        • Strategy Overview
          • Marketing Strategy
          • Product Strategy
          • Channel Strategy
      • The Clever Baggers Ltd.
        • Overview
        • Product Portfolio
        • Profitability by Market Segments (Product/Age /Sales Channel/Region)
        • Sales Footprint
        • Strategy Overview
          • Marketing Strategy
          • Product Strategy
          • Channel Strategy
  19. Assumptions & Acronyms Used
  20. Research Methodology

List of Tables

  • Table 1: Global Value (USD Billion) Forecast by Region, 2020 to 2035
  • Table 2: Global Volume (Million Units) Forecast by Region, 2020 to 2035
  • Table 3: Global Value (USD Billion) Forecast by Material Type, 2020 to 2035
  • Table 4: Global Volume (Million Units) Forecast by Material Type, 2020 to 2035
  • Table 5: Global Value (USD Billion) Forecast by End-User, 2020 to 2035
  • Table 6: Global Volume (Million Units) Forecast by End-User, 2020 to 2035
  • Table 7: North America Value (USD Billion) Forecast by Country, 2020 to 2035
  • Table 8: North America Volume (Million Units) Forecast by Country, 2020 to 2035
  • Table 9: North America Value (USD Billion) Forecast by Material Type, 2020 to 2035
  • Table 10: North America Volume (Million Units) Forecast by Material Type, 2020 to 2035
  • Table 11: North America Value (USD Billion) Forecast by End-User, 2020 to 2035
  • Table 12: North America Volume (Million Units) Forecast by End-User, 2020 to 2035
  • Table 13: Latin America Value (USD Billion) Forecast by Country, 2020 to 2035
  • Table 14: Latin America Volume (Million Units) Forecast by Country, 2020 to 2035
  • Table 15: Latin America Value (USD Billion) Forecast by Material Type, 2020 to 2035
  • Table 16: Latin America Volume (Million Units) Forecast by Material Type, 2020 to 2035
  • Table 17: Latin America Value (USD Billion) Forecast by End-User, 2020 to 2035
  • Table 18: Latin America Volume (Million Units) Forecast by End-User, 2020 to 2035
  • Table 19: Europe Value (USD Billion) Forecast by Country, 2020 to 2035
  • Table 20: Europe Volume (Million Units) Forecast by Country, 2020 to 2035
  • Table 21: Europe Value (USD Billion) Forecast by Material Type, 2020 to 2035
  • Table 22: Europe Volume (Million Units) Forecast by Material Type, 2020 to 2035
  • Table 23: Europe Value (USD Billion) Forecast by End-User, 2020 to 2035
  • Table 24: Europe Volume (Million Units) Forecast by End-User, 2020 to 2035
  • Table 25: East Asia Value (USD Billion) Forecast by Country, 2020 to 2035
  • Table 26: East Asia Volume (Million Units) Forecast by Country, 2020 to 2035
  • Table 27: East Asia Value (USD Billion) Forecast by Material Type, 2020 to 2035
  • Table 28: East Asia Volume (Million Units) Forecast by Material Type, 2020 to 2035
  • Table 29: East Asia Value (USD Billion) Forecast by End-User, 2020 to 2035
  • Table 30: East Asia Volume (Million Units) Forecast by End-User, 2020 to 2035
  • Table 31: South Asia Value (USD Billion) Forecast by Country, 2020 to 2035
  • Table 32: South Asia Volume (Million Units) Forecast by Country, 2020 to 2035
  • Table 33: South Asia Value (USD Billion) Forecast by Material Type, 2020 to 2035
  • Table 34: South Asia Volume (Million Units) Forecast by Material Type, 2020 to 2035
  • Table 35: South Asia Value (USD Billion) Forecast by End-User, 2020 to 2035
  • Table 36: South Asia Volume (Million Units) Forecast by End-User, 2020 to 2035
  • Table 37: Oceania Value (USD Billion) Forecast by Country, 2020 to 2035
  • Table 38: Oceania Volume (Million Units) Forecast by Country, 2020 to 2035
  • Table 39: Oceania Value (USD Billion) Forecast by Material Type, 2020 to 2035
  • Table 40: Oceania Volume (Million Units) Forecast by Material Type, 2020 to 2035
  • Table 41: Oceania Value (USD Billion) Forecast by End-User, 2020 to 2035
  • Table 42: Oceania Volume (Million Units) Forecast by End-User, 2020 to 2035
  • Table 43: MEA Value (USD Billion) Forecast by Country, 2020 to 2035
  • Table 44: MEA Volume (Million Units) Forecast by Country, 2020 to 2035
  • Table 45: MEA Value (USD Billion) Forecast by Material Type, 2020 to 2035
  • Table 46: MEA Volume (Million Units) Forecast by Material Type, 2020 to 2035
  • Table 47: MEA Value (USD Billion) Forecast by End-User, 2020 to 2035
  • Table 48: MEA Volume (Million Units) Forecast by End-User, 2020 to 2035

List of Figures

  • Figure 1: Global Volume (Million Units) Forecast 2020 to 2035
  • Figure 2: Global Pricing Analysis
  • Figure 3: Global Value (USD Billion) Forecast 2020 to 2035
  • Figure 4: Global Value Share and BPS Analysis by Material Type, 2025 and 2035
  • Figure 5: Global Y-o-Y Growth Comparison by Material Type, 2025 to 2035
  • Figure 6: Global Attractiveness Analysis by Material Type
  • Figure 7: Global Value Share and BPS Analysis by End-User, 2025 and 2035
  • Figure 8: Global Y-o-Y Growth Comparison by End-User, 2025 to 2035
  • Figure 9: Global Attractiveness Analysis by End-User
  • Figure 10: Global Value (USD Billion) Share and BPS Analysis by Region, 2025 and 2035
  • Figure 11: Global Y-o-Y Growth Comparison by Region, 2025 to 2035
  • Figure 12: Global Attractiveness Analysis by Region
  • Figure 13: North America Incremental $ Opportunity, 2025 to 2035
  • Figure 14: Latin America Incremental $ Opportunity, 2025 to 2035
  • Figure 15: Europe Incremental $ Opportunity, 2025 to 2035
  • Figure 16: East Asia Incremental $ Opportunity, 2025 to 2035
  • Figure 17: South Asia Incremental $ Opportunity, 2025 to 2035
  • Figure 18: Oceania Incremental $ Opportunity, 2025 to 2035
  • Figure 19: MEA Incremental $ Opportunity, 2025 to 2035
  • Figure 20: North America Value Share and BPS Analysis by Country, 2025 and 2035
  • Figure 21: North America Value Share and BPS Analysis by Material Type, 2025 and 2035
  • Figure 22: North America Y-o-Y Growth Comparison by Material Type, 2025 to 2035
  • Figure 23: North America Attractiveness Analysis by Material Type
  • Figure 24: North America Value Share and BPS Analysis by End-User, 2025 and 2035
  • Figure 25: North America Y-o-Y Growth Comparison by End-User, 2025 to 2035
  • Figure 26: North America Attractiveness Analysis by End-User
  • Figure 27: Latin America Value Share and BPS Analysis by Country, 2025 and 2035
  • Figure 28: Latin America Value Share and BPS Analysis by Material Type, 2025 and 2035
  • Figure 29: Latin America Y-o-Y Growth Comparison by Material Type, 2025 to 2035
  • Figure 30: Latin America Attractiveness Analysis by Material Type
  • Figure 31: Latin America Value Share and BPS Analysis by End-User, 2025 and 2035
  • Figure 32: Latin America Y-o-Y Growth Comparison by End-User, 2025 to 2035
  • Figure 33: Latin America Attractiveness Analysis by End-User
  • Figure 34: Europe Value Share and BPS Analysis by Country, 2025 and 2035
  • Figure 35: Europe Value Share and BPS Analysis by Material Type, 2025 and 2035
  • Figure 36: Europe Y-o-Y Growth Comparison by Material Type, 2025 to 2035
  • Figure 37: Europe Attractiveness Analysis by Material Type
  • Figure 38: Europe Value Share and BPS Analysis by End-User, 2025 and 2035
  • Figure 39: Europe Y-o-Y Growth Comparison by End-User, 2025 to 2035
  • Figure 40: Europe Attractiveness Analysis by End-User
  • Figure 41: East Asia Value Share and BPS Analysis by Country, 2025 and 2035
  • Figure 42: East Asia Value Share and BPS Analysis by Material Type, 2025 and 2035
  • Figure 43: East Asia Y-o-Y Growth Comparison by Material Type, 2025 to 2035
  • Figure 44: East Asia Attractiveness Analysis by Material Type
  • Figure 45: East Asia Value Share and BPS Analysis by End-User, 2025 and 2035
  • Figure 46: East Asia Y-o-Y Growth Comparison by End-User, 2025 to 2035
  • Figure 47: East Asia Attractiveness Analysis by End-User
  • Figure 48: South Asia Value Share and BPS Analysis by Country, 2025 and 2035
  • Figure 49: South Asia Value Share and BPS Analysis by Material Type, 2025 and 2035
  • Figure 50: South Asia Y-o-Y Growth Comparison by Material Type, 2025 to 2035
  • Figure 51: South Asia Attractiveness Analysis by Material Type
  • Figure 52: South Asia Value Share and BPS Analysis by End-User, 2025 and 2035
  • Figure 53: South Asia Y-o-Y Growth Comparison by End-User, 2025 to 2035
  • Figure 54: South Asia Attractiveness Analysis by End-User
  • Figure 55: Oceania Value Share and BPS Analysis by Country, 2025 and 2035
  • Figure 56: Oceania Value Share and BPS Analysis by Material Type, 2025 and 2035
  • Figure 57: Oceania Y-o-Y Growth Comparison by Material Type, 2025 to 2035
  • Figure 58: Oceania Attractiveness Analysis by Material Type
  • Figure 59: Oceania Value Share and BPS Analysis by End-User, 2025 and 2035
  • Figure 60: Oceania Y-o-Y Growth Comparison by End-User, 2025 to 2035
  • Figure 61: Oceania Attractiveness Analysis by End-User
  • Figure 62: MEA Value Share and BPS Analysis by Country, 2025 and 2035
  • Figure 63: MEA Value Share and BPS Analysis by Material Type, 2025 and 2035
  • Figure 64: MEA Y-o-Y Growth Comparison by Material Type, 2025 to 2035
  • Figure 65: MEA Attractiveness Analysis by Material Type
  • Figure 66: MEA Value Share and BPS Analysis by End-User, 2025 and 2035
  • Figure 67: MEA Y-o-Y Growth Comparison by End-User, 2025 to 2035
  • Figure 68: MEA Attractiveness Analysis by End-User
  • Figure 69: Global - Tier Structure Analysis
  • Figure 70: Global - Company Share Analysis

Frequently Asked Questions

What is the projected size of the recycled fabric bag market by 2035?

The recycled fabric bag industry is expected to reach USD 3.2 billion by 2035.

What is the estimated industry size of the recycled fabric bag market in 2025?

The market size is projected to be USD 2 billion in 2025.

What is the CAGR of the recycled fabric bag industry from 2025 to 2035?

The recycled fabric bag industry is expected to grow at a CAGR of 6.5% from 2025 to 2035.

Who are the key players in the recycled fabric bag industry?

Key players include LeelineBags, Enviro-Tote, Bags Manufacturer, EcoPackables, Chicobag, Eco-Bags, BagsGoGreen, EcoSacks, Jinyabag, and Orient.

What is driving the demand for recycled fabric bags?

The demand for recycled fabric bags is driven by the increasing preference for eco-friendly, responsible alternatives to single-use plastic bags, along with rising environmental awareness and regulatory bans on plastic.

Explore Sustainable Packaging Insights

Future Market Insights

Recycled Fabric Bag Market