Reports

- Global Locations -

Headquarters

Future Market Insights, Inc.

Christiana Corporate, 200
Continental Drive, Suite 401,
Newark, Delaware - 19713,
United States

T: +1-347-918-3531

Americas

Future Market Insights, Inc.

616 Corporate Way, Suite 2-9018,
Valley Cottage, NY 10989, United States

MEA

Future Market Insights

1602-6 Jumeirah Bay X2 Tower, Plot No: JLT-PH2-X2A,
Jumeirah Lakes Towers, Dubai,
United Arab Emirates

Europe

Future Market Insights

3rd Floor, 207 Regent Street,
W1B 3HH London
United Kingdom

T: + 44 (0) 20 8123 9659

Asia Pacific

Future Market Insights

IndiaLand Global Tech Park, Unit UG-1, Behind Grand HighStreet, Phase 1, Hinjawadi, MH, Pune – 411057, India

Consumer Foam Market Outlook for 2024 to 2034

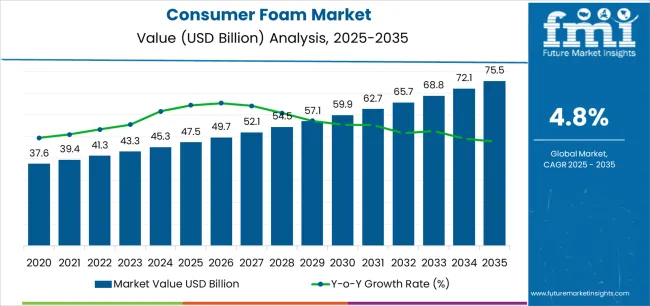
The consumer foam market is estimated to be worth US$ 45.2 billion in 2024. With an increased emphasis on health and hygiene, consumers actively seek products that offer antimicrobial features, especially in items like mattresses, pillows, and furniture.

The demand for consumer foam is likely to capture a CAGR of 5.0% through 2034 and is anticipated to surpass US$ 74 billion by 2034. Recognizing this demand, companies invest in research and development to integrate antimicrobial technologies into consumer foam products. This includes incorporating antimicrobial agents during the manufacturing process to ensure long-lasting protection against bacteria and allergens.

Adoption Analysis of the Consumer Foam

  • Antimicrobial consumer foam is becoming increasingly popular as consumers prioritize products that prevent allergies and infections in their living spaces.
  • Increased awareness regarding the benefits of antimicrobial materials is a significant driver. Consumers are becoming more educated about the potential health advantages of using products that inhibit the growth of harmful microorganisms.
  • Innovations in antimicrobial formulations and application methods are contributing to the popularity of these products.
Attributes Details
Consumer Foam Market Value for 2024 US$ 45.2 billion
Consumer Foam Market Size for 2034 US$ 74 billion
Market Forecast CAGR for 2024 to 2034 5.0%

Don't pay for what you don't need

Customize your report by selecting specific countries or regions and save 30%!

Historical Performance and Future Growth of the Consumer Foam Market

The historical CAGR for the sales of consumer foam stood at 6.0%, reflecting a steady and positive trajectory in the past. This growth can be attributed to various factors, including increasing consumer awareness of the benefits of foam-based products, innovations in manufacturing processes, and a growing demand for comfort-driven solutions in bedding and furniture.

Historical CAGR 6.0%
Forecast CAGR 5.0%

The sales of foam in consumer products are anticipated to rise at a CAGR of 5.0% through 2034, indicating a slight decrease compared to the historical performance.

  • The consumer foam market may be reaching a state of maturity where the initial surge in demand has subsided, resulting in a more moderate growth rate.
  • As the market expands, competition among manufacturers intensifies. The saturation of foam-based products could lead to more aggressive pricing strategies, impacting overall revenue growth.
  • Economic uncertainties or downturns can influence consumer spending habits, causing a slowdown in the purchase of non-essential items, including foam-based products.

Key Trends Influencing the Consumer Foam Market

  • Sustainability in Material Sourcing

A notable trend shaping consumer foam sales is the increasing emphasis on sustainability. Consumers are gravitating toward products made from eco-friendly materials, driving demand for foam that incorporates recycled or responsibly sourced components. Manufacturers aligning with sustainable sourcing practices experience heightened consumer trust and increased sales as eco-conscious consumers prioritize environmentally friendly options.

  • Wellness and Health-centric Foam Products

The consumer focus on health and wellness extends to bedding and furniture choices. Foam products designed to promote better sleep, alleviate pressure points, and support overall well-being are witnessing heightened demand. Manufacturers catering to health-conscious consumers experience increased sales as products aligning with wellness trends gain popularity in the market.

  • Online Retail and Direct-to-Consumer Models

The shift toward online shopping and direct-to-consumer models is influencing consumer foam sales. eCommerce platforms provide a convenient and accessible avenue for consumers to explore and purchase foam products. Companies adopting robust online strategies experience increased sales, tapping into the convenience and accessibility preferences of modern consumers.

  • Innovations in Cooling Technologies

With a growing focus on sleep quality, there is a rising demand for foam products incorporating advanced cooling technologies. Innovations such as gel-infused foam or phase-change materials cater to consumers seeking temperature-regulated sleep surfaces. Manufacturers incorporating cooling technologies in their foam products witness increased sales, especially in regions where temperature control during sleep is a significant consideration.

Sudip Saha
Sudip Saha

Principal Consultant

Talk to Analyst

Find your sweet spots for generating winning opportunities in this market.

Comparative View of the Adjacent Consumer Foam Market

This section provides a comparative view of the consumer foam industry, the flexible colored PU foam market, and the polyurethane foam market. The table compares these three interrelated industries from 2024 to 2034 by CAGR, opportunities, and key trends.

Consumer Foam Market:

Attributes Consumer Foam Market
CAGR (2024 to 2034) 5.0%
Opportunity Leveraging scent-infused foam technology to enhance sleep quality, offering aromatherapy benefits alongside comfort in consumer foam products.
Key Trends The rise of 'Green Bedrooms' where eco-friendly foam products are integrated into sustainable bedroom designs, aligns with the broader trend of environmentally conscious living.

Flexible Colored PU Foams Market:

Attributes Flexible Colored PU Foams Market
CAGR (2024 to 2034) 5%
Opportunity Developing customizable color-changing PU foams for dynamic interior designs, allowing consumers to modify the aesthetics of their furniture and bedding.
Key Trends The chameleon comfort trend is where flexible colored PU foams adapt to ambient light, creating an ever-changing color palette in response to the surroundings.

Polyurethane Foam Market:

Attributes Polyurethane Foam Market
CAGR (2024 to 2034) 6.3%
Opportunity Capitalizing on smart resilience, incorporating technology in polyurethane foams that adapt to individual sleep patterns, offering dynamic support for enhanced comfort and sleep quality.
Key Trends The ‘Zero-Waste Foam’ movement emphasizes the development of polyurethane foams with minimal environmental impact, addressing sustainability concerns in the market.

Category-wise Insights

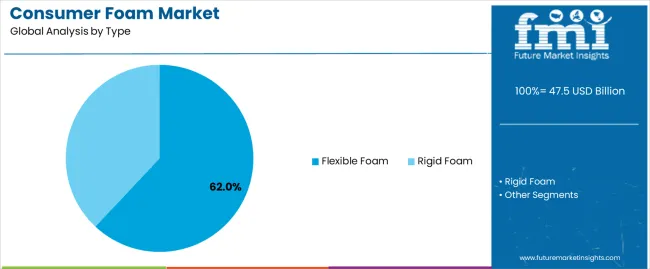
This section provides detailed insights into specific categories in the consumer foam industry. Rigid foam reigns supreme, boasting a projected CAGR of 4.6% between 2024 and 2034, following a steady 5.8% growth from 2019 to 2023.

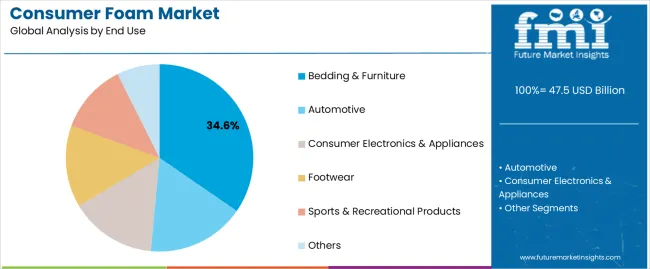
This dominance stems from its versatility and durability, making it ideal for diverse applications. Also, the future holds exciting developments, with bedding & furniture poised to become a leading end-use segment, driven by its anticipated CAGR of 4.5% between 2024 and 2034.

Rigid Foam Segment Projected to Maintain its Dominance in the Industry in 2024

Top Type Rigid Foam
CAGR % 2019 to 2023 5.8%
CAGR % 2024 to 2034 4.6%

The rigid foam segment asserts its dominance in 2024 with an expected CAGR of 4.6% through 2034.

  • Rigid foam's durability in diverse applications sustains its market dominance, appealing to industries requiring robust and long-lasting foam solutions.
  • The growth is propelled by the ongoing construction boom, where rigid foam finds extensive use in insulation and structural applications, ensuring a steady demand.
  • Continuous innovation in rigid foam materials enhances its versatility, attracting manufacturers and industries seeking advanced and tailored solutions.
  • Rigid foam's adaptability to eco-friendly practices aligns with the industry's sustainability push, contributing to its sustained dominance.

Bedding & Furniture to Become a Popular End-use Segment in the Market Through 2034

Top End Use Bedding & Furniture
CAGR % 2019 to 2023 5.6%
CAGR % 2024 to 2034 4.5%

The bedding & furniture segment emerges as a consumer favorite through 2034, with a projected CAGR of 4.5%.

  • Rising awareness of sleep wellness fuels demand for high-quality foam in bedding, with consumers prioritizing comfort and support for a good night's sleep.
  • Bedding & furniture adoption is boosted by the trend of customizable foam products, meeting individual preferences and elevating the overall consumer experience.
  • Foam's versatility in design and comfort positions it as a key component in modern home decor, influencing consumers to invest in stylish and comfortable furniture.
  • The convenience of online furniture shopping amplifies the demand for bedding & furniture foam, as consumers increasingly prefer customizable options delivered directly to their homes.

Get the data you need at a Fraction of the cost

Personalize your report by choosing insights you need
and save 40%!

Country-wise Insights

The section analyzes the consumer foam market across key countries, including the United States, United Kingdom, China, Japan, and South Korea. This segment discusses specific factors driving the demand, adoption, and sales of consumer foams in these countries.

Countries CAGR
United States 5.2%
United Kingdom 5.5%
China 6.0%
Japan 6.1%
South Korea 7.5%

Demand for Sustainable Foam is Enhancing the Market in the United States

The United States consumer foam market is poised for a moderate CAGR of 5.2% through 2034.

  • Increasing focus on sleep quality and wellness fuels demand for advanced consumer foams.
  • Growing preference for eco-friendly materials propels the market, emphasizing sustainability in foam products.
  • The convenience of online shopping amplifies consumer foam sales, with a surge in direct-to-consumer models.
  • Consumers seek personalized sleep solutions, spurring the market for customizable foam products.

Foam Texturing Technology is Shaping the Industry in the United Kingdom

The consumer foam market in the United Kingdom is projected to rise at a CAGR of 5.5% through 2034.

  • The consumer foam industry in the United Kingdom anticipates a rise at a CAGR of 5.5% through 2034, showcasing a steady ascent.
  • Integration with modern design trends positions foam products as stylish additions to United Kingdom homes.
  • Consumers prioritize health-centric bedding, boosting the market for sleep-enhancing foams.
  • Online retail gains prominence, providing accessibility and customization options for United Kingdom consumers.
  • The United Kingdom market favors sustainable foam solutions, aligning with the country's environmental consciousness.

Flexible Foam Packaging is Accelrtaing the Market in China

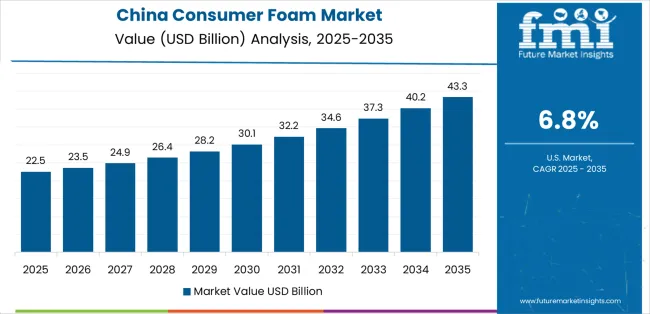
Surging demand for foam in the furniture industry is comforting the market of consumer foam in China. The industry is set to witness a stable CAGR of 6.0% through 2034.

  • Rapid urbanization fuels demand for consumer foams in China's growing cities, driving market expansion.
  • The expanding middle class seeks premium bedding, contributing to the surge in consumer foam sales.
  • China's strong eCommerce infrastructure enhances accessibility, facilitating widespread consumer foam adoption.

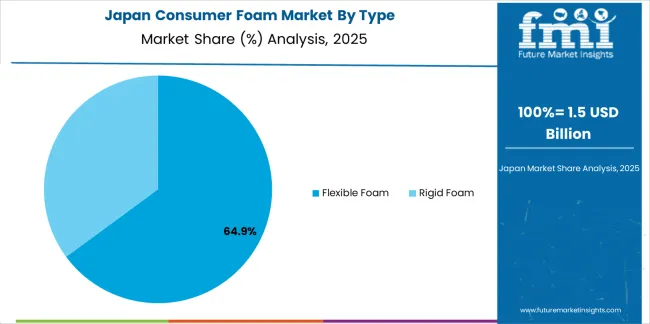
Foam Manufacturers are Eyeing on Advanced Material Science in Japan

The consumer foam market in Japan projects steady growth of 6.1% through 2034.

  • Japan’s consumers embrace comfort innovations, contributing to the demand for advanced consumer foams.
  • The elderly demographic fuels the demand for specialized foams, driving market growth in Japan.
  • Integration of foam products with traditional Japanese aesthetics appeals to consumer preferences.
  • Japan's tech-savvy population drives the adoption of smart foam solutions, contributing to market expansion.

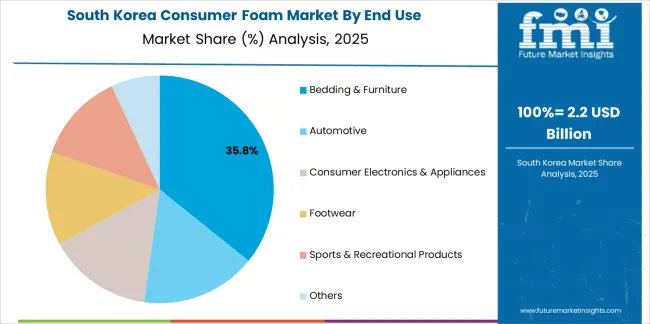
Demand for Recyclable and Environmentally Friendly Foam Driving the Market in South Korea

The sales of consumer foam products in South Korea exhibit robust growth with a projected CAGR of 7.5% through 2034.

  • South Korean consumers prioritize aesthetics and comfort, boosting the market for stylish and functional foam products.
  • Integration with smart home technologies aligns with South Korea's tech-driven lifestyle, contributing to market growth.
  • Growing awareness of sleep hygiene and wellness propels the demand for advanced consumer foams in South Korea.
  • Consumers seek personalized foam solutions, fostering the trend of customizable bedding and furniture.
  • Due to the rise in popularity of eCommerce platforms in South Korea, the majority of sales are driven through the online channel, which offers convenient and accessible consumer foam options at the doorstep.

Competition Outlook of the Consumer Foam Industry

Leading foam fabricating companies focus on continuous product innovation to meet the changing demands of consumers. This includes the development of advanced foam technologies, the integration of smart features, and the creation of customizable solutions to provide a diverse range of options for consumers.

To tap into new markets and leverage emerging opportunities, key players implement global expansion strategies. This involves establishing a strong presence in key regions, forming strategic partnerships, and adapting products to meet the specific needs of diverse consumer demographics.

Environmental consciousness is a significant factor influencing consumer choices. Key industry players actively pursue sustainability initiatives, incorporating eco-friendly materials and manufacturing processes. Companies align with consumer values by emphasizing recyclability, reduced carbon footprints, and the use of bio-based foams.

Companies invest in digital transformation to enhance their online presence as consumer behavior shifts toward online channels. eCommerce platforms play a crucial role in reaching a wider audience, providing convenient purchasing options, and showcasing a diverse range of consumer foam products.

Maintaining high-quality standards and compliance with regulations is paramount. Leading companies invest in robust quality assurance processes and adhere to international standards for consumer foam products. This commitment builds trust among consumers and enhances the credibility of the brand.

Recent Developments in the Consumer Foam Industry

  • Covestro AG, a leading producer of polyurethane foam, announced its plans to invest EUR 1.6 billion in a new world-scale MDI plant in Baytown, Texas.
  • BASF SE, a global leader in chemical solutions, launched a new range of high-performance foam products under the brand name Elastoflex E, which are based on renewable raw materials and offer improved sustainability and durability.
  • Dow Inc., a United States-based multinational chemical corporation, introduced a new polyolefin elastomer foam grade, INFUSE OBC 8707, which offers enhanced softness, flexibility, and compression set resistance for applications such as footwear, sports equipment, and medical devices.

Key Companies in the Market

  • Milliken & Company
  • BASF SE
  • Covestro AG
  • JSP Corporation
  • The Dow Chemical Company
  • Huntsman Corporation
  • Armacell International S.A.
  • Recticel S.A.
  • Woodbridge International Holdings, Inc.
  • Carpenter Company

Key Segments

By Type:

  • Rigid Foam
  • Flexible Foam

By End Use:

  • Bedding & Furniture
  • Automotive
  • Consumer Electronics & Appliances
  • Footwear
  • Sports & Recreational Products
  • Others

By Region:

  • North America
  • Latin America
  • Europe
  • East Asia
  • South Asia
  • Oceania
  • The Middle East and Africa

Frequently Asked Questions

What is the Market Potential for Consumer Foam?

The consumer foam market is projected to expand at a CAGR of 5.0% between 2024 and 2034.

Which Type Segment Dominates the Consumer Foam Market?

The rigid foam segment dominates the consumer foam industry.

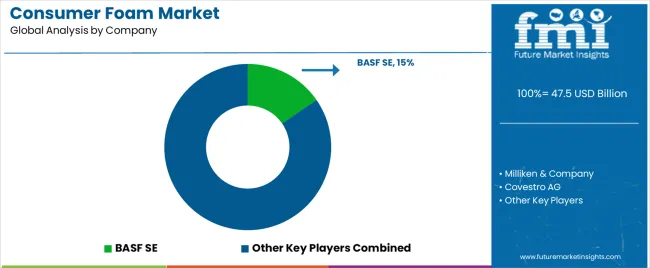
Who are the Top Three Consumer Foam Manufacturers?

The top 3 consumer foam manufacturers are Milliken & Company, BASF SE, and Covestro AG.

What is the Consumer Foam Market Growth Outlook for 2034?

The adoption of consumer foam is anticipated to surpass US$ 74 billion by 2034.

What is Driving the Demand for Consumer Foam?

Evolving preferences for comfort, customization, and sustainable, eco-friendly materials in bedding and furniture products drive the demand.

Which End-use Segment Offers Lucrative Prospects for the Players?

The bedding & furniture segment is anticipated to hold lucrative opportunities for consumer foam companies.

Table of Content

1. Executive Summary

    1.1. Global Market Outlook

    1.2. Demand-side Trends

    1.3. Supply-side Trends

    1.4. Technology Roadmap Analysis

    1.5. Analysis and Recommendations

2. Market Overview

    2.1. Market Coverage / Taxonomy

    2.2. Market Definition / Scope / Limitations

3. Market Background

    3.1. Market Dynamics

        3.1.1. Drivers

        3.1.2. Restraints

        3.1.3. Opportunity

        3.1.4. Trends

    3.2. Scenario Forecast

        3.2.1. Demand in Optimistic Scenario

        3.2.2. Demand in Likely Scenario

        3.2.3. Demand in Conservative Scenario

    3.3. Opportunity Map Analysis

    3.4. Product Life Cycle Analysis

    3.5. Supply Chain Analysis

        3.5.1. Supply Side Participants and their Roles

            3.5.1.1. Producers

            3.5.1.2. Mid-Level Participants (Traders/ Agents/ Brokers)

            3.5.1.3. Wholesalers and Distributors

        3.5.2. Value Added and Value Created at Node in the Supply Chain

        3.5.3. List of Raw Material Suppliers

        3.5.4. List of Existing and Potential Buyer’s

    3.6. Investment Feasibility Matrix

    3.7. Value Chain Analysis

        3.7.1. Profit Margin Analysis

        3.7.2. Wholesalers and Distributors

        3.7.3. Retailers

    3.8. PESTLE and Porter’s Analysis

    3.9. Regulatory Landscape

        3.9.1. By Key Regions

        3.9.2. By Key Countries

    3.10. Regional Parent Market Outlook

    3.11. Production and Consumption Statistics

    3.12. Import and Export Statistics

4. Global Market Analysis 2019 to 2023 and Forecast, 2024 to 2034

    4.1. Historical Market Size Value (US$ Million) & Volume (Square Feet) Analysis, 2019 to 2023

    4.2. Current and Future Market Size Value (US$ Million) & Volume (Square Feet) Projections, 2024 to 2034

        4.2.1. Y-o-Y Growth Trend Analysis

        4.2.2. Absolute $ Opportunity Analysis

5. Global Market Analysis 2019 to 2023 and Forecast 2024 to 2034, By Type

    5.1. Introduction / Key Findings

    5.2. Historical Market Size Value (US$ Million) & Volume (Square Feet) Analysis By Type, 2019 to 2023

    5.3. Current and Future Market Size Value (US$ Million) & Volume (Square Feet) Analysis and Forecast By Type, 2024 to 2034

        5.3.1. Rigid Foam

        5.3.2. Flexible Foam

    5.4. Y-o-Y Growth Trend Analysis By Type, 2019 to 2023

    5.5. Absolute $ Opportunity Analysis By Type, 2024 to 2034

6. Global Market Analysis 2019 to 2023 and Forecast 2024 to 2034, By End-Use

    6.1. Introduction / Key Findings

    6.2. Historical Market Size Value (US$ Million) & Volume (Square Feet) Analysis By End-Use, 2019 to 2023

    6.3. Current and Future Market Size Value (US$ Million) & Volume (Square Feet) Analysis and Forecast By End-Use, 2024 to 2034

        6.3.1. Bedding & Furniture

        6.3.2. Automotive

        6.3.3. Consumer Electronics & Appliances

        6.3.4. Footwear

        6.3.5. Sports & Recreational Products

        6.3.6. Others

    6.4. Y-o-Y Growth Trend Analysis By End-Use, 2019 to 2023

    6.5. Absolute $ Opportunity Analysis By End-Use, 2024 to 2034

7. Global Market Analysis 2019 to 2023 and Forecast 2024 to 2034, By Region

    7.1. Introduction

    7.2. Historical Market Size Value (US$ Million) & Volume (Square Feet) Analysis By Region, 2019 to 2023

    7.3. Current Market Size Value (US$ Million) & Volume (Square Feet) Analysis and Forecast By Region, 2024 to 2034

        7.3.1. North America

        7.3.2. Latin America

        7.3.3. Western Europe

        7.3.4. Eastern Europe

        7.3.5. South Asia and Pacific

        7.3.6. East Asia

        7.3.7. Middle East and Africa

    7.4. Market Attractiveness Analysis By Region

8. North America Market Analysis 2019 to 2023 and Forecast 2024 to 2034, By Country

    8.1. Historical Market Size Value (US$ Million) & Volume (Square Feet) Trend Analysis By Market Taxonomy, 2019 to 2023

    8.2. Market Size Value (US$ Million) & Volume (Square Feet) Forecast By Market Taxonomy, 2024 to 2034

        8.2.1. By Country

            8.2.1.1. USA

            8.2.1.2. Canada

        8.2.2. By Type

        8.2.3. By End-Use

    8.3. Market Attractiveness Analysis

        8.3.1. By Country

        8.3.2. By Type

        8.3.3. By End-Use

    8.4. Key Takeaways

9. Latin America Market Analysis 2019 to 2023 and Forecast 2024 to 2034, By Country

    9.1. Historical Market Size Value (US$ Million) & Volume (Square Feet) Trend Analysis By Market Taxonomy, 2019 to 2023

    9.2. Market Size Value (US$ Million) & Volume (Square Feet) Forecast By Market Taxonomy, 2024 to 2034

        9.2.1. By Country

            9.2.1.1. Brazil

            9.2.1.2. Mexico

            9.2.1.3. Rest of Latin America

        9.2.2. By Type

        9.2.3. By End-Use

    9.3. Market Attractiveness Analysis

        9.3.1. By Country

        9.3.2. By Type

        9.3.3. By End-Use

    9.4. Key Takeaways

10. Western Europe Market Analysis 2019 to 2023 and Forecast 2024 to 2034, By Country

    10.1. Historical Market Size Value (US$ Million) & Volume (Square Feet) Trend Analysis By Market Taxonomy, 2019 to 2023

    10.2. Market Size Value (US$ Million) & Volume (Square Feet) Forecast By Market Taxonomy, 2024 to 2034

        10.2.1. By Country

            10.2.1.1. Germany

            10.2.1.2. UK

            10.2.1.3. France

            10.2.1.4. Spain

            10.2.1.5. Italy

            10.2.1.6. Rest of Western Europe

        10.2.2. By Type

        10.2.3. By End-Use

    10.3. Market Attractiveness Analysis

        10.3.1. By Country

        10.3.2. By Type

        10.3.3. By End-Use

    10.4. Key Takeaways

11. Eastern Europe Market Analysis 2019 to 2023 and Forecast 2024 to 2034, By Country

    11.1. Historical Market Size Value (US$ Million) & Volume (Square Feet) Trend Analysis By Market Taxonomy, 2019 to 2023

    11.2. Market Size Value (US$ Million) & Volume (Square Feet) Forecast By Market Taxonomy, 2024 to 2034

        11.2.1. By Country

            11.2.1.1. Poland

            11.2.1.2. Russia

            11.2.1.3. Czech Republic

            11.2.1.4. Romania

            11.2.1.5. Rest of Eastern Europe

        11.2.2. By Type

        11.2.3. By End-Use

    11.3. Market Attractiveness Analysis

        11.3.1. By Country

        11.3.2. By Type

        11.3.3. By End-Use

    11.4. Key Takeaways

12. South Asia and Pacific Market Analysis 2019 to 2023 and Forecast 2024 to 2034, By Country

    12.1. Historical Market Size Value (US$ Million) & Volume (Square Feet) Trend Analysis By Market Taxonomy, 2019 to 2023

    12.2. Market Size Value (US$ Million) & Volume (Square Feet) Forecast By Market Taxonomy, 2024 to 2034

        12.2.1. By Country

            12.2.1.1. India

            12.2.1.2. Bangladesh

            12.2.1.3. Australia

            12.2.1.4. New Zealand

            12.2.1.5. Rest of South Asia and Pacific

        12.2.2. By Type

        12.2.3. By End-Use

    12.3. Market Attractiveness Analysis

        12.3.1. By Country

        12.3.2. By Type

        12.3.3. By End-Use

    12.4. Key Takeaways

13. East Asia Market Analysis 2019 to 2023 and Forecast 2024 to 2034, By Country

    13.1. Historical Market Size Value (US$ Million) & Volume (Square Feet) Trend Analysis By Market Taxonomy, 2019 to 2023

    13.2. Market Size Value (US$ Million) & Volume (Square Feet) Forecast By Market Taxonomy, 2024 to 2034

        13.2.1. By Country

            13.2.1.1. China

            13.2.1.2. Japan

            13.2.1.3. South Korea

        13.2.2. By Type

        13.2.3. By End-Use

    13.3. Market Attractiveness Analysis

        13.3.1. By Country

        13.3.2. By Type

        13.3.3. By End-Use

    13.4. Key Takeaways

14. Middle East and Africa Market Analysis 2019 to 2023 and Forecast 2024 to 2034, By Country

    14.1. Historical Market Size Value (US$ Million) & Volume (Square Feet) Trend Analysis By Market Taxonomy, 2019 to 2023

    14.2. Market Size Value (US$ Million) & Volume (Square Feet) Forecast By Market Taxonomy, 2024 to 2034

        14.2.1. By Country

            14.2.1.1. GCC Countries

            14.2.1.2. South Africa

            14.2.1.3. Israel

            14.2.1.4. Rest of MEA

        14.2.2. By Type

        14.2.3. By End-Use

    14.3. Market Attractiveness Analysis

        14.3.1. By Country

        14.3.2. By Type

        14.3.3. By End-Use

    14.4. Key Takeaways

15. Key Countries Market Analysis

    15.1. USA

        15.1.1. Pricing Analysis

        15.1.2. Market Share Analysis, 2023

            15.1.2.1. By Type

            15.1.2.2. By End-Use

    15.2. Canada

        15.2.1. Pricing Analysis

        15.2.2. Market Share Analysis, 2023

            15.2.2.1. By Type

            15.2.2.2. By End-Use

    15.3. Brazil

        15.3.1. Pricing Analysis

        15.3.2. Market Share Analysis, 2023

            15.3.2.1. By Type

            15.3.2.2. By End-Use

    15.4. Mexico

        15.4.1. Pricing Analysis

        15.4.2. Market Share Analysis, 2023

            15.4.2.1. By Type

            15.4.2.2. By End-Use

    15.5. Germany

        15.5.1. Pricing Analysis

        15.5.2. Market Share Analysis, 2023

            15.5.2.1. By Type

            15.5.2.2. By End-Use

    15.6. UK

        15.6.1. Pricing Analysis

        15.6.2. Market Share Analysis, 2023

            15.6.2.1. By Type

            15.6.2.2. By End-Use

    15.7. France

        15.7.1. Pricing Analysis

        15.7.2. Market Share Analysis, 2023

            15.7.2.1. By Type

            15.7.2.2. By End-Use

    15.8. Spain

        15.8.1. Pricing Analysis

        15.8.2. Market Share Analysis, 2023

            15.8.2.1. By Type

            15.8.2.2. By End-Use

    15.9. Italy

        15.9.1. Pricing Analysis

        15.9.2. Market Share Analysis, 2023

            15.9.2.1. By Type

            15.9.2.2. By End-Use

    15.10. Poland

        15.10.1. Pricing Analysis

        15.10.2. Market Share Analysis, 2023

            15.10.2.1. By Type

            15.10.2.2. By End-Use

    15.11. Russia

        15.11.1. Pricing Analysis

        15.11.2. Market Share Analysis, 2023

            15.11.2.1. By Type

            15.11.2.2. By End-Use

    15.12. Czech Republic

        15.12.1. Pricing Analysis

        15.12.2. Market Share Analysis, 2023

            15.12.2.1. By Type

            15.12.2.2. By End-Use

    15.13. Romania

        15.13.1. Pricing Analysis

        15.13.2. Market Share Analysis, 2023

            15.13.2.1. By Type

            15.13.2.2. By End-Use

    15.14. India

        15.14.1. Pricing Analysis

        15.14.2. Market Share Analysis, 2023

            15.14.2.1. By Type

            15.14.2.2. By End-Use

    15.15. Bangladesh

        15.15.1. Pricing Analysis

        15.15.2. Market Share Analysis, 2023

            15.15.2.1. By Type

            15.15.2.2. By End-Use

    15.16. Australia

        15.16.1. Pricing Analysis

        15.16.2. Market Share Analysis, 2023

            15.16.2.1. By Type

            15.16.2.2. By End-Use

    15.17. New Zealand

        15.17.1. Pricing Analysis

        15.17.2. Market Share Analysis, 2023

            15.17.2.1. By Type

            15.17.2.2. By End-Use

    15.18. China

        15.18.1. Pricing Analysis

        15.18.2. Market Share Analysis, 2023

            15.18.2.1. By Type

            15.18.2.2. By End-Use

    15.19. Japan

        15.19.1. Pricing Analysis

        15.19.2. Market Share Analysis, 2023

            15.19.2.1. By Type

            15.19.2.2. By End-Use

    15.20. South Korea

        15.20.1. Pricing Analysis

        15.20.2. Market Share Analysis, 2023

            15.20.2.1. By Type

            15.20.2.2. By End-Use

    15.21. GCC Countries

        15.21.1. Pricing Analysis

        15.21.2. Market Share Analysis, 2023

            15.21.2.1. By Type

            15.21.2.2. By End-Use

    15.22. South Africa

        15.22.1. Pricing Analysis

        15.22.2. Market Share Analysis, 2023

            15.22.2.1. By Type

            15.22.2.2. By End-Use

    15.23. Israel

        15.23.1. Pricing Analysis

        15.23.2. Market Share Analysis, 2023

            15.23.2.1. By Type

            15.23.2.2. By End-Use

16. Market Structure Analysis

    16.1. Competition Dashboard

    16.2. Competition Benchmarking

    16.3. Market Share Analysis of Top Players

        16.3.1. By Regional

        16.3.2. By Type

        16.3.3. By End-Use

17. Competition Analysis

    17.1. Competition Deep Dive

        17.1.1. BASF SE

            17.1.1.1. Overview

            17.1.1.2. Product Portfolio

            17.1.1.3. Profitability by Market Segments

            17.1.1.4. Sales Footprint

            17.1.1.5. Strategy Overview

                17.1.1.5.1. Marketing Strategy

                17.1.1.5.2. Product Strategy

                17.1.1.5.3. Channel Strategy

        17.1.2. Covestro AG

            17.1.2.1. Overview

            17.1.2.2. Product Portfolio

            17.1.2.3. Profitability by Market Segments

            17.1.2.4. Sales Footprint

            17.1.2.5. Strategy Overview

                17.1.2.5.1. Marketing Strategy

                17.1.2.5.2. Product Strategy

                17.1.2.5.3. Channel Strategy

        17.1.3. Huntsman Corporation

            17.1.3.1. Overview

            17.1.3.2. Product Portfolio

            17.1.3.3. Profitability by Market Segments

            17.1.3.4. Sales Footprint

            17.1.3.5. Strategy Overview

                17.1.3.5.1. Marketing Strategy

                17.1.3.5.2. Product Strategy

                17.1.3.5.3. Channel Strategy

        17.1.4. INOAC Corporation

            17.1.4.1. Overview

            17.1.4.2. Product Portfolio

            17.1.4.3. Profitability by Market Segments

            17.1.4.4. Sales Footprint

            17.1.4.5. Strategy Overview

                17.1.4.5.1. Marketing Strategy

                17.1.4.5.2. Product Strategy

                17.1.4.5.3. Channel Strategy

        17.1.5. Recticel NV

            17.1.5.1. Overview

            17.1.5.2. Product Portfolio

            17.1.5.3. Profitability by Market Segments

            17.1.5.4. Sales Footprint

            17.1.5.5. Strategy Overview

                17.1.5.5.1. Marketing Strategy

                17.1.5.5.2. Product Strategy

                17.1.5.5.3. Channel Strategy

        17.1.6. Rogers Corporation

            17.1.6.1. Overview

            17.1.6.2. Product Portfolio

            17.1.6.3. Profitability by Market Segments

            17.1.6.4. Sales Footprint

            17.1.6.5. Strategy Overview

                17.1.6.5.1. Marketing Strategy

                17.1.6.5.2. Product Strategy

                17.1.6.5.3. Channel Strategy

        17.1.7. Sekisui Chemical Co. Ltd.

            17.1.7.1. Overview

            17.1.7.2. Product Portfolio

            17.1.7.3. Profitability by Market Segments

            17.1.7.4. Sales Footprint

            17.1.7.5. Strategy Overview

                17.1.7.5.1. Marketing Strategy

                17.1.7.5.2. Product Strategy

                17.1.7.5.3. Channel Strategy

        17.1.8. The DOW Chemical Company

            17.1.8.1. Overview

            17.1.8.2. Product Portfolio

            17.1.8.3. Profitability by Market Segments

            17.1.8.4. Sales Footprint

            17.1.8.5. Strategy Overview

                17.1.8.5.1. Marketing Strategy

                17.1.8.5.2. Product Strategy

                17.1.8.5.3. Channel Strategy

        17.1.9. The Woodbridge Group

            17.1.9.1. Overview

            17.1.9.2. Product Portfolio

            17.1.9.3. Profitability by Market Segments

            17.1.9.4. Sales Footprint

            17.1.9.5. Strategy Overview

                17.1.9.5.1. Marketing Strategy

                17.1.9.5.2. Product Strategy

                17.1.9.5.3. Channel Strategy

        17.1.10. Ube Industries, Ltd.

            17.1.10.1. Overview

            17.1.10.2. Product Portfolio

            17.1.10.3. Profitability by Market Segments

            17.1.10.4. Sales Footprint

            17.1.10.5. Strategy Overview

                17.1.10.5.1. Marketing Strategy

                17.1.10.5.2. Product Strategy

                17.1.10.5.3. Channel Strategy

18. Assumptions & Acronyms Used

19. Research Methodology

List of Tables

Table 1: Global Market Value (US$ Million) Forecast by Region, 2019 to 2034

Table 2: Global Market Volume (Square Feet) Forecast by Region, 2019 to 2034

Table 3: Global Market Value (US$ Million) Forecast by Type, 2019 to 2034

Table 4: Global Market Volume (Square Feet) Forecast by Type, 2019 to 2034

Table 5: Global Market Value (US$ Million) Forecast by End-Use, 2019 to 2034

Table 6: Global Market Volume (Square Feet) Forecast by End-Use, 2019 to 2034

Table 7: North America Market Value (US$ Million) Forecast by Country, 2019 to 2034

Table 8: North America Market Volume (Square Feet) Forecast by Country, 2019 to 2034

Table 9: North America Market Value (US$ Million) Forecast by Type, 2019 to 2034

Table 10: North America Market Volume (Square Feet) Forecast by Type, 2019 to 2034

Table 11: North America Market Value (US$ Million) Forecast by End-Use, 2019 to 2034

Table 12: North America Market Volume (Square Feet) Forecast by End-Use, 2019 to 2034

Table 13: Latin America Market Value (US$ Million) Forecast by Country, 2019 to 2034

Table 14: Latin America Market Volume (Square Feet) Forecast by Country, 2019 to 2034

Table 15: Latin America Market Value (US$ Million) Forecast by Type, 2019 to 2034

Table 16: Latin America Market Volume (Square Feet) Forecast by Type, 2019 to 2034

Table 17: Latin America Market Value (US$ Million) Forecast by End-Use, 2019 to 2034

Table 18: Latin America Market Volume (Square Feet) Forecast by End-Use, 2019 to 2034

Table 19: Western Europe Market Value (US$ Million) Forecast by Country, 2019 to 2034

Table 20: Western Europe Market Volume (Square Feet) Forecast by Country, 2019 to 2034

Table 21: Western Europe Market Value (US$ Million) Forecast by Type, 2019 to 2034

Table 22: Western Europe Market Volume (Square Feet) Forecast by Type, 2019 to 2034

Table 23: Western Europe Market Value (US$ Million) Forecast by End-Use, 2019 to 2034

Table 24: Western Europe Market Volume (Square Feet) Forecast by End-Use, 2019 to 2034

Table 25: Eastern Europe Market Value (US$ Million) Forecast by Country, 2019 to 2034

Table 26: Eastern Europe Market Volume (Square Feet) Forecast by Country, 2019 to 2034

Table 27: Eastern Europe Market Value (US$ Million) Forecast by Type, 2019 to 2034

Table 28: Eastern Europe Market Volume (Square Feet) Forecast by Type, 2019 to 2034

Table 29: Eastern Europe Market Value (US$ Million) Forecast by End-Use, 2019 to 2034

Table 30: Eastern Europe Market Volume (Square Feet) Forecast by End-Use, 2019 to 2034

Table 31: South Asia and Pacific Market Value (US$ Million) Forecast by Country, 2019 to 2034

Table 32: South Asia and Pacific Market Volume (Square Feet) Forecast by Country, 2019 to 2034

Table 33: South Asia and Pacific Market Value (US$ Million) Forecast by Type, 2019 to 2034

Table 34: South Asia and Pacific Market Volume (Square Feet) Forecast by Type, 2019 to 2034

Table 35: South Asia and Pacific Market Value (US$ Million) Forecast by End-Use, 2019 to 2034

Table 36: South Asia and Pacific Market Volume (Square Feet) Forecast by End-Use, 2019 to 2034

Table 37: East Asia Market Value (US$ Million) Forecast by Country, 2019 to 2034

Table 38: East Asia Market Volume (Square Feet) Forecast by Country, 2019 to 2034

Table 39: East Asia Market Value (US$ Million) Forecast by Type, 2019 to 2034

Table 40: East Asia Market Volume (Square Feet) Forecast by Type, 2019 to 2034

Table 41: East Asia Market Value (US$ Million) Forecast by End-Use, 2019 to 2034

Table 42: East Asia Market Volume (Square Feet) Forecast by End-Use, 2019 to 2034

Table 43: Middle East and Africa Market Value (US$ Million) Forecast by Country, 2019 to 2034

Table 44: Middle East and Africa Market Volume (Square Feet) Forecast by Country, 2019 to 2034

Table 45: Middle East and Africa Market Value (US$ Million) Forecast by Type, 2019 to 2034

Table 46: Middle East and Africa Market Volume (Square Feet) Forecast by Type, 2019 to 2034

Table 47: Middle East and Africa Market Value (US$ Million) Forecast by End-Use, 2019 to 2034

Table 48: Middle East and Africa Market Volume (Square Feet) Forecast by End-Use, 2019 to 2034

List of Charts

Figure 1: Global Market Value (US$ Million) by Type, 2024 to 2034

Figure 2: Global Market Value (US$ Million) by End-Use, 2024 to 2034

Figure 3: Global Market Value (US$ Million) by Region, 2024 to 2034

Figure 4: Global Market Value (US$ Million) Analysis by Region, 2019 to 2034

Figure 5: Global Market Volume (Square Feet) Analysis by Region, 2019 to 2034

Figure 6: Global Market Value Share (%) and BPS Analysis by Region, 2024 to 2034

Figure 7: Global Market Y-o-Y Growth (%) Projections by Region, 2024 to 2034

Figure 8: Global Market Value (US$ Million) Analysis by Type, 2019 to 2034

Figure 9: Global Market Volume (Square Feet) Analysis by Type, 2019 to 2034

Figure 10: Global Market Value Share (%) and BPS Analysis by Type, 2024 to 2034

Figure 11: Global Market Y-o-Y Growth (%) Projections by Type, 2024 to 2034

Figure 12: Global Market Value (US$ Million) Analysis by End-Use, 2019 to 2034

Figure 13: Global Market Volume (Square Feet) Analysis by End-Use, 2019 to 2034

Figure 14: Global Market Value Share (%) and BPS Analysis by End-Use, 2024 to 2034

Figure 15: Global Market Y-o-Y Growth (%) Projections by End-Use, 2024 to 2034

Figure 16: Global Market Attractiveness by Type, 2024 to 2034

Figure 17: Global Market Attractiveness by End-Use, 2024 to 2034

Figure 18: Global Market Attractiveness by Region, 2024 to 2034

Figure 19: North America Market Value (US$ Million) by Type, 2024 to 2034

Figure 20: North America Market Value (US$ Million) by End-Use, 2024 to 2034

Figure 21: North America Market Value (US$ Million) by Country, 2024 to 2034

Figure 22: North America Market Value (US$ Million) Analysis by Country, 2019 to 2034

Figure 23: North America Market Volume (Square Feet) Analysis by Country, 2019 to 2034

Figure 24: North America Market Value Share (%) and BPS Analysis by Country, 2024 to 2034

Figure 25: North America Market Y-o-Y Growth (%) Projections by Country, 2024 to 2034

Figure 26: North America Market Value (US$ Million) Analysis by Type, 2019 to 2034

Figure 27: North America Market Volume (Square Feet) Analysis by Type, 2019 to 2034

Figure 28: North America Market Value Share (%) and BPS Analysis by Type, 2024 to 2034

Figure 29: North America Market Y-o-Y Growth (%) Projections by Type, 2024 to 2034

Figure 30: North America Market Value (US$ Million) Analysis by End-Use, 2019 to 2034

Figure 31: North America Market Volume (Square Feet) Analysis by End-Use, 2019 to 2034

Figure 32: North America Market Value Share (%) and BPS Analysis by End-Use, 2024 to 2034

Figure 33: North America Market Y-o-Y Growth (%) Projections by End-Use, 2024 to 2034

Figure 34: North America Market Attractiveness by Type, 2024 to 2034

Figure 35: North America Market Attractiveness by End-Use, 2024 to 2034

Figure 36: North America Market Attractiveness by Country, 2024 to 2034

Figure 37: Latin America Market Value (US$ Million) by Type, 2024 to 2034

Figure 38: Latin America Market Value (US$ Million) by End-Use, 2024 to 2034

Figure 39: Latin America Market Value (US$ Million) by Country, 2024 to 2034

Figure 40: Latin America Market Value (US$ Million) Analysis by Country, 2019 to 2034

Figure 41: Latin America Market Volume (Square Feet) Analysis by Country, 2019 to 2034

Figure 42: Latin America Market Value Share (%) and BPS Analysis by Country, 2024 to 2034

Figure 43: Latin America Market Y-o-Y Growth (%) Projections by Country, 2024 to 2034

Figure 44: Latin America Market Value (US$ Million) Analysis by Type, 2019 to 2034

Figure 45: Latin America Market Volume (Square Feet) Analysis by Type, 2019 to 2034

Figure 46: Latin America Market Value Share (%) and BPS Analysis by Type, 2024 to 2034

Figure 47: Latin America Market Y-o-Y Growth (%) Projections by Type, 2024 to 2034

Figure 48: Latin America Market Value (US$ Million) Analysis by End-Use, 2019 to 2034

Figure 49: Latin America Market Volume (Square Feet) Analysis by End-Use, 2019 to 2034

Figure 50: Latin America Market Value Share (%) and BPS Analysis by End-Use, 2024 to 2034

Figure 51: Latin America Market Y-o-Y Growth (%) Projections by End-Use, 2024 to 2034

Figure 52: Latin America Market Attractiveness by Type, 2024 to 2034

Figure 53: Latin America Market Attractiveness by End-Use, 2024 to 2034

Figure 54: Latin America Market Attractiveness by Country, 2024 to 2034

Figure 55: Western Europe Market Value (US$ Million) by Type, 2024 to 2034

Figure 56: Western Europe Market Value (US$ Million) by End-Use, 2024 to 2034

Figure 57: Western Europe Market Value (US$ Million) by Country, 2024 to 2034

Figure 58: Western Europe Market Value (US$ Million) Analysis by Country, 2019 to 2034

Figure 59: Western Europe Market Volume (Square Feet) Analysis by Country, 2019 to 2034

Figure 60: Western Europe Market Value Share (%) and BPS Analysis by Country, 2024 to 2034

Figure 61: Western Europe Market Y-o-Y Growth (%) Projections by Country, 2024 to 2034

Figure 62: Western Europe Market Value (US$ Million) Analysis by Type, 2019 to 2034

Figure 63: Western Europe Market Volume (Square Feet) Analysis by Type, 2019 to 2034

Figure 64: Western Europe Market Value Share (%) and BPS Analysis by Type, 2024 to 2034

Figure 65: Western Europe Market Y-o-Y Growth (%) Projections by Type, 2024 to 2034

Figure 66: Western Europe Market Value (US$ Million) Analysis by End-Use, 2019 to 2034

Figure 67: Western Europe Market Volume (Square Feet) Analysis by End-Use, 2019 to 2034

Figure 68: Western Europe Market Value Share (%) and BPS Analysis by End-Use, 2024 to 2034

Figure 69: Western Europe Market Y-o-Y Growth (%) Projections by End-Use, 2024 to 2034

Figure 70: Western Europe Market Attractiveness by Type, 2024 to 2034

Figure 71: Western Europe Market Attractiveness by End-Use, 2024 to 2034

Figure 72: Western Europe Market Attractiveness by Country, 2024 to 2034

Figure 73: Eastern Europe Market Value (US$ Million) by Type, 2024 to 2034

Figure 74: Eastern Europe Market Value (US$ Million) by End-Use, 2024 to 2034

Figure 75: Eastern Europe Market Value (US$ Million) by Country, 2024 to 2034

Figure 76: Eastern Europe Market Value (US$ Million) Analysis by Country, 2019 to 2034

Figure 77: Eastern Europe Market Volume (Square Feet) Analysis by Country, 2019 to 2034

Figure 78: Eastern Europe Market Value Share (%) and BPS Analysis by Country, 2024 to 2034

Figure 79: Eastern Europe Market Y-o-Y Growth (%) Projections by Country, 2024 to 2034

Figure 80: Eastern Europe Market Value (US$ Million) Analysis by Type, 2019 to 2034

Figure 81: Eastern Europe Market Volume (Square Feet) Analysis by Type, 2019 to 2034

Figure 82: Eastern Europe Market Value Share (%) and BPS Analysis by Type, 2024 to 2034

Figure 83: Eastern Europe Market Y-o-Y Growth (%) Projections by Type, 2024 to 2034

Figure 84: Eastern Europe Market Value (US$ Million) Analysis by End-Use, 2019 to 2034

Figure 85: Eastern Europe Market Volume (Square Feet) Analysis by End-Use, 2019 to 2034

Figure 86: Eastern Europe Market Value Share (%) and BPS Analysis by End-Use, 2024 to 2034

Figure 87: Eastern Europe Market Y-o-Y Growth (%) Projections by End-Use, 2024 to 2034

Figure 88: Eastern Europe Market Attractiveness by Type, 2024 to 2034

Figure 89: Eastern Europe Market Attractiveness by End-Use, 2024 to 2034

Figure 90: Eastern Europe Market Attractiveness by Country, 2024 to 2034

Figure 91: South Asia and Pacific Market Value (US$ Million) by Type, 2024 to 2034

Figure 92: South Asia and Pacific Market Value (US$ Million) by End-Use, 2024 to 2034

Figure 93: South Asia and Pacific Market Value (US$ Million) by Country, 2024 to 2034

Figure 94: South Asia and Pacific Market Value (US$ Million) Analysis by Country, 2019 to 2034

Figure 95: South Asia and Pacific Market Volume (Square Feet) Analysis by Country, 2019 to 2034

Figure 96: South Asia and Pacific Market Value Share (%) and BPS Analysis by Country, 2024 to 2034

Figure 97: South Asia and Pacific Market Y-o-Y Growth (%) Projections by Country, 2024 to 2034

Figure 98: South Asia and Pacific Market Value (US$ Million) Analysis by Type, 2019 to 2034

Figure 99: South Asia and Pacific Market Volume (Square Feet) Analysis by Type, 2019 to 2034

Figure 100: South Asia and Pacific Market Value Share (%) and BPS Analysis by Type, 2024 to 2034

Figure 101: South Asia and Pacific Market Y-o-Y Growth (%) Projections by Type, 2024 to 2034

Figure 102: South Asia and Pacific Market Value (US$ Million) Analysis by End-Use, 2019 to 2034

Figure 103: South Asia and Pacific Market Volume (Square Feet) Analysis by End-Use, 2019 to 2034

Figure 104: South Asia and Pacific Market Value Share (%) and BPS Analysis by End-Use, 2024 to 2034

Figure 105: South Asia and Pacific Market Y-o-Y Growth (%) Projections by End-Use, 2024 to 2034

Figure 106: South Asia and Pacific Market Attractiveness by Type, 2024 to 2034

Figure 107: South Asia and Pacific Market Attractiveness by End-Use, 2024 to 2034

Figure 108: South Asia and Pacific Market Attractiveness by Country, 2024 to 2034

Figure 109: East Asia Market Value (US$ Million) by Type, 2024 to 2034

Figure 110: East Asia Market Value (US$ Million) by End-Use, 2024 to 2034

Figure 111: East Asia Market Value (US$ Million) by Country, 2024 to 2034

Figure 112: East Asia Market Value (US$ Million) Analysis by Country, 2019 to 2034

Figure 113: East Asia Market Volume (Square Feet) Analysis by Country, 2019 to 2034

Figure 114: East Asia Market Value Share (%) and BPS Analysis by Country, 2024 to 2034

Figure 115: East Asia Market Y-o-Y Growth (%) Projections by Country, 2024 to 2034

Figure 116: East Asia Market Value (US$ Million) Analysis by Type, 2019 to 2034

Figure 117: East Asia Market Volume (Square Feet) Analysis by Type, 2019 to 2034

Figure 118: East Asia Market Value Share (%) and BPS Analysis by Type, 2024 to 2034

Figure 119: East Asia Market Y-o-Y Growth (%) Projections by Type, 2024 to 2034

Figure 120: East Asia Market Value (US$ Million) Analysis by End-Use, 2019 to 2034

Figure 121: East Asia Market Volume (Square Feet) Analysis by End-Use, 2019 to 2034

Figure 122: East Asia Market Value Share (%) and BPS Analysis by End-Use, 2024 to 2034

Figure 123: East Asia Market Y-o-Y Growth (%) Projections by End-Use, 2024 to 2034

Figure 124: East Asia Market Attractiveness by Type, 2024 to 2034

Figure 125: East Asia Market Attractiveness by End-Use, 2024 to 2034

Figure 126: East Asia Market Attractiveness by Country, 2024 to 2034

Figure 127: Middle East and Africa Market Value (US$ Million) by Type, 2024 to 2034

Figure 128: Middle East and Africa Market Value (US$ Million) by End-Use, 2024 to 2034

Figure 129: Middle East and Africa Market Value (US$ Million) by Country, 2024 to 2034

Figure 130: Middle East and Africa Market Value (US$ Million) Analysis by Country, 2019 to 2034

Figure 131: Middle East and Africa Market Volume (Square Feet) Analysis by Country, 2019 to 2034

Figure 132: Middle East and Africa Market Value Share (%) and BPS Analysis by Country, 2024 to 2034

Figure 133: Middle East and Africa Market Y-o-Y Growth (%) Projections by Country, 2024 to 2034

Figure 134: Middle East and Africa Market Value (US$ Million) Analysis by Type, 2019 to 2034

Figure 135: Middle East and Africa Market Volume (Square Feet) Analysis by Type, 2019 to 2034

Figure 136: Middle East and Africa Market Value Share (%) and BPS Analysis by Type, 2024 to 2034

Figure 137: Middle East and Africa Market Y-o-Y Growth (%) Projections by Type, 2024 to 2034

Figure 138: Middle East and Africa Market Value (US$ Million) Analysis by End-Use, 2019 to 2034

Figure 139: Middle East and Africa Market Volume (Square Feet) Analysis by End-Use, 2019 to 2034

Figure 140: Middle East and Africa Market Value Share (%) and BPS Analysis by End-Use, 2024 to 2034

Figure 141: Middle East and Africa Market Y-o-Y Growth (%) Projections by End-Use, 2024 to 2034

Figure 142: Middle East and Africa Market Attractiveness by Type, 2024 to 2034

Figure 143: Middle East and Africa Market Attractiveness by End-Use, 2024 to 2034

Figure 144: Middle East and Africa Market Attractiveness by Country, 2024 to 2034

Recommendations

Chemicals & Materials

Polyurethane Foam Market

Published : December 2022

Chemicals & Materials

Flexible Colored PU Foams Market

Published : June 2022

Explore Consumer Product Insights

View Reports