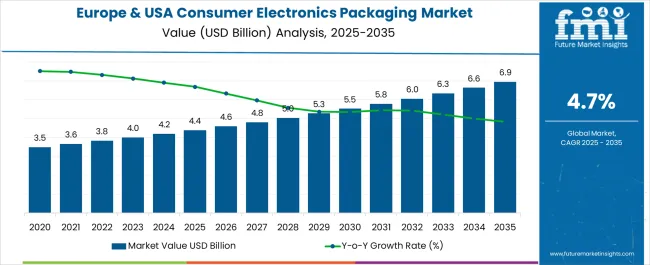
The Europe & USA Consumer Electronics Packaging Market is estimated to be valued at USD 4.4 billion in 2025 and is projected to reach USD 6.9 billion by 2035, registering a compound annual growth rate (CAGR) of 4.7% over the forecast period.
| Metric | Value |
|---|---|
| Europe & USA Consumer Electronics Packaging Market Estimated Value in (2025 E) | USD 4.4 billion |
| Europe & USA Consumer Electronics Packaging Market Forecast Value in (2035 F) | USD 6.9 billion |
| Forecast CAGR (2025 to 2035) | 4.7% |
The Europe and USA consumer electronics packaging market is experiencing strong momentum due to rapid technological advancements, rising demand for premium electronic devices, and increasing emphasis on sustainable packaging practices. With growing consumer expectations for protective, lightweight, and visually appealing packaging, manufacturers are investing in innovative materials and structural designs that balance durability with environmental performance.
Strict regulations around recyclability and circular economy goals in Europe, combined with sustainability commitments from leading electronics brands in the USA, are further accelerating adoption of eco friendly solutions. At the same time, e commerce expansion has created demand for packaging that ensures safety during transit while enhancing unboxing experiences.
The outlook for the market remains favorable as companies continue to explore digital printing, smart labeling, and recyclable substrates to strengthen branding, regulatory compliance, and consumer engagement.
The plastic material type segment is expected to contribute 54.20% of total market revenue by 2025, making it the largest material choice in consumer electronics packaging. Its dominance is supported by its lightweight properties, superior durability, and versatility in protecting fragile devices.
Plastic provides enhanced resistance against moisture, impact, and external stress, ensuring the safe transportation of sensitive electronics. The cost efficiency of plastic materials, combined with their adaptability to customized designs and finishes, has reinforced their preference among manufacturers.
With innovations in recyclable and biodegradable plastics, the segment is further benefiting from alignment with sustainability regulations, which has strengthened its position as the leading material type.
The folding cartons segment is projected to hold 47.60% of market revenue within the product type category by 2025, positioning it as the leading format. Folding cartons are favored for their structural integrity, branding flexibility, and ability to support high quality printing for product differentiation.
Their recyclability and compliance with sustainability goals have reinforced adoption, particularly among premium electronics brands seeking eco friendly solutions without compromising aesthetics. Additionally, folding cartons enhance consumer experiences through innovative structural designs and unboxing features, which are increasingly important in retail and e commerce channels.
Their balance of sustainability, cost efficiency, and marketing appeal has established folding cartons as the dominant product type in the market.
The mobile phones segment is expected to account for 42.80% of total market revenue by 2025, making it the leading application category. This growth is driven by the high volume of smartphone shipments across Europe and the USA, coupled with the rising importance of protective, lightweight, and visually appealing packaging.
Mobile phone packaging must meet multiple requirements, including product safety during long supply chains, integration of accessories, and alignment with brand identity. Increasing consumer focus on premium unboxing experiences has encouraged manufacturers to invest in innovative packaging solutions that combine functionality with aesthetics.
Furthermore, regulations supporting recyclable and sustainable packaging have influenced packaging strategies in the mobile phone sector, strengthening its role as the dominant application in the consumer electronics packaging market.
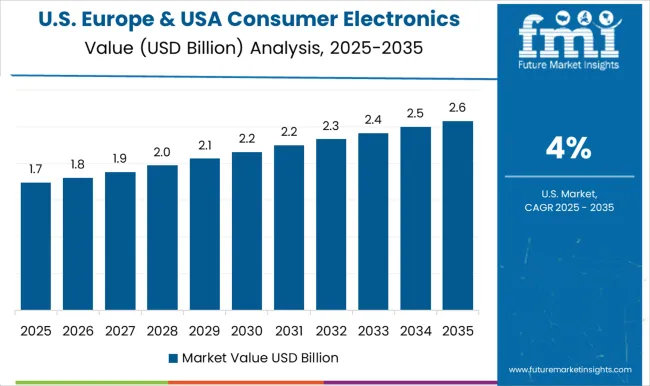
Consumer electronics packaging sales across Europe grew at 2.9% CAGR from 2020 to 2025. At the end of 2025, total market value in Europe reached USD 4.4 billion. On the other hand, sales of consumer electronics packaging in the USA increased at 2.4% CAGR during the historic period. The USA market size was valued at USD 2.3 billion in 2025.
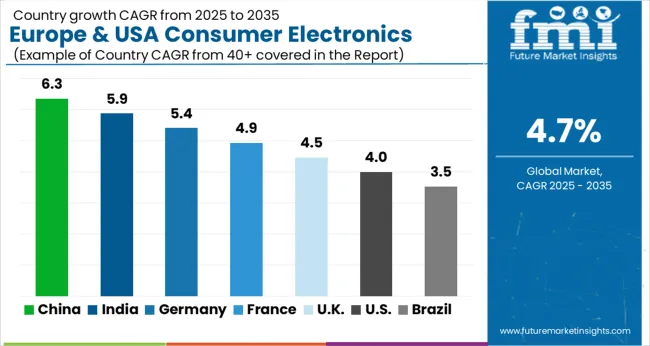
Between 2025 and 2035, consumer electronics demand across Europe and the USA is expected to surge at 4.8% CAGR and 3.5% CAGR respectively.
The term “consumer electronic device” refers to an electronic device intended for daily private usage. The device typically has one or more integrated circuits (ICs) and works on direct current (DC). For example, mobile phones, computers, music systems, game consoles, electronic wearables, etc.
These are extremely fragile products that need to be packed very well before shipping and transportation. For this purpose, packaging products such as corrugated boxes, cartons, etc. are used.
Consumer electronics packaging products are lightweight and offer better protection to products. They also feature high graphics printing and ESD protection which makes them popular.
The global commoditization trend of consumer electronics products and shortening product life cycles (PLC) are aggressively driving the demand for consumer electronics packaging.
The packaging industry is leading at the forefront when it comes to innovation. New protective packaging solutions are being developed to cater to changing developments. For instance, eco-friendly packaging and smart packaging are helping electronics makers incorporate environmentally green designs into their products.
Rising awareness of the environmental side-effects of wasteful packaging is supporting the trend. For instance, in 2020 Samsung began phasing out plastic from its packaging materials. The company pledged to replace plastic it had used for its holder trays with molded pulp.
Surging demand for sustainable packaging solutions among electronics brands will fuel consumer electronics packaging sales.
Demand is particularly growing for consumer electronics packaging made from sustainable materials such as paper & paperboard and molded pulp.
Growing Popularity of Intelligent Packaging Driving Consumer Electronics Packaging Sales
Smart and intelligent packaging offers various benefits to brands, retailers, and consumers. This includes electronic articles surveillance for anti-theft and RFID for wireless item identification.
Subsequently, QR codes for identification and data loggers for monitoring temperature, shock, vibration, etc., will make smart and intelligent packaging popular.
Electronics businesses are particularly concentrating on customer experience when unpacking their newly purchased electronic products with easy-to-open, minimal packaging that effectively safeguards the product.
Consumers are curious about the latest innovations, be it packaging or device, and the industry is gaining profits from this. The aforesaid benefits will boost Europe and USA consumer electronics packaging market.
Ability of Consumer Electronics Packaging to be Used Across All Channels Spiking Demand
Manufacturers of consumer electronics are shifting towards packaging that suits cross-channel distribution. This is because the recent trends in consumer electronics packaging show that consumers are not buying from the same retailer or the same channel every time, and are changing the channels often.
So, packaging that suits all formats and channels is the need of the hour. Manufacturers want to avoid the customization costs involved in making separate packaging formats for individual sales channels. This is creating high demand for packaging products that can be used across all channels.
Growing Electronic Device Demand Propelling Consumer Electronics Packaging Sales in the USA
The United States consumer electronics packaging market will expand 1.5 times the current market value by 2035. Demand across the USA remains particularly high for paper & paperboard packaging.
The rise of both the IT sector and the gaming industry in the USA is fuelling sales of electronic devices such as laptops, monitors, and CPUs, among others. This is generating demand for consumer electronic packaging.
According to the International Trade Administration, USA Department of Commerce, around 1/3rd of the total information technology (IT) market is in the United States This, in turn, is boosting the use of corrugated boxes, folding cartons, and paper protective packaging products to protect heavy and fragile devices.
The increased consumption of electronic computing devices in the country will continue to offer lucrative growth opportunities for consumer electronics packaging manufacturers.
Robust Expansion of Electronics Sector Boosting Consumer Electronic Packaging Sales in Germany
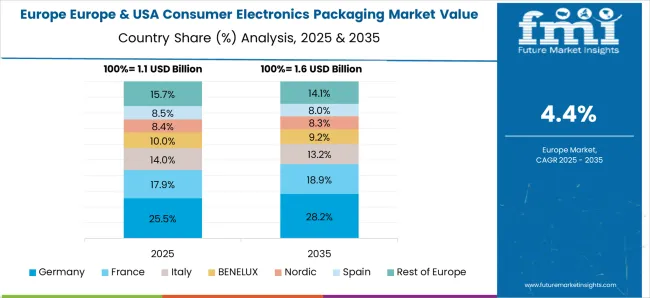
Germany is projected to hold around 22% of Europe consumer electronics packaging market by 2025. Germany is known as an innovative microelectronics research and production hub across the globe.
As per Germany Trade & Invest, the electronics sector in Germany contributes 10% of domestic industrial input and 23% of R&D spending in the country. The German market for electronics is the largest in the whole of Europe. This is fuelling the demand for consumer electronics packaging as they keep devices and their components safe during transit and storage.
Growing demand for sustainable consumer electronics packaging due to rising environmental concerns will further boost market over the next ten years.
Paper & Paperboards Remains the Most Commonly Utilized Material
Based on material, the market is segmented into plastic, molded fiber, and paper & paperboard. Among these, paper & paperboard segment is set to hold around 3/5th share of the market by the end of 2035.
Paper & paperboard material is mostly preferred by consumer electronics packaging manufacturers. This is due to growing awareness of sustainability among Europe and USA consumers.
Rising concerns about increasing plastic pollution levels will also encourage the adoption of paper & paperboard material.
By application, electronic wearables will generate enormous demand for consumer electronic packaging. This is due to high adoption of numerous electronic wearables across the USA and Europe.
Electronic wearables are witnessing a rise in popularity due to innovations such as miniature wearable sensors and enhanced communication capabilities. These include devices such as head-mounted displays, smart watches, smart bands, ear wearables, etc. These wearables are particularly among gen-z and millennials.
The electronic wearables segment is projected to expand 2.0 times the current market value by 2035.
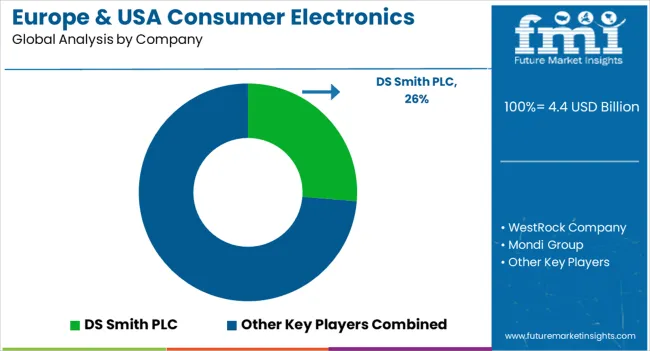
Key consumer electronics packaging manufacturers across Europe and the USA are expanding their resources and manufacturing capabilities through partnerships and acquisitions. They are focusing on creating new products for the ever-increasing demand while also keeping sustainability in check. For instance
| Attribute | Details |
|---|---|
| Anticipated Growth Rate (2025 and 2035) | 4.8% CAGR (Europe) 3.5% CAGR (United States) |
| Europe Estimated Market Size 2025 | USD 4 billion |
| Europe Projected Market Size (2035) | USD 6.4 billion |
| USA Estimated Market Size (2025) | USD 2.4 billion |
| USA Projected Market Size (2035) | USD 3.3 billion |
| Historical Data | 2020 to 2025 |
| Forecast Period | 2025 to 2035 |
| Quantitative Units | Revenue in USD Million/Billion, Volume in Tonnes and CAGR from 2025 to 2035 |
| Segment Covered | Material Type, Product Type, Application, Region |
| Regions Covered | Europe; USA |
| Key Countries Profiled | Germany, Italy, France, United Kingdom, Spain, Benelux, Nordic, Russia, Poland, USA |
| Key Companies Profiled | DS Smith PLC; WestRock Company; Mondi Group; Sonoco Products Company; International Paper Company; Smurfit Kappa Group PLC; Stora Enso Oyj; Pregis LLC; Sealed Air Corporation; UFP Technologies, Inc.; NEFAB Group; JohnsByrne; Billerud AB; Universal Protective Packaging Inc.; PakFactory; Dordan Manufacturing Company; Golden Arrow Technology America Inc.; Wolters Packaging Czech Ltd.; Mayr-Melnhof Karton AG; Europe Packaging B.V.; Dunapack Packaging (Prinzhorn Group); GWP Group; GPA Global; Zenpack; GY Packaging |
| Report Coverage | Revenue Forecast, Volume Forecast, Company Ranking, Competitive Landscape, Growth Factors, Trends and Pricing Analysis |
The global europe & usa consumer electronics packaging market is estimated to be valued at USD 4.4 billion in 2025.
The market size for the europe & usa consumer electronics packaging market is projected to reach USD 6.9 billion by 2035.
The europe & usa consumer electronics packaging market is expected to grow at a 4.7% CAGR between 2025 and 2035.
The key product types in europe & usa consumer electronics packaging market are plastic, paper & paperboard and molded fiber.
In terms of product type, folding cartons segment to command 47.6% share in the europe & usa consumer electronics packaging market in 2025.


Full Research Suite comprises of:
Market outlook & trends analysis
Interviews & case studies
Strategic recommendations
Vendor profiles & capabilities analysis
5-year forecasts
8 regions and 60+ country-level data splits
Market segment data splits
12 months of continuous data updates
DELIVERED AS:
PDF EXCEL ONLINE
Europe Radiotherapy Patient Positioning Market Size and Share Forecast Outlook 2025 to 2035
Europe Polyvinyl Alcohol Industry Analysis Size and Share Forecast Outlook 2025 to 2035
Europe Cruise Market Forecast and Outlook 2025 to 2035
Europe Massage Therapy Service Market Size and Share Forecast Outlook 2025 to 2035
Europe Cement Market Analysis Size and Share Forecast Outlook 2025 to 2035
European Union Tourism Industry Size and Share Forecast Outlook 2025 to 2035
Europe Injection Molding Machines Market Size and Share Forecast Outlook 2025 to 2035
Europe Injection Moulders Market Size and Share Forecast Outlook 2025 to 2035
Europe and MENA Generic Oncology Drug Market Size and Share Forecast Outlook 2025 to 2035
Europe Masking Tapes Market Size and Share Forecast Outlook 2025 to 2035
Europe Liners Market Size and Share Forecast Outlook 2025 to 2035
Europe Dermal Fillers Market Size and Share Forecast Outlook 2025 to 2035
Europe Trolley Bus Market Size and Share Forecast Outlook 2025 to 2035
Europe Protease Market Size and Share Forecast Outlook 2025 to 2035
Europe Plant-Based Meal Kit Market Size and Share Forecast Outlook 2025 to 2035
Europe Rubber Derived Unrefined Pyrolysis Oil Market Size and Share Forecast Outlook 2025 to 2035
Europe Pet Food Market Analysis by Nature, Product Type, Source, Pet Type, Packaging, Distribution Channel, and Country - Growth, Trends, and Forecast through 2025 to 2035
Europe's Golden Generation Travel Market Size and Share Forecast Outlook 2025 to 2035
Europe Automotive Night Vision System Market Size and Share Forecast Outlook 2025 to 2035
Europe Winter Tourism Market Size and Share Forecast Outlook 2025 to 2035

Thank you!
You will receive an email from our Business Development Manager. Please be sure to check your SPAM/JUNK folder too.
Chat With
MaRIA