Europe and MENA Generic Oncology Drug Market Size and Share Forecast Outlook 2025 to 2035

The Europe and MENA Generic Oncology Drug Market is estimated to be valued at USD 7.0 billion in 2025 and is projected to reach USD 8.5 billion by 2035, registering a compound annual growth rate (CAGR) of 2.0% over the forecast period.
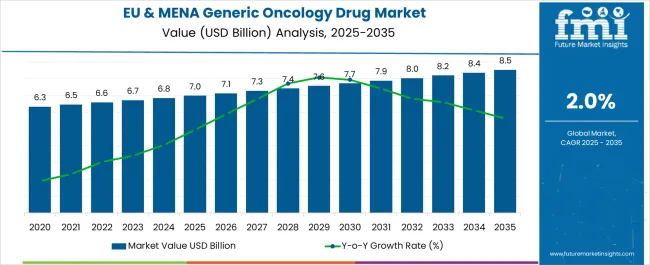
Quick Stats for Europe and MENA Generic Oncology Drug Market

  • Europe and MENA Generic Oncology Drug Market Industry Value (2025): USD 7.0 billion
  • Europe and MENA Generic Oncology Drug Market Forecast Value (2035): USD 8.5 billion
  • Europe and MENA Generic Oncology Drug Market Forecast CAGR: 2.0%
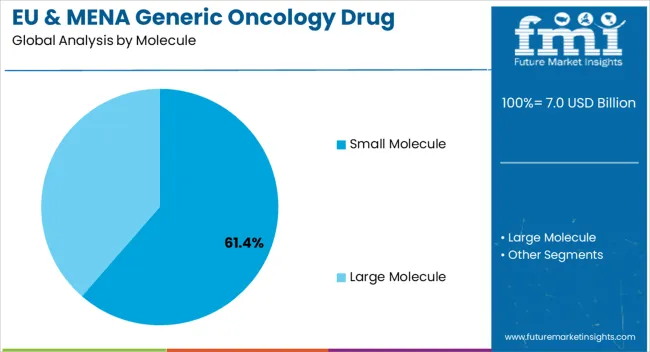
  • Leading Segment in Europe and MENA Generic Oncology Drug Market in 2025: Small Molecule (61.4%)
  • Key Growth Region in Europe and MENA Generic Oncology Drug Market: North America, Asia-Pacific, Europe
  • Top Key Players in Europe and MENA Generic Oncology Drug Market: Teva Pharmaceutical Industries Ltd., Cipla, Eli Lilly & Co., GlaxoSmithKline Plc., Sanofi S.A., Sun Pharmaceutical Industries Ltd., Lupin Ltd., Hikma Pharmaceuticals PLC, Viatris Inc. (Mylan N.V), Johnson & Johnson, Takeda Pharmaceutical Company Limited, AstraZeneca, Bristol Myers Squibb Co., F. Hoffmann-La Roche Ltd., Bayer AG, Astellas Pharma, Accord Healthcare, Actero Pharma, HEC Pharm, Aqvida GmbH, MEDICHEM S.A., Pharco Corporation, Krka, Gedeon Richte

Eu & Mena Generic Oncology Drug Market Market Value Analysis

Metric Value
Europe and MENA Generic Oncology Drug Market Estimated Value in (2025 E) USD 7.0 billion
Europe and MENA Generic Oncology Drug Market Forecast Value in (2035 F) USD 8.5 billion
Forecast CAGR (2025 to 2035) 2.0%

Rationale for Segmental Growth in the Europe and MENA Generic Oncology Drug Market

The Europe and MENA generic oncology drug market is advancing steadily as demand for cost-effective cancer therapies continues to grow. Increasing cancer prevalence, strong emphasis on affordable treatment access, and expanding generic drug approvals are supporting market expansion. Current dynamics reflect pressure on healthcare systems to balance quality outcomes with economic efficiency, leading to rising adoption of generics across oncology treatment pathways.

Regulatory frameworks in both Europe and MENA are fostering generic penetration by streamlining approval processes and encouraging competition. Future growth is expected to be driven by patent expiries of blockbuster drugs, enhanced manufacturing capabilities, and broader distribution networks across emerging economies.

Affordability, availability, and therapeutic equivalence are strengthening confidence among healthcare professionals and patients, while the shift toward oral and targeted therapies is reshaping treatment models The rationale for growth rests on accessibility improvements, healthcare policy alignment, and strategic investment by manufacturers to ensure consistent supply and compliance, all of which are positioning the market for sustained long-term expansion.
Segmental Analysis

Insights into the Molecule Segment

Eu & Mena Generic Oncology Drug Market Analysis By Molecule

The small molecule category, holding 61.40% of the molecule segment, has remained the dominant contributor to the market. Its leadership is attributed to wide therapeutic applicability, well-established manufacturing processes, and consistent demand from oncology care providers.

Small molecules offer scalability and cost efficiency in production, which aligns with healthcare priorities for affordable treatment solutions. Regulatory confidence in therapeutic equivalence has further reinforced adoption across Europe and MENA.

Continued availability of generics following patent expiries has strengthened market penetration, while enhanced quality control and distribution reliability have ensured steady supply The segment’s dominance is expected to be maintained as patient populations expand and treatment protocols continue to integrate generics as first-line options in cancer care.
Insights into the Route of Administration Segment

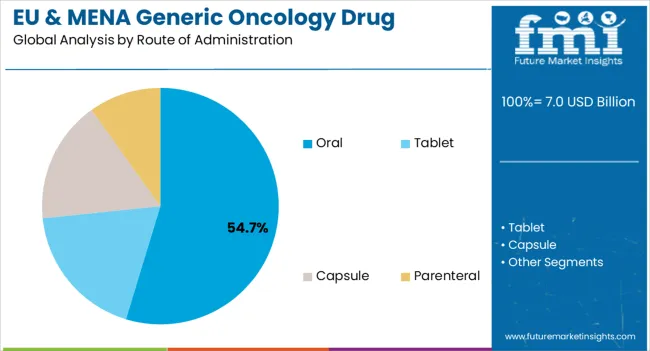
Eu & Mena Generic Oncology Drug Market Analysis By Route Of Administration

The oral route, representing 54.70% of the administration category, has been leading due to patient convenience, reduced hospitalization requirements, and compatibility with outpatient treatment models. Growth has been supported by the increasing number of oral oncology drugs transitioning into generic versions, allowing wider accessibility.

The oral format improves adherence and quality of life for patients, making it a preferred option among prescribers. Regulatory frameworks and clinical guidelines have encouraged integration of oral generics into treatment regimens.

Supply chain efficiencies and expanded retail and hospital pharmacy distribution have reinforced availability The segment is expected to retain its leadership as innovation in oral formulations continues and healthcare providers favor patient-centered, cost-effective delivery models.
Insights into the Distribution Channel Segment

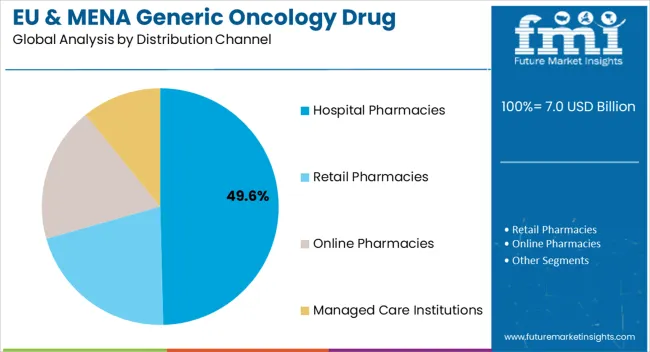
Eu & Mena Generic Oncology Drug Market Analysis By Distribution Channel

The hospital pharmacies segment, accounting for 49.60% of the distribution channel category, has emerged as the primary point of access for generic oncology drugs. Its dominance is driven by established procurement systems, institutional trust, and the ability to ensure regulated handling of oncology medicines.

Hospital pharmacies provide centralized dispensing for both inpatient and outpatient care, ensuring timely and safe access. Partnerships between hospitals and generic drug manufacturers have supported bulk purchasing and consistent supply.

Clinical oversight and integration into hospital treatment protocols have further reinforced preference for this channel With continued investment in hospital infrastructure and the expansion of oncology care centers across Europe and MENA, hospital pharmacies are expected to sustain their market leadership and remain a critical distribution hub for generic oncology drugs.

Europe and MENA Oncology Drug Business Overview

Generic drugs in oncology are providing a new ray of hope to millions of patients suffering from cancer across Europe and MENA. They have become cost-effective alternatives to branded medicines.

Generic oncology drugs are gaining immense popularity across regions such as Europe and MENA. This is due to their several benefits, including cost-effectiveness and high efficiency. The growing adoption of these generic cancer drugs is expected to boost the target business.

Oncology drugs are typically characterized by high costs and limited accessibility for the general public. Cancer treatments can be particularly challenging due to the exorbitant prices of these drugs. However, generic cancer medications provide a crucial solution, offering comparable therapeutic effectiveness at around 80% less than their branded counterparts.

Utilizing generic oncology drugs significantly reduces the financial burden of cancer treatment, ultimately enhancing the prospects of patients receiving more comprehensive care. Sales of generic injectable drugs and off-label medications have played a pivotal role in driving down the overall cost of cancer treatment, making it more manageable for a broader patient population.

Top Generic Oncology Drug Market Dynamics and Industry Trends

  • Low price of generic oncology drug treatments
  • Rising prevalence of cancer will likely drive demand for generic oncology drugs in EU and MENA
  • Escalating demand for low-cost cancer therapeutics in Europe and MENA is set to bolster sales of generic oncology therapeutics
  • Increasing government initiatives to promote generic cancer drugs
  • Surging investments in research and development
  • New product launches and approvals
  • Growing awareness about different cancer types and their treatments
  • Rising development and approval of biosimilars
  • Increasing popularity of specialty generics
  • Expansion of Europe and MENA pharmaceutical industry
  • Innovations in the cancer medication sector
  • Rising interest in generic oncology therapeutics, especially across developing nations of Europe and MENA
  • Increasing investments in European and MENA healthcare sector

Sales Trend Analysis from 2020 to 2025 Compared to Market Outlook for 2025 to 2035

The Europe and MENA generic oncology drug business accounted for around 2.0% of the overall global generic oncology drug space in 2025. The latter was valued at USD 333.5 billion. Over the assessment period, generic oncology drug sales in Europe and MENA are projected to soar at a 2.1% CAGR.

The Europe and MENA regions have experienced significant transformations in the field of generic oncology drugs in recent years. This has opened new growth prospects for generic oncology drug companies, and the trend is expected to continue through 2035.

The MENA region is observing a notable increase in cancer incidence, primarily attributed to factors such as an aging population, lifestyle changes, and improved cancer diagnosis and reporting. This is expected to drive demand for generic drugs in Europe and MENA.

Regulatory authorities in MENA countries are increasingly recognizing the significance of regulating generic oncology drugs to ensure their safety and efficacy. This will likely boost the target business during the forecast period.

Europe’s generic oncology drug landscape, while relatively mature compared to emerging businesses, continues to evolve due to multiple factors. These include patent expirations of branded oncology drugs, healthcare systems' cost containment efforts, and the growing demand for more affordable cancer treatments.

Increasing investments in oncology drug manufacturing and the rise of the biosimilar cancer drug business are expected to create growth prospects for generic oncology drug companies. Similarly, the flourishing anti-cancer generics sector will boost revenue through 2035.

Lucrative Opportunities Driving Demand Growth in the Generic Oncology Drug Market

The availability of cancer drugs has been a persistent concern among patients, often compounded by their high costs. The introduction of generic versions of certain medications faced initial hurdles, with a handful of general practitioners in specific countries encountering legal threats for prescribing generic alternatives still under patent protection.

The landscape, however, has changed significantly with the widespread availability of oral generic oncology drugs, resulting in substantial price reductions of up to 98.8% across Europe. Target prices for several generic oncology drugs were considerably lower than their branded counterparts, with substantial reductions.

For example, the targeted cost for bortezomib was set at USD 499.34 per treatment cycle, dasatinib at USD 10.93 per month, everolimus at USD 1,035 per month, and gefitinib at USD 12.15 per month. In comparison to the prevailing list prices in England, these target prices represented a remarkable reduction of 74% to 99.6%.

The adoption of generic oncology drugs has significantly improved the affordability of cancer treatment. This has led to an enhanced likelihood of patients receiving comprehensive and effective care, addressing both the concerns of drug availability and cost.

Overview of Restrictive Factors for Europe and MENA Generic Oncology Drugs

The impact of pay-for-delay or reverse payment settlements on consumer costs and healthcare accessibility in the pharmaceutical sector has sparked concerns. Under these agreements, manufacturers of brand-name drugs agree not to introduce their approved generics during the exclusivity period in exchange for generic drug makers delaying the release of their less expensive equivalents of the brand-name products. Although the firms involved can perceive this as a good bargain, consumers and the healthcare system will suffer as a result.

The financial strain on consumers is one important outcome. Pay-for-delay contracts essentially prolong the monopoly period of name-brand prescriptions, compelling patients to purchase pricey prescription drugs. These agreements also postpone the release of generic cancer alternatives that are more reasonably priced.

Patients are consequently unable to transfer to equivalently effective but less expensive drugs. Hence, pay-for-delay settlements hurt patients and the healthcare system even though the pharmaceutical corporations implicated can profit from them.

Analysis of Top Countries Regulating,Prescribing,Distributing,and Manufacturing Generic Oncology Drugs

The below table shows the estimated growth rates of the top countries in Europe and MENA. Among these, Libya, Israel, and Sudan are set to exhibit lucrative CAGRs of 9.3%, 8.3%, and 8.8%, respectively, through 2035

Growth Outlook by Key Countries

Countries Value CAGR
United Kingdom 1.5%
Germany 1.9%
France 2.0%
Italy 1.3%
Spain 2.9%
BENELUX 2.7%
Nordics 1.1%
Poland 2.0%
Hungary 2.4%
Romania 2.8%
Czech Republic 2.2%
Rest of Europe 1.3%
Saudi Arabia 2.2%
Egypt 2.7%
Algeria 3.2%
United Arab Emirates 3.7%
Kuwait 4.2%
Jordan 4.7%
Türkiye 5.2%
Iran 5.7%
Morocco 6.3%
Qatar 6.8%
Oman 7.3%
Bahrain 7.8%
Israel 8.3%
Sudan 8.8%
Libya 9.3%
Rest of MENA 9.7%

Expansion of Pharmaceutical Companies in Poland to Boost Growth

Poland occupied 12.2% of the Europe and MENA generic oncology drug business share in 2025. Over the assessment period, Poland’s generic oncology drug business is set to thrive at a 2.0% CAGR, totaling USD 8.5 million by 2035.

Several factors are expected to boost growth in Poland during the forecast period. These include rising awareness of the benefits of generic oncology drugs, the establishment of new pharmaceutical companies, the growing popularity of targeted therapies, and advancements in the cancer treatment drug sector.

The strategic geographical location of Poland in Europe further enhances its attractiveness as a base for pharmaceutical companies seeking access to both Eastern and Western regions. This will positively impact the overall growth of the target business in Poland.

Pharmaceutical companies find Poland attractive because of its commitment to improving its business and research climate. This is demonstrated by its proposed measures, especially in the field of generic oncology medications.

The country is launching new programs and initiatives to improve its business and research climate. These involve creating clusters of high-tech businesses, encouraging commercial and academic collaboration, and providing funding for research & development and public procurement to encourage research.

Poland is projected to become an even more attractive location for pharmaceutical businesses that specialize in generic oncology drugs as long as it keeps investing in innovation and technology. This presents significant prospects for business growth, which will eventually help patients by expanding access to high-quality, reasonably priced oncology treatments.

Rising Prevalence of Cancer Driving Demand in the United Kingdom

The United Kingdom’s generic oncology drug business size is predicted to reach USD 906.54 million by 2035. Over the forecast period, demand for generic oncology drugs in the United Kingdom is expected to rise at a 1.5% CAGR.

Increasing cancer incidence is a primary factor expected to fuel sales of generic oncology drugs in the United Kingdom. Similarly, the growing popularity of biosimilars, favorable government, and rising awareness about the benefits of generic oncology medicines support will likely boost the target business.

In recent years, there has been a spike in cancer across the United Kingdom. For instance, as per the World Cancer Research Fund, around 387,820 cases of cancer were diagnosed in the United Kingdom in 2020. This rise in cancer cases is expected to drive demand for generic oncology drugs.

In the United Kingdom, generic producers are aggressively pursuing opportunities in this evolving landscape. They aim to capture a significant share by offering affordable alternatives to these soon-to-be off-patent drugs, including generic oncology medications.

Growing Popularity of Super Generics Boosting Demand in Germany

In 2025, Germany held a significant share of the Europe and MENA generic oncology drug business, with a valuation of USD 617.0 million. For the projection period, a CAGR of 1.9% has been predicted for Germany. By 2035, total generic oncology drug revenue in Germany is set to reach USD 762.27 million.

Multiple factors are expected to drive growth in Germany through 2035. These include rising demand for generic cancer drugs due to their affordability and safety, surging popularity of super generics, and increasing cases of cancer.

Germany, an established country for generic oncology drugs, combines cutting-edge innovation, a rich tradition as the ‘world's pharmacy,’ and a consistently growing demand for healthcare products. With a strong emphasis on pharmaceutical research and development, production, and sales of medicines, the country is set to observe steady growth.

Germany is striving to advance in cancer diagnostics and treatment. For instance, declaring the upcoming ten years to be the ‘National Decade against Cancer,’ the Federal Ministry for Education and Research started implementing plans to give oncology research top priority. This will bode well for the target business.

Generic Oncology Drug Industry Analysis by Top Investment Segments

The below section shows the small molecule segment dominating, based on the molecule. It is forecast to thrive at 1.9% CAGR between 2025 and 2035. By route of administration, the oral segment is expected to generate significant revenue in Europe and MENA. It will likely exhibit a CAGR of 1.5% through 2035. Based on the distribution channel, the retail pharmacies segment is set to lead the target business, thriving at a 1.6% CAGR.

Demand Remains High for Small Molecule Oncology Drugs

Growth Outlook by Key Molecule

Molecule Value CAGR
Large Molecule 2.6%
Small Molecule 1.9%

Based on the molecule, the small molecule segment held a 73.1% value share in Europe and MENA in 2025, and it will likely retain its dominance through 2035. Demand for small-molecule cancer drugs is predicted to rise at a CAGR of around 1.9% during the assessment period.

Small molecule generic oncology drugs are gaining attention and hold an impressive share due to their cost-effectiveness in manufacturing than biologics. This can help reduce the overall cost of cancer treatment.

Small molecule drugs are easy to manufacture and can be administered orally. This is further making them popular and fueling their demand across regions such as Europe and MENA. Also, their molecular size and complexity enable them to reach target sites easily, resulting in high drug efficacy.

To meet this demand and boost their revenue, key generic oncology drug manufacturers are expected to introduce new small molecule generic cancer drugs through 2035. They will also benefit from the expanding small-molecule injectable business.

Convenience of Oral Medication Making it Highly Popular

Growth Outlook by Key Route of Administration

Route of Administration Value CAGR
Oral 1.5%
Tablet 1.3%
Capsule 1.9%
Parenteral 2.7%

By route of administration, the oral segment held a 54.3% value share in Europe and MENA business at the end of 2025. In the assessment period, the target segment is anticipated to progress at a CAGR of 1.5%.

Oral medication remains the preferable route of drug administration across Europe and MENA. This is because of its advantages, such as better convenience and inexpensive nature.

Oral medications tend to be more readily accepted by patients, which promotes greater adherence to prescribed treatment regimens, ultimately leading to improved health outcomes. As a result, they are in greater demand across regions such as Europe and MENA.

Oral anti-cancer drugs are generally less invasive and cost-effective than parenteral cancer drugs. These advantages are expected to encourage the adoption of oral generic oncology drugs during the forecast period, thereby boosting the target segment.

Retail Pharmacies Remain Preferred Distribution Channel

Growth Outlook by Key Distribution Channel

Distribution Channel Value CAGR
Hospitals Pharmacies 2.2%
Retail Pharmacies 1.6%
Online Pharmacies 3.4%
Managed Care Institutions 4.2%

As per the latest generic oncology drug industry analysis, retail pharmacies remain the most preferred distribution channel for generic oncology drugs across Europe and MENA. The target segment accounted for a revenue share of 60.1% of the total value in 2025.

Over the forecast period, the retail pharmacies segment is expected to demonstrate steady growth with a CAGR of 1.6%. This can be attributed to the rising inclination of cancer patients toward purchasing generic oncology drugs from retail stores.

Retail pharmacies provide a diverse selection of generic alternatives, empowering consumers to reduce their healthcare costs. Moreover, across several nations in Europe, pharmacists are granted the authority to replace brand-name prescriptions with generic counterparts when they are accessible unless a healthcare provider specifies otherwise.

Key Generic Oncology Drug Market Players and Concentration

The Europe and MENA generic oncology drug business landscape has evolved into a fiercely competitive arena, with several manufacturers of generic oncology drugs competing for dominance. In their quest for a competitive edge, these stakeholders are actively involved in strategic endeavors. These initiatives encompass new product launches, regulatory approvals, collaborations with healthcare institutions, and the development of combination therapy approaches.

Recent Developments in the Europe and MENA Generic Oncology Drug Business-

  • In March 2025, Regeneron Pharmaceuticals, Inc. reported that the European Commission (EC) granted approval for the use of Libtayo (cemiplimab) in combination with platinum-based chemotherapy.
  • In September 2025, the Committee for Medicinal Products for Human Use (CHMP) and the European Medicines Agency (EMA) jointly issued a favorable recommendation for the approval of marketing authorization for Sorafenib Accord. This medication is specifically developed for the treatment of hepatocellular and renal cell carcinoma.

Key Shifting Preferences Covered in Generic Oncology Drug Market Report

Attribute Details
Estimated Value (2025) USD 7.0 billion
Projected Value (2035) USD 8.5 billion
Anticipated Growth Rate (2025 to 2035) 2.0% CAGR
Forecast Period 2025 to 2035
Historical Data Available for 2020 to 2025
Industry Analysis USD billion for Value
Key Regions Covered Europe; and Middle East; and North Africa
Key Countries Covered United Kingdom, Germany, France, Italy, Spain, BENELUX, Nordics, Poland, Hungary, Romania, Czech Republic, Rest of Europe, Saudi Arabia, Egypt, Algeria, United Arab Emirates, Kuwait, Jordan, Türkiye, Iran, Morocco, Qatar, Oman, Bahrain, Israel, Sudan, Libya, rest of Middle East and Africa
Key Segments Covered Molecule, Route of Administration, Distribution Channel, and Region
Key Companies Profiled Cipla; Eli Lilly & Co.; GlaxoSmithKline Plc.; Sanofi S.A.; Teva Pharmaceutical Industries Ltd.; Sun Pharmaceutical Industries Ltd.; Lupin Ltd.; Hikma Pharmaceuticals PLC; Viatris Inc. (Mylan N.V); Johnson & Johnson; Takeda Pharmaceutical Company Limited; AstraZeneca; Bristol Myers Squibb Co.; F.Hoffmann-La Roche Ltd.; Bayer AG; Astellas Pharma; Accord Healthcare; Actero Pharma; HEC Pharm; Aqvida GmbH; MEDICHEM S.A.; Pharco Corporation; Krka; Gedeon Richte
Report Coverage Business Forecast, Competition Intelligence, Key Dynamics and Challenges, Strategic Growth Initiatives

Top Segments Studied in the Generic Oncology Drug Market Report

By Molecule:

  • Large Molecule
  • Small Molecule

By Route of Administration:

  • Oral
    • Tablet
    • Capsule
  • Parenteral

By Distribution Channel:

  • Hospital Pharmacies
  • Retail Pharmacies
  • Online Pharmacies
  • Managed Care Institutions

By Region:

  • Europe
    • United Kingdom
    • Germany
    • France
    • Italy
    • Spain
    • BENELUX
    • Nordics
    • Poland
    • Hungary
    • Romania
    • Czech Republic
    • Rest of Europe
  • Middle East and North Africa
    • Saudi Arabia
    • Egypt
    • Algeria
    • United Arab Emirates
    • Kuwait
    • Jordan
    • Türkiye
    • Iran
    • Morocco
    • Qatar
    • Oman
    • Bahrain
    • Israel
    • Sudan
    • Libya
    • Rest of MENA

Frequently Asked Questions

How big is the Europe and MENA generic oncology drug market in 2025?

The global Europe and MENA generic oncology drug market is estimated to be valued at USD 7.0 billion in 2025.

What will be the size of Europe and MENA generic oncology drug market in 2035?

The market size for the Europe and MENA generic oncology drug market is projected to reach USD 8.5 billion by 2035.

How much will be the Europe and MENA generic oncology drug market growth between 2025 and 2035?

The Europe and MENA generic oncology drug market is expected to grow at a 2.0% CAGR between 2025 and 2035.

What are the key product types in the Europe and MENA generic oncology drug market?

The key product types in Europe and MENA generic oncology drug market are small molecule and large molecule.

Which route of administration segment to contribute significant share in the Europe and MENA generic oncology drug market in 2025?

In terms of route of administration, oral segment to command 54.7% share in the Europe and MENA generic oncology drug market in 2025.

Table of Content

  1. Executive Summary
    • Global Market Outlook
    • Demand-side Trends
    • Supply-side Trends
    • Technology Roadmap Analysis
    • Analysis and Recommendations
  2. Market Overview
    • Market Coverage / Taxonomy
    • Market Definition / Scope / Limitations
  3. Market Background
    • Market Dynamics
      • Drivers
      • Restraints
      • Opportunity
      • Trends
    • Scenario Forecast
      • Demand in Optimistic Scenario
      • Demand in Likely Scenario
      • Demand in Conservative Scenario
    • Opportunity Map Analysis
    • Product Life Cycle Analysis
    • Supply Chain Analysis
    • Investment Feasibility Matrix
    • Value Chain Analysis
    • PESTLE and Porter’s Analysis
    • Regulatory Landscape
    • Regional Parent Market Outlook
    • Production and Consumption Statistics
    • Import and Export Statistics
  4. Global Market Analysis 2020 to 2024 and Forecast, 2025 to 2035
    • Historical Market Size Value (USD Million) Analysis, 2020 to 2024
    • Current and Future Market Size Value (USD Million) Projections, 2025 to 2035
      • Y-o-Y Growth Trend Analysis
      • Absolute $ Opportunity Analysis
  5. Global Market Pricing Analysis 2020 to 2024 and Forecast 2025 to 2035
  6. Global Market Analysis 2020 to 2024 and Forecast 2025 to 2035, By Molecule
    • Introduction / Key Findings
    • Historical Market Size Value (USD Million) Analysis By Molecule , 2020 to 2024
    • Current and Future Market Size Value (USD Million) Analysis and Forecast By Molecule , 2025 to 2035
      • Small Molecule
      • Large Molecule
    • Y-o-Y Growth Trend Analysis By Molecule , 2020 to 2024
    • Absolute $ Opportunity Analysis By Molecule , 2025 to 2035
  7. Global Market Analysis 2020 to 2024 and Forecast 2025 to 2035, By Route of Administration
    • Introduction / Key Findings
    • Historical Market Size Value (USD Million) Analysis By Route of Administration, 2020 to 2024
    • Current and Future Market Size Value (USD Million) Analysis and Forecast By Route of Administration, 2025 to 2035
      • Oral
      • Tablet
      • Capsule
      • Parenteral
    • Y-o-Y Growth Trend Analysis By Route of Administration, 2020 to 2024
    • Absolute $ Opportunity Analysis By Route of Administration, 2025 to 2035
  8. Global Market Analysis 2020 to 2024 and Forecast 2025 to 2035, By Distribution Channel
    • Introduction / Key Findings
    • Historical Market Size Value (USD Million) Analysis By Distribution Channel, 2020 to 2024
    • Current and Future Market Size Value (USD Million) Analysis and Forecast By Distribution Channel, 2025 to 2035
      • Hospital Pharmacies
      • Retail Pharmacies
      • Online Pharmacies
      • Managed Care Institutions
    • Y-o-Y Growth Trend Analysis By Distribution Channel, 2020 to 2024
    • Absolute $ Opportunity Analysis By Distribution Channel, 2025 to 2035
  9. Global Market Analysis 2020 to 2024 and Forecast 2025 to 2035, By Region
    • Introduction
    • Historical Market Size Value (USD Million) Analysis By Region, 2020 to 2024
    • Current Market Size Value (USD Million) Analysis and Forecast By Region, 2025 to 2035
      • North America
      • Latin America
      • Western Europe
      • Eastern Europe
      • East Asia
      • South Asia and Pacific
      • Middle East & Africa
    • Market Attractiveness Analysis By Region
  10. North America Market Analysis 2020 to 2024 and Forecast 2025 to 2035, By Country
    • Historical Market Size Value (USD Million) Trend Analysis By Market Taxonomy, 2020 to 2024
    • Market Size Value (USD Million) Forecast By Market Taxonomy, 2025 to 2035
      • By Country
        • USA
        • Canada
        • Mexico
      • By Molecule
      • By Route of Administration
      • By Distribution Channel
    • Market Attractiveness Analysis
      • By Country
      • By Molecule
      • By Route of Administration
      • By Distribution Channel
    • Key Takeaways
  11. Latin America Market Analysis 2020 to 2024 and Forecast 2025 to 2035, By Country
    • Historical Market Size Value (USD Million) Trend Analysis By Market Taxonomy, 2020 to 2024
    • Market Size Value (USD Million) Forecast By Market Taxonomy, 2025 to 2035
      • By Country
        • Brazil
        • Chile
        • Rest of Latin America
      • By Molecule
      • By Route of Administration
      • By Distribution Channel
    • Market Attractiveness Analysis
      • By Country
      • By Molecule
      • By Route of Administration
      • By Distribution Channel
    • Key Takeaways
  12. Western Europe Market Analysis 2020 to 2024 and Forecast 2025 to 2035, By Country
    • Historical Market Size Value (USD Million) Trend Analysis By Market Taxonomy, 2020 to 2024
    • Market Size Value (USD Million) Forecast By Market Taxonomy, 2025 to 2035
      • By Country
        • Germany
        • UK
        • Italy
        • Spain
        • France
        • Nordic
        • BENELUX
        • Rest of Western Europe
      • By Molecule
      • By Route of Administration
      • By Distribution Channel
    • Market Attractiveness Analysis
      • By Country
      • By Molecule
      • By Route of Administration
      • By Distribution Channel
    • Key Takeaways
  13. Eastern Europe Market Analysis 2020 to 2024 and Forecast 2025 to 2035, By Country
    • Historical Market Size Value (USD Million) Trend Analysis By Market Taxonomy, 2020 to 2024
    • Market Size Value (USD Million) Forecast By Market Taxonomy, 2025 to 2035
      • By Country
        • Russia
        • Poland
        • Hungary
        • Balkan & Baltic
        • Rest of Eastern Europe
      • By Molecule
      • By Route of Administration
      • By Distribution Channel
    • Market Attractiveness Analysis
      • By Country
      • By Molecule
      • By Route of Administration
      • By Distribution Channel
    • Key Takeaways
  14. East Asia Market Analysis 2020 to 2024 and Forecast 2025 to 2035, By Country
    • Historical Market Size Value (USD Million) Trend Analysis By Market Taxonomy, 2020 to 2024
    • Market Size Value (USD Million) Forecast By Market Taxonomy, 2025 to 2035
      • By Country
        • China
        • Japan
        • South Korea
      • By Molecule
      • By Route of Administration
      • By Distribution Channel
    • Market Attractiveness Analysis
      • By Country
      • By Molecule
      • By Route of Administration
      • By Distribution Channel
    • Key Takeaways
  15. South Asia and Pacific Market Analysis 2020 to 2024 and Forecast 2025 to 2035, By Country
    • Historical Market Size Value (USD Million) Trend Analysis By Market Taxonomy, 2020 to 2024
    • Market Size Value (USD Million) Forecast By Market Taxonomy, 2025 to 2035
      • By Country
        • India
        • ASEAN
        • Australia & New Zealand
        • Rest of South Asia and Pacific
      • By Molecule
      • By Route of Administration
      • By Distribution Channel
    • Market Attractiveness Analysis
      • By Country
      • By Molecule
      • By Route of Administration
      • By Distribution Channel
    • Key Takeaways
  16. Middle East & Africa Market Analysis 2020 to 2024 and Forecast 2025 to 2035, By Country
    • Historical Market Size Value (USD Million) Trend Analysis By Market Taxonomy, 2020 to 2024
    • Market Size Value (USD Million) Forecast By Market Taxonomy, 2025 to 2035
      • By Country
        • Kingdom of Saudi Arabia
        • Other GCC Countries
        • Turkiye
        • South Africa
        • Other African Union
        • Rest of Middle East & Africa
      • By Molecule
      • By Route of Administration
      • By Distribution Channel
    • Market Attractiveness Analysis
      • By Country
      • By Molecule
      • By Route of Administration
      • By Distribution Channel
    • Key Takeaways
  17. Key Countries Market Analysis
    • USA
      • Pricing Analysis
      • Market Share Analysis, 2024
        • By Molecule
        • By Route of Administration
        • By Distribution Channel
    • Canada
      • Pricing Analysis
      • Market Share Analysis, 2024
        • By Molecule
        • By Route of Administration
        • By Distribution Channel
    • Mexico
      • Pricing Analysis
      • Market Share Analysis, 2024
        • By Molecule
        • By Route of Administration
        • By Distribution Channel
    • Brazil
      • Pricing Analysis
      • Market Share Analysis, 2024
        • By Molecule
        • By Route of Administration
        • By Distribution Channel
    • Chile
      • Pricing Analysis
      • Market Share Analysis, 2024
        • By Molecule
        • By Route of Administration
        • By Distribution Channel
    • Germany
      • Pricing Analysis
      • Market Share Analysis, 2024
        • By Molecule
        • By Route of Administration
        • By Distribution Channel
    • UK
      • Pricing Analysis
      • Market Share Analysis, 2024
        • By Molecule
        • By Route of Administration
        • By Distribution Channel
    • Italy
      • Pricing Analysis
      • Market Share Analysis, 2024
        • By Molecule
        • By Route of Administration
        • By Distribution Channel
    • Spain
      • Pricing Analysis
      • Market Share Analysis, 2024
        • By Molecule
        • By Route of Administration
        • By Distribution Channel
    • France
      • Pricing Analysis
      • Market Share Analysis, 2024
        • By Molecule
        • By Route of Administration
        • By Distribution Channel
    • India
      • Pricing Analysis
      • Market Share Analysis, 2024
        • By Molecule
        • By Route of Administration
        • By Distribution Channel
    • ASEAN
      • Pricing Analysis
      • Market Share Analysis, 2024
        • By Molecule
        • By Route of Administration
        • By Distribution Channel
    • Australia & New Zealand
      • Pricing Analysis
      • Market Share Analysis, 2024
        • By Molecule
        • By Route of Administration
        • By Distribution Channel
    • China
      • Pricing Analysis
      • Market Share Analysis, 2024
        • By Molecule
        • By Route of Administration
        • By Distribution Channel
    • Japan
      • Pricing Analysis
      • Market Share Analysis, 2024
        • By Molecule
        • By Route of Administration
        • By Distribution Channel
    • South Korea
      • Pricing Analysis
      • Market Share Analysis, 2024
        • By Molecule
        • By Route of Administration
        • By Distribution Channel
    • Russia
      • Pricing Analysis
      • Market Share Analysis, 2024
        • By Molecule
        • By Route of Administration
        • By Distribution Channel
    • Poland
      • Pricing Analysis
      • Market Share Analysis, 2024
        • By Molecule
        • By Route of Administration
        • By Distribution Channel
    • Hungary
      • Pricing Analysis
      • Market Share Analysis, 2024
        • By Molecule
        • By Route of Administration
        • By Distribution Channel
    • Kingdom of Saudi Arabia
      • Pricing Analysis
      • Market Share Analysis, 2024
        • By Molecule
        • By Route of Administration
        • By Distribution Channel
    • Turkiye
      • Pricing Analysis
      • Market Share Analysis, 2024
        • By Molecule
        • By Route of Administration
        • By Distribution Channel
    • South Africa
      • Pricing Analysis
      • Market Share Analysis, 2024
        • By Molecule
        • By Route of Administration
        • By Distribution Channel
  18. Market Structure Analysis
    • Competition Dashboard
    • Competition Benchmarking
    • Market Share Analysis of Top Players
      • By Regional
      • By Molecule
      • By Route of Administration
      • By Distribution Channel
  19. Competition Analysis
    • Competition Deep Dive
      • Teva Pharmaceutical Industries Ltd.
        • Overview
        • Product Portfolio
        • Profitability by Market Segments (Product/Age /Sales Channel/Region)
        • Sales Footprint
        • Strategy Overview
          • Marketing Strategy
          • Product Strategy
          • Channel Strategy
      • Cipla
      • Eli Lilly & Co.
      • GlaxoSmithKline Plc.
      • Sanofi S.A.
      • Sun Pharmaceutical Industries Ltd.
      • Lupin Ltd.
      • Hikma Pharmaceuticals PLC
      • Viatris Inc. (Mylan N.V)
      • Johnson & Johnson
      • Takeda Pharmaceutical Company Limited
      • AstraZeneca
      • Bristol Myers Squibb Co.
      • F. Hoffmann-La Roche Ltd.
      • Bayer AG
      • Astellas Pharma
      • Accord Healthcare
      • Actero Pharma
      • HEC Pharm
      • Aqvida GmbH
  20. Assumptions & Acronyms Used
  21. Research Methodology

List of Tables

  • Table 1: Global Market Value (USD Million) Forecast by Region, 2020-2035
  • Table 2: Global Market Value (USD Million) Forecast by Molecule , 2020-2035
  • Table 3: Global Market Value (USD Million) Forecast by Route of Administration, 2020-2035
  • Table 4: Global Market Value (USD Million) Forecast by Distribution Channel, 2020-2035
  • Table 5: North America Market Value (USD Million) Forecast by Country, 2020-2035
  • Table 6: North America Market Value (USD Million) Forecast by Molecule , 2020-2035
  • Table 7: North America Market Value (USD Million) Forecast by Route of Administration, 2020-2035
  • Table 8: North America Market Value (USD Million) Forecast by Distribution Channel, 2020-2035
  • Table 9: Latin America Market Value (USD Million) Forecast by Country, 2020-2035
  • Table 10: Latin America Market Value (USD Million) Forecast by Molecule , 2020-2035
  • Table 11: Latin America Market Value (USD Million) Forecast by Route of Administration, 2020-2035
  • Table 12: Latin America Market Value (USD Million) Forecast by Distribution Channel, 2020-2035
  • Table 13: Western Europe Market Value (USD Million) Forecast by Country, 2020-2035
  • Table 14: Western Europe Market Value (USD Million) Forecast by Molecule , 2020-2035
  • Table 15: Western Europe Market Value (USD Million) Forecast by Route of Administration, 2020-2035
  • Table 16: Western Europe Market Value (USD Million) Forecast by Distribution Channel, 2020-2035
  • Table 17: Eastern Europe Market Value (USD Million) Forecast by Country, 2020-2035
  • Table 18: Eastern Europe Market Value (USD Million) Forecast by Molecule , 2020-2035
  • Table 19: Eastern Europe Market Value (USD Million) Forecast by Route of Administration, 2020-2035
  • Table 20: Eastern Europe Market Value (USD Million) Forecast by Distribution Channel, 2020-2035
  • Table 21: East Asia Market Value (USD Million) Forecast by Country, 2020-2035
  • Table 22: East Asia Market Value (USD Million) Forecast by Molecule , 2020-2035
  • Table 23: East Asia Market Value (USD Million) Forecast by Route of Administration, 2020-2035
  • Table 24: East Asia Market Value (USD Million) Forecast by Distribution Channel, 2020-2035
  • Table 25: South Asia and Pacific Market Value (USD Million) Forecast by Country, 2020-2035
  • Table 26: South Asia and Pacific Market Value (USD Million) Forecast by Molecule , 2020-2035
  • Table 27: South Asia and Pacific Market Value (USD Million) Forecast by Route of Administration, 2020-2035
  • Table 28: South Asia and Pacific Market Value (USD Million) Forecast by Distribution Channel, 2020-2035
  • Table 29: Middle East & Africa Market Value (USD Million) Forecast by Country, 2020-2035
  • Table 30: Middle East & Africa Market Value (USD Million) Forecast by Molecule , 2020-2035
  • Table 31: Middle East & Africa Market Value (USD Million) Forecast by Route of Administration, 2020-2035
  • Table 32: Middle East & Africa Market Value (USD Million) Forecast by Distribution Channel, 2020-2035

List of Figures

  • Figure 1: Global Market Pricing Analysis
  • Figure 2: Global Market Value (USD Million) Forecast 2020-2035
  • Figure 3: Global Market Value Share and BPS Analysis by Molecule , 2025 and 2035
  • Figure 4: Global Market Y-o-Y Growth Comparison by Molecule , 2025-2035
  • Figure 5: Global Market Attractiveness Analysis by Molecule
  • Figure 6: Global Market Value Share and BPS Analysis by Route of Administration, 2025 and 2035
  • Figure 7: Global Market Y-o-Y Growth Comparison by Route of Administration, 2025-2035
  • Figure 8: Global Market Attractiveness Analysis by Route of Administration
  • Figure 9: Global Market Value Share and BPS Analysis by Distribution Channel, 2025 and 2035
  • Figure 10: Global Market Y-o-Y Growth Comparison by Distribution Channel, 2025-2035
  • Figure 11: Global Market Attractiveness Analysis by Distribution Channel
  • Figure 12: Global Market Value (USD Million) Share and BPS Analysis by Region, 2025 and 2035
  • Figure 13: Global Market Y-o-Y Growth Comparison by Region, 2025-2035
  • Figure 14: Global Market Attractiveness Analysis by Region
  • Figure 15: North America Market Incremental Dollar Opportunity, 2025-2035
  • Figure 16: Latin America Market Incremental Dollar Opportunity, 2025-2035
  • Figure 17: Western Europe Market Incremental Dollar Opportunity, 2025-2035
  • Figure 18: Eastern Europe Market Incremental Dollar Opportunity, 2025-2035
  • Figure 19: East Asia Market Incremental Dollar Opportunity, 2025-2035
  • Figure 20: South Asia and Pacific Market Incremental Dollar Opportunity, 2025-2035
  • Figure 21: Middle East & Africa Market Incremental Dollar Opportunity, 2025-2035
  • Figure 22: North America Market Value Share and BPS Analysis by Country, 2025 and 2035
  • Figure 23: North America Market Value Share and BPS Analysis by Molecule , 2025 and 2035
  • Figure 24: North America Market Y-o-Y Growth Comparison by Molecule , 2025-2035
  • Figure 25: North America Market Attractiveness Analysis by Molecule
  • Figure 26: North America Market Value Share and BPS Analysis by Route of Administration, 2025 and 2035
  • Figure 27: North America Market Y-o-Y Growth Comparison by Route of Administration, 2025-2035
  • Figure 28: North America Market Attractiveness Analysis by Route of Administration
  • Figure 29: North America Market Value Share and BPS Analysis by Distribution Channel, 2025 and 2035
  • Figure 30: North America Market Y-o-Y Growth Comparison by Distribution Channel, 2025-2035
  • Figure 31: North America Market Attractiveness Analysis by Distribution Channel
  • Figure 32: Latin America Market Value Share and BPS Analysis by Country, 2025 and 2035
  • Figure 33: Latin America Market Value Share and BPS Analysis by Molecule , 2025 and 2035
  • Figure 34: Latin America Market Y-o-Y Growth Comparison by Molecule , 2025-2035
  • Figure 35: Latin America Market Attractiveness Analysis by Molecule
  • Figure 36: Latin America Market Value Share and BPS Analysis by Route of Administration, 2025 and 2035
  • Figure 37: Latin America Market Y-o-Y Growth Comparison by Route of Administration, 2025-2035
  • Figure 38: Latin America Market Attractiveness Analysis by Route of Administration
  • Figure 39: Latin America Market Value Share and BPS Analysis by Distribution Channel, 2025 and 2035
  • Figure 40: Latin America Market Y-o-Y Growth Comparison by Distribution Channel, 2025-2035
  • Figure 41: Latin America Market Attractiveness Analysis by Distribution Channel
  • Figure 42: Western Europe Market Value Share and BPS Analysis by Country, 2025 and 2035
  • Figure 43: Western Europe Market Value Share and BPS Analysis by Molecule , 2025 and 2035
  • Figure 44: Western Europe Market Y-o-Y Growth Comparison by Molecule , 2025-2035
  • Figure 45: Western Europe Market Attractiveness Analysis by Molecule
  • Figure 46: Western Europe Market Value Share and BPS Analysis by Route of Administration, 2025 and 2035
  • Figure 47: Western Europe Market Y-o-Y Growth Comparison by Route of Administration, 2025-2035
  • Figure 48: Western Europe Market Attractiveness Analysis by Route of Administration
  • Figure 49: Western Europe Market Value Share and BPS Analysis by Distribution Channel, 2025 and 2035
  • Figure 50: Western Europe Market Y-o-Y Growth Comparison by Distribution Channel, 2025-2035
  • Figure 51: Western Europe Market Attractiveness Analysis by Distribution Channel
  • Figure 52: Eastern Europe Market Value Share and BPS Analysis by Country, 2025 and 2035
  • Figure 53: Eastern Europe Market Value Share and BPS Analysis by Molecule , 2025 and 2035
  • Figure 54: Eastern Europe Market Y-o-Y Growth Comparison by Molecule , 2025-2035
  • Figure 55: Eastern Europe Market Attractiveness Analysis by Molecule
  • Figure 56: Eastern Europe Market Value Share and BPS Analysis by Route of Administration, 2025 and 2035
  • Figure 57: Eastern Europe Market Y-o-Y Growth Comparison by Route of Administration, 2025-2035
  • Figure 58: Eastern Europe Market Attractiveness Analysis by Route of Administration
  • Figure 59: Eastern Europe Market Value Share and BPS Analysis by Distribution Channel, 2025 and 2035
  • Figure 60: Eastern Europe Market Y-o-Y Growth Comparison by Distribution Channel, 2025-2035
  • Figure 61: Eastern Europe Market Attractiveness Analysis by Distribution Channel
  • Figure 62: East Asia Market Value Share and BPS Analysis by Country, 2025 and 2035
  • Figure 63: East Asia Market Value Share and BPS Analysis by Molecule , 2025 and 2035
  • Figure 64: East Asia Market Y-o-Y Growth Comparison by Molecule , 2025-2035
  • Figure 65: East Asia Market Attractiveness Analysis by Molecule
  • Figure 66: East Asia Market Value Share and BPS Analysis by Route of Administration, 2025 and 2035
  • Figure 67: East Asia Market Y-o-Y Growth Comparison by Route of Administration, 2025-2035
  • Figure 68: East Asia Market Attractiveness Analysis by Route of Administration
  • Figure 69: East Asia Market Value Share and BPS Analysis by Distribution Channel, 2025 and 2035
  • Figure 70: East Asia Market Y-o-Y Growth Comparison by Distribution Channel, 2025-2035
  • Figure 71: East Asia Market Attractiveness Analysis by Distribution Channel
  • Figure 72: South Asia and Pacific Market Value Share and BPS Analysis by Country, 2025 and 2035
  • Figure 73: South Asia and Pacific Market Value Share and BPS Analysis by Molecule , 2025 and 2035
  • Figure 74: South Asia and Pacific Market Y-o-Y Growth Comparison by Molecule , 2025-2035
  • Figure 75: South Asia and Pacific Market Attractiveness Analysis by Molecule
  • Figure 76: South Asia and Pacific Market Value Share and BPS Analysis by Route of Administration, 2025 and 2035
  • Figure 77: South Asia and Pacific Market Y-o-Y Growth Comparison by Route of Administration, 2025-2035
  • Figure 78: South Asia and Pacific Market Attractiveness Analysis by Route of Administration
  • Figure 79: South Asia and Pacific Market Value Share and BPS Analysis by Distribution Channel, 2025 and 2035
  • Figure 80: South Asia and Pacific Market Y-o-Y Growth Comparison by Distribution Channel, 2025-2035
  • Figure 81: South Asia and Pacific Market Attractiveness Analysis by Distribution Channel
  • Figure 82: Middle East & Africa Market Value Share and BPS Analysis by Country, 2025 and 2035
  • Figure 83: Middle East & Africa Market Value Share and BPS Analysis by Molecule , 2025 and 2035
  • Figure 84: Middle East & Africa Market Y-o-Y Growth Comparison by Molecule , 2025-2035
  • Figure 85: Middle East & Africa Market Attractiveness Analysis by Molecule
  • Figure 86: Middle East & Africa Market Value Share and BPS Analysis by Route of Administration, 2025 and 2035
  • Figure 87: Middle East & Africa Market Y-o-Y Growth Comparison by Route of Administration, 2025-2035
  • Figure 88: Middle East & Africa Market Attractiveness Analysis by Route of Administration
  • Figure 89: Middle East & Africa Market Value Share and BPS Analysis by Distribution Channel, 2025 and 2035
  • Figure 90: Middle East & Africa Market Y-o-Y Growth Comparison by Distribution Channel, 2025-2035
  • Figure 91: Middle East & Africa Market Attractiveness Analysis by Distribution Channel
  • Figure 92: Global Market - Tier Structure Analysis
  • Figure 93: Global Market - Company Share Analysis
Dashboard
Dashboard
Dashboard
Dashboard
Dashboard
Dashboard

Full Research Suite comprises of:

Market outlook & trends analysis

Market outlook & trends analysis

Interviews & case studies

Interviews & case studies

Strategic recommendations

Strategic recommendations

Vendor profiles & capabilities analysis

Vendor profiles & capabilities analysis

5-year forecasts

5-year forecasts

8 regions and 60+ country-level data splits

8 regions and 60+ country-level data splits

Market segment data splits

Market segment data splits

12 months of continuous data updates

12 months of continuous data updates

DELIVERED AS:

PDF EXCEL ONLINE

Full Research Suite


$5000

$7500

$10000

Buy Report Now
Similar Industry Reports

Similar Industry Reports

Europe Massage Therapy Service Market

Europe Massage Therapy Service Market Size and Share Forecast Outlook 2025 to 2035

Europe Cement Market Analysis

Europe Cement Market Analysis Size and Share Forecast Outlook 2025 to 2035

European Union Tourism Industry

European Union Tourism Industry Size and Share Forecast Outlook 2025 to 2035

Europe Injection Molding Machines Market

Europe Injection Molding Machines Market Size and Share Forecast Outlook 2025 to 2035

Europe Injection Moulders Market

Europe Injection Moulders Market Size and Share Forecast Outlook 2025 to 2035

Europe Masking Tapes Market

Europe Masking Tapes Market Size and Share Forecast Outlook 2025 to 2035

Europe Liners Market

Europe Liners Market Size and Share Forecast Outlook 2025 to 2035

Europe Dermal Fillers Market

Europe Dermal Fillers Market Size and Share Forecast Outlook 2025 to 2035

Europe Trolley Bus Market

Europe Trolley Bus Market Size and Share Forecast Outlook 2025 to 2035

Europe Protease Market

Europe Protease Market Size and Share Forecast Outlook 2025 to 2035

Europe Luxury Packaging Market

Europe Luxury Packaging Market Size and Share Forecast Outlook 2025 to 2035

Europe & USA Consumer Electronics Packaging Market

Europe & USA Consumer Electronics Packaging Market Size and Share Forecast Outlook 2025 to 2035

Europe Plant-Based Meal Kit Market

Europe Plant-Based Meal Kit Market Size and Share Forecast Outlook 2025 to 2035

Europe Temperature Controlled Packaging Solutions Market

Europe Temperature Controlled Packaging Solutions Market Size and Share Forecast Outlook 2025 to 2035

Europe Rubber Derived Unrefined Pyrolysis Oil Market

Europe Rubber Derived Unrefined Pyrolysis Oil Market Size and Share Forecast Outlook 2025 to 2035

Europe Pet Food Market

Europe Pet Food Market Analysis by Nature, Product Type, Source, Pet Type, Packaging, Distribution Channel, and Country - Growth, Trends, and Forecast through 2025 to 2035

Europe's Golden Generation Travel Market

Europe's Golden Generation Travel Market Size and Share Forecast Outlook 2025 to 2035

Europe Automotive Night Vision System Market

Europe Automotive Night Vision System Market Size and Share Forecast Outlook 2025 to 2035

Europe Winter Tourism Market

Europe Winter Tourism Market Size and Share Forecast Outlook 2025 to 2035

Europe Bulk Bags Market

Europe Bulk Bags Market Size and Share Forecast Outlook 2025 to 2035

Future Market Insights

Europe and MENA Generic Oncology Drug Market

Chat With MaRIA

Chat With

MaRIA

Hi There, I am MaRIA, Your Market Research Intelligence Assistant. How may I help you?