Reports

- Global Locations -

Headquarters

Future Market Insights, Inc.

Christiana Corporate, 200
Continental Drive, Suite 401,
Newark, Delaware - 19713,
United States

T: +1-845-579-5705

Americas

Future Market Insights, Inc.

616 Corporate Way, Suite 2-9018,
Valley Cottage, NY 10989, United States

T: +1-347-918-3531

MEA

Future Market Insights

1602-6 Jumeirah Bay X2 Tower, Plot No: JLT-PH2-X2A,
Jumeirah Lakes Towers, Dubai,
United Arab Emirates

Europe

Future Market Insights

3rd Floor, 207 Regent Street,
W1B 3HH London
United Kingdom

T: + 44 (0) 20 8123 9659
D: +44 (0) 20 3287 4268

Asia Pacific

Future Market Insights

IndiaLand Global Tech Park, Unit UG-1, Behind Grand HighStreet, Phase 1, Hinjawadi, MH, Pune – 411057, India

Drug Formulation Market Outlook (2022 to 2032)

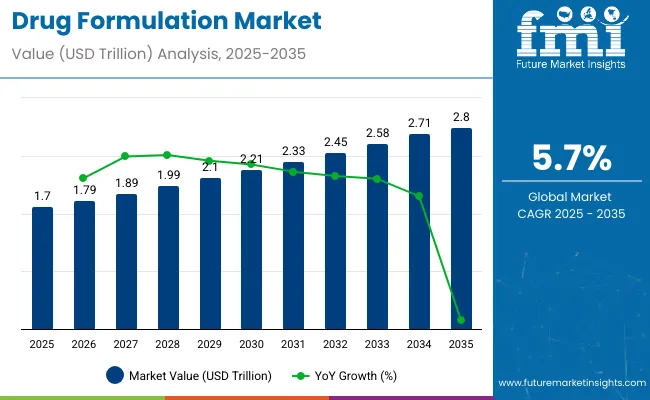
[426 Pages Report] The global demand for drug formulation is expected to increase at 5.6% CAGR over the forecast period from 2022 to 2032. The sales of the drug formulations market are estimated to reach a valuation of US$ 1.58 Trillion by 2022. According to the study, oral formulations projects to grow exponentially with a CAGR of 6.0% during the forecast period.

Market Outlook:

Data Points Market Insights
Drug Formulation Market Value 2021 US$ 1.50 Trillion
Drug Formulation Market Value 2022 US$ 1.58 Trillion
Drug Formulation Market Value 2032 US$ 2.87 Trillion
Drug Formulation Market CAGR 2022 to 2032 5.6%
Market Share of Top 5 Countries 68.4%

Don't pay for what you don't need

Customize your report by selecting specific countries or regions and save 30%!

Sales Analysis of Drug Formulation Market from 2012 to 2021 Vs Demand Outlook for 2022 to 2032

According to Future Market Insights (FMI), the overall sales of drug formulation grew at a CAGR of 5.1% between 2012 and 2021. However, the demand in the drug formulation market is expected to increase at a CAGR of 5.6%, surpassing US$ 2.87 Trillion by the end of 2032.

The pharmaceutical industry has experienced a substantial revolution with the introduction of novel technologies as well as more affordable and cost-effective manufacturing methods. Robotics and artificial intelligence are increasingly being used in the pharmaceutical industry to decrease production waste and downtime on the factory floor. Personalized medicine's continual breakthroughs have also made it feasible to establish patient-centric models by opening up several chances to address a wide range of medical conditions.

In addition, the growing prevalence of the chronic disease among the population, and rising investment flow in this sector are positively driving the market growth. The consumption of pharmaceuticals is also being influenced by the growing world population, which has helped the drug formulation industry rise recently. As a result, the use of antidepressants doubled, consumption of antihypertensive and antidiabetic medications almost doubled, and consumption of cholesterol-lowering medications nearly quadrupled between 2000 and 2015 in Organization for Economic Cooperation and Development (OECD) nations. Increasing the focus on non-communicable diseases (NCDs), such as diabetes and hypertension, which are already widespread in developed nations, while communicable diseases, such as Acquired immunodeficiency syndrome (AIDS), malaria, and tuberculosis, which affect many developing economies, continue to exist.

The global drug formulation market is expected to be valued at US$ 2.87 Trillion by the end of 2032, registering a CAGR of 5.6% in the forecast period.

Drug Formulation Market

What are the Key Opportunities for Drug Formulation Manufacturers?

Until the 20th century, there were relatively limited medicines and treatment options available for chronic diseases like cancer or other rare diseases which indeed projected limited treatment options. However, the growth in research efforts and investment for drug development has projected a positive impact projecting an opportunistic factor for the manufacturers for new drug development in the market. The opportunities are growing because of the increasing advances in molecular biology to develop new agents.

The amount of revenue that pharmaceutical companies anticipate gaining from a new drug, the estimated cost of developing that drug, and laws that affect the supply and demand for drugs also play a role in the amounts of money they invest in research and development (Research and Development). For instance, according to Federal Government Statistics, pharmaceutical businesses invested an average of about 25% of their revenue in Research and Development. In 2019, Top Research and Development spenders 2021 spent close to one-fifth of their income on Research and Development. The pharmaceutical industry is undoubtedly a global one, although US-based businesses often spend the most on Research and Development. Such conditions are anticipated to create lucrative opportunities for local players to reinforce their position and increase their market share over the forecast period.

Sabyasachi Ghosh
Sabyasachi Ghosh

Principal Consultant

Talk to Analyst

Find your sweet spots for generating winning opportunities in this market.

What are the Factors Restraining Demand for Drug Formulation?

Currently, trial and error procedures are used to generate pharmaceutical compositions. This process is a time-consuming method that takes a long time to complete, involving high expenses, and a significant amount of work labors to build and maintain. However, complexity in compliance with the regulatory values would impact the drug development process, if the formulation is unable to comply with the regulatory requirement the repeat process for drug development would negatively impact the pharmaceutical industry economy to a high extent. The pharmaceutical sector is under pressure to lower healthcare costs and the production of new active pharmaceutical ingredients (APIs). Thus this factor expects to restrain the pharmaceutical industries to involve in the drug development process which in turn expects to hamper the market growth.

Additionally, complexity in the supply chain exists to be a restricting factor expected to hamper the drug formulation market growth. Most pharmaceutical companies have a complex supply chain, which is either inefficient or under-utilized. The complexity of the supply chain is due to low flexibility or its cost-effective nature. However, increasing generic competition has dented the profitability of big players and the trend expects to continue over the years. Many pharmaceutical companies have started to reorganize their supply chain in response to changing market structures, but these changes are only meant to address short-term challenges. Along with patent cliffs, the shortening of effective patent life is the major issue in the drug formulation market due to increasing time-to-market and stringent regulations.

Country-wise Insights

Why is the US Considered to be the Largest Market for Drug formulations?

According to Future Market Insights, the US witnessed dominance in the North American drug formulation market, accounting for the highest total market share of 91.3% in 2021, and is projected to continue to exhibit high growth through 2022 & beyond.

The worldwide pharmaceutical market is significantly supported by the US market. Growing Research and Development spending has sped up FDA approvals, which are expected to remain stable until 2021. In 2021, the government approved 50 innovative medications, which was broadly in pace with the approval of 53 drugs the year before.

According to FMI Analysis, US pharmaceutical production and sales are expected to continue strong due to the ongoing global vaccination campaign and the accumulated demand for both necessary and optional medical treatments in 2022.

Why is Germany Considered a Lucrative Market for Drug formulation in Europe?

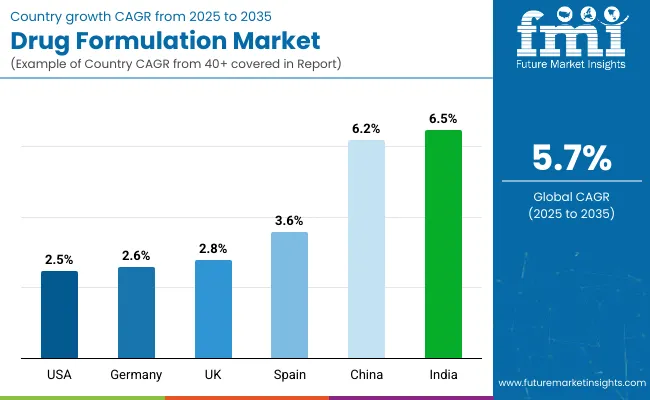
Germany is set to exhibit growth at a CAGR of around 5.2% in the Europe drug formulation market during the forecast period. The German healthcare industry is heavily controlled, and pharmaceutical companies do not face a lot of legal pressure to cut their drug sales prices for final consumers exploring opportunities for new entrance and positive opportunities for the existing manufacturers to invest and develop products in the market. Additionally, the presence of major players like Boehringer Ingelheim International Gmbh, Bayer AG, Merck KGa, Fresenius Kabi, and many more expect to augment the production capacity and make high product availability in the market witnessing the country’s dominance in the Europe market.

What will be the Demand Outlook for the Drug formulation Market in China?

China is projected to expand at a CAGR rate of 7.3% and is anticipated to account the half of the East Asia drug formulation marker revenue valued to reach around US$ 320.7 Billion in 2032.

The pharmaceutical industry in China is also very fragmented; most producers are small and medium-sized businesses. As a result, Research and Development investment is modest in comparison to international competitors. By 2025, the 14th Five-Year Plan wants to raise spending to 10% of sales. Pharmaceutical multinational companies (MNCs) with large market positions include AstraZeneca, Novartis, and Novo Nordisk, each of which held between 8 and 10% of the domestic market share in 2019. Since distribution networks are so important to the industry, domestic pharmaceutical companies like Sinopharm and Shanghai Pharmaceuticals have a firm grip on them. The government has been attempting to consolidate the pharmaceutical business and raise the average size of firms as a result of the industry's fragmentation to assist in quality inspection and improvement.

Major medical reforms have also been implemented in order to advance the development and maturity of China's pharmaceutical industry, in addition to the aforementioned policy changes.

Get the data you need at a Fraction of the cost

Personalize your report by choosing insights you need
and save 40%!

Category-wise Insights

Which Type of Dosage Form is Expected to be Most Preferred in Drug Formulation Market?

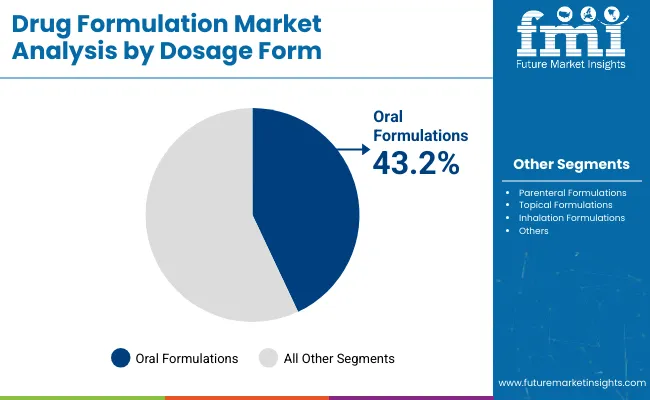
The oral formulation contribute about 42.2% of the market share in 2021 and is expected to register a CAGR of 6.0% in the forecast period. Oral formulations are highly preferred over other dosage forms owing to their advantageous factors, including patient compliance, non-invasiveness, and ease of drug administration.

Which is the Leading Indication in Drug Formulation Market?

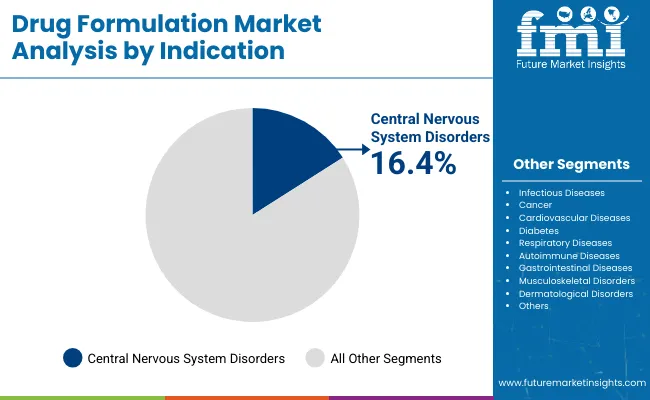
Central Nervous System Disorders are expected to hold more than a 14% market share, exhibiting growth at 3.1% CAGR in the forecast period.

The growing prevalence of central nervous system disorders among the growing population has surged the demand for novel drugs in the market intending to explore opportunities in the market. For instance, the development of novel biologic drugs, such as recombinant proteins or gene therapies, is essential for the treatment of Alzheimer's disease (AD) and the therapy of the aging brain.

How did the big pharma companies influence the drug formulation market growth?

Based on end user, the big pharma companies held the highest market share of 39.9% in 2021 and is poised to expand at a CAGR of 5.1% over the upcoming decade. Big pharma companies with well-structured research and development sector along with high investment in product development and innovation has accelerated the production capacity of novel drug formulations.

Competitive Landscape

Key manufacturers are implementing strategies in the drug formulation market, including mergers and acquisitions and advanced product launches by acquiring approvals. To acquire a competitive edge in the market, the key companies are focusing on collaborating with the research institutes.

  • A definitive merger agreement between Bristol Myers Squibb and Turning Point Therapeutics was signed on June 20, 2022. This acquisition will expand BMS's selection of oncology drugs because Turning Point Therapeutics is a precision oncology company that is still in the clinical development stage.
  • AstraZeneca introduced The Evusheld long-acting antibody combo to the public on March 20, 2022. For the pre-exposure prophylaxis (prevention) of COVID-19 in a sizable population, it has received authorization in Europe.

Report Scope

Attribute Details
Forecast Period 2022 to 2032
Historical Data Available for 2012 to 2021
Market Analysis US$ Billion for Value
Key Regions Covered North America, Latin America, Europe, South Asia, East Asia, Oceania, and Middle East & Africa
Key Countries Covered US, Canada, Brazil, Mexico, Argentina, UK, Germany, France, Italy, Spain, Russia, BENELUX, China, Japan, South Korea, India, Thailand, Indonesia, Malaysia, Australia, New Zealand, North Africa, GCC Countries, Turkey, Egypt, and South Africa
Key Market Segments Covered Dosage form, Indication, End User, and Region
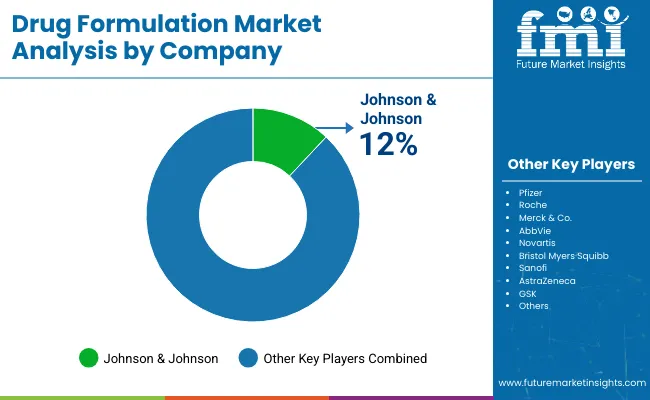
Key Companies Profiled
  • AstraZeneca plc.
  • Bristol-Myers Squibb
  • Eli Lilly and Company
  • Gilead Sciences, Inc.
  • Merck & Co., Inc.
  • Novartis AG
  • Pfizer Inc.
  • AbbVie Inc.
  • Boehringer Ingelheim International GmbH
  • F. Hoffmann-La Roche AG
  • Johnson & Johnson
  • 3M Company
  • Bayer AG
  • Teva Pharmaceuticals Industries Ltd.
  • Amgen, Inc.
  • Sanofi SA
  • GlaxoSmithKline plc
  • Boston Scientific Corporation
  • Gerresheimer AG
  • Nimbus Therapeutics
  • Antares Pharma, Inc.
  • IDEAYA Biosciences, Inc.
Pricing Available upon Request

Key Market Segments Covered in Drug Formulation Industry Research

By Dosage Form:

  • Oral formulations
    • Tablets
      • Immediate Release
      • Modified Release
      • Chewable
      • Effervescent
    • Capsules
      • Hard Gelatin Capsules
      • Softgel Capsules
      • Others
    • Powders & Granules
    • Lozenges & Pastilles
    • Gummies
    • Others
  • Parenteral formulations
    • Solutions
    • Suspensions
    • Emulsions for injection or infusion
    • Powders for injection or infusion
    • Gels for injection implants
  • Topical formulations
    • Pastes
    • Ointments and oils
    • Creams, lotions, and foams.
    • Gels, tinctures, and powders
    • Sprays and patches
  • Inhalation formulations
    • Pressurized Metered Dose Inhaler
    • Dry Powder Inhaler (DPI)
    • Nebulizer

By Indication:

  • Infectious Diseases
  • Cancer
  • Cardiovascular Diseases
  • Diabetes
  • Respiratory Diseases
  • Central Nervous System Disorders
  • Autoimmune Diseases
  • Gastrointestinal Diseases
  • Musculoskeletal Disorders
  • Dermatological Disorders
  • Other

By End User:

  • Big pharma
  • Small & Medium Size Pharma
  • Biotech Companies

By Region:

  • North America
  • Latin America
  • Europe
  • South Asia
  • East Asia
  • Oceania
  • The Middle East and Africa (MEA)

Frequently Asked Questions

How much is the drug formulation market currently worth?

The global drug formulation market is expected to be worth US$ 1.50 Tn in 2021 and is set to expand by 1.8x over the next eleven years.

What is the sales forecast for the drug formulation market through 2032?

The drug formulation market is expected to reach US$ 2.87 Bn by end of 2032, exhibiting growth at a CAGR of 5.6% between 2022 and 2032.

What are the key trends shaping the drug formulation industry?

Key trends influencing the sales in the drug formulation market include a focus on production capacity expansion by implementing an outsourcing strategy, an approach towards advanced manufacturing techniques, expanding product sales through the online platform, and adopting strategic alliances are the emerging trends adopted by the key players.

Which region has the highest market share in the global drug formulation market?

North America is expected to lead the global market, with the U.S. contributing over 91.3% of the revenue share to the regional market in 2022.

Which are the top 5 countries driving demand for Drug Formulations?

The U.S., China, Japan, Germany, and Canada are the top five countries, which are expected to drive demand in the drug formulation market.

Table of Content

1. Executive Summary | Drug Formulation Market

    1.1. Global Market Outlook

    1.2. Demand Side Trends

    1.3. Supply-Side Trends

    1.4. Analysis and Recommendations

2. Market Overview

    2.1. Market Coverage / Taxonomy

    2.2. Market Definition / Scope / Limitations

    2.3. Inclusion and Exclusion

3. Key Market Trends

    3.1. Key Trends Impacting the Market

    3.2. Product Innovation / Development Trends

4. Key Inclusion

    4.1. Product Adoption / Consumption Analysis

    4.2. Key Promotional Strategies, By Manufacturers

    4.3. Disease Epidemiology

    4.4. Pipeline Assessment

    4.5. Regulatory Landscape

    4.6. Reimbursement Outlook

    4.7. PESTLE Analysis

    4.8. Porter’s Analysis

    4.9. Supply Chain Analysis

5. Market Background

    5.1. Macro-Economic Factors

        5.1.1. Global GDP Growth Outlook

        5.1.2. Global Healthcare Industry Market Outlook

        5.1.3. Pharmaceutical Industry Outlook

    5.2. Forecast Factors - Relevance & Impact

        5.2.1. Rise In Incidence of chronic disease

        5.2.2. Growth In Production Capacity

        5.2.3. Increase In Adoption Rate

        5.2.4. Increasing Economic Affluence In Emerging Economies

        5.2.5. Distribution Channel

        5.2.6. Cost Consideration

        5.2.7. Regulatory Scenario

        5.2.8. Growing Geriatric Population

    5.3. Market Dynamics

        5.3.1. Drivers

        5.3.2. Restraints

        5.3.3. Opportunity Analysis

6. COVID-19 Crisis Analysis

    6.1. Current COVID-19 Statistics and Probable Future Impact

    6.2. COVID-19 and Impact Analysis

        6.2.1. Revenue By Dosage Form

        6.2.2. Revenue By Indication

        6.2.3. Revenue By End User

        6.2.4. Revenue By Country

7. Global Drug Formulation Market Demand (in Value US$ Million) Analysis 2012 to 2021 and Forecast, 2022 to 2032

    7.1. Historical Market Value (US$ Million) Analysis, 2012 to 2021

    7.2. Current and Future Market Value (US$ Million) Projections, 2022 to 2032

        7.2.1. Y-o-Y Growth Trend Analysis

        7.2.2. Absolute $ Opportunity Analysis

8. Global Drug Formulation Market Analysis 2012 to 2021 and Forecast 2022 to 2032, By Dosage Form

    8.1. Introduction / Key Findings

    8.2. Historical Market Size (US$ Million) Analysis By Dosage Form, 2012 to 2021

    8.3. Current and Future Market Size (US$ Million) Analysis By Dosage Form, 2022 to 2032

        8.3.1. Oral formulations

            8.3.1.1. Tablets

                8.3.1.1.1. Immediate Release

                8.3.1.1.2. Modified Release

                8.3.1.1.3. Chewable

                8.3.1.1.4. Effervescent

            8.3.1.2. Capsules

                8.3.1.2.1. Hard Gelatin Capsules

                8.3.1.2.2. Softgel Capsules

            8.3.1.3. Powders & Granules

            8.3.1.4. Lozenges & Pastilles

            8.3.1.5. Gummies

            8.3.1.6. Others

        8.3.2. Parenteral formulations

            8.3.2.1. Solutions

            8.3.2.2. Suspensions

            8.3.2.3. Emulsions for injection or infusion

            8.3.2.4. Powders for injection or infusion

            8.3.2.5. Gels for injection implants

        8.3.3. Topical formulations

            8.3.3.1. Pastes

            8.3.3.2. Ointments and oils

            8.3.3.3. Creams, lotions, and foams.

            8.3.3.4. Gels, tinctures, and powders.

            8.3.3.5. Sprays and patches.

        8.3.4. Inhalation formulations

            8.3.4.1. Pressurized Metered Dose Inhaler

            8.3.4.2. Dry Powder Inhaler (DPI)

            8.3.4.3. Nebulizer

    8.4. Market Attractiveness Analysis By Dosage Form

9. Global Drug Formulation Market Analysis 2012 to 2021 and Forecast 2022 to 2032, By Indication

    9.1. Introduction / Key Findings

    9.2. Historical Market Size (US$ Million) Analysis By Indication, 2012 to 2021

    9.3. Current and Future Market Size (US$ Million) Analysis Forecast By Indication, 2022 to 2032

        9.3.1. Infectious Diseases

        9.3.2. Cancer

        9.3.3. Cardiovascular Diseases

        9.3.4. Diabetes

        9.3.5. Respiratory Diseases

        9.3.6. Central Nervous System Disorders

        9.3.7. Autoimmune Diseases

        9.3.8. Gastrointestinal Disease

        9.3.9. Musculoskeletal disorders

        9.3.10. Dermatology disorders

        9.3.11. Others

    9.4. Market Attractiveness Analysis By Indication

10. Global Drug Formulation Market Analysis 2012 to 2021 and Forecast 2022 to 2032, By End User

    10.1. Introduction / Key Findings

    10.2. Historical Market Size (US$ Million) Analysis By End User, 2012 to 2021

    10.3. Current and Future Market Size (US$ Million) Analysis Forecast By End User, 2022 to 2032

        10.3.1. Big pharma

        10.3.2. Small & Medium Size Pharma- Companies

        10.3.3. Biotech Companies

    10.4. Market Attractiveness Analysis By End User

11. Global Drug Formulation Market Analysis 2012 to 2021 and Forecast 2022 to 2032, By Region

    11.1. Introduction

    11.2. Historical Market Size (US$ Million) Analysis By Region, 2012 to 2021

    11.3. Current and Future Market Size (US$ Million) Analysis Forecast By Region, 2022 to 2032

        11.3.1. North America

        11.3.2. Latin America

        11.3.3. Europe

        11.3.4. South Asia

        11.3.5. East Asia

        11.3.6. Oceania

        11.3.7. Middle East & Africa (MEA)

    11.4. Market Attractiveness Analysis By Region

12. North America Drug Formulation Market Analysis 2012 to 2021 and Forecast 2022 to 2032

    12.1. Introduction

    12.2. Historical Market Size (US$ Million) By Market Taxonomy, 2012 to 2021

    12.3. Current and Future Market Size (US$ Million) By Market Taxonomy, 2022 to 2032

        12.3.1. By Country

            12.3.1.1. US

            12.3.1.2. Canada

        12.3.2. By Dosage Form

        12.3.3. By Indication

        12.3.4. By End User

    12.4. Market Attractiveness Analysis

        12.4.1. By Country

        12.4.2. By Dosage Form

        12.4.3. By Indication

        12.4.4. By End User

    12.5. Key Market Participants - Intensity Mapping

    12.6. Country-Level Analysis & Forecast

        12.6.1. U.S. Drug Formulation Market

            12.6.1.1. Introduction

            12.6.1.2. Market Analysis and Forecast By Market Taxonomy

                12.6.1.2.1. By Dosage Form

                12.6.1.2.2. By Indication

                12.6.1.2.3. By End User

        12.6.2. Canada Drug Formulation Market

            12.6.2.1. Introduction

            12.6.2.2. Market Analysis and Forecast By Market Taxonomy

                12.6.2.2.1. By Dosage Form

                12.6.2.2.2. By Indication

                12.6.2.2.3. By End User

13. Latin America Drug Formulation Market Analysis 2012 to 2021 and Forecast 2022 to 2032

    13.1. Introduction

    13.2. Historical Market Size (US$ Million) Analysis By Market Taxonomy, 2012 to 2021

    13.3. Current and Future Market Size (US$ Million) By Market Taxonomy, 2022 to 2032

        13.3.1. By Country

            13.3.1.1. Brazil

            13.3.1.2. Mexico

            13.3.1.3. Argentina

            13.3.1.4. Rest of Latin America

        13.3.2. By Dosage Form

        13.3.3. By Indication

        13.3.4. By End User

    13.4. Market Attractiveness Analysis

        13.4.1. By Country

        13.4.2. By Dosage Form

        13.4.3. By Indication

        13.4.4. By End User

    13.5. Key Market Participants - Intensity Mapping

    13.6. Country-Level Analysis & Forecast

        13.6.1. Brazil Drug Formulation Market

            13.6.1.1. Introduction

            13.6.1.2. Market Analysis and Forecast By Market Taxonomy

                13.6.1.2.1. By Dosage Form

                13.6.1.2.2. By Indication

                13.6.1.2.3. By End User

        13.6.2. Mexico Drug Formulation Market

            13.6.2.1. Introduction

            13.6.2.2. Market Analysis and Forecast By Market Taxonomy

                13.6.2.2.1. By Dosage Form

                13.6.2.2.2. By Indication

                13.6.2.2.3. By End User

        13.6.3. Argentina Drug Formulation Market

            13.6.3.1. Introduction

            13.6.3.2. Market Analysis and Forecast By Market Taxonomy

                13.6.3.2.1. By Dosage Form

                13.6.3.2.2. By Indication

                13.6.3.2.3. By End User

14. Europe Drug Formulation Market Analysis 2012 to 2021 and Forecast 2022 to 2032

    14.1. Introduction

    14.2. Historical Market Size (US$ Million) Analysis By Market Taxonomy, 2012 to 2021

    14.3. Current and Future Market Size (US$ Million) By Market Taxonomy, 2022 to 2032

        14.3.1. By Country

            14.3.1.1. Germany

            14.3.1.2. Italy

            14.3.1.3. France

            14.3.1.4. The UK

            14.3.1.5. Spain

            14.3.1.6. BENELUX

            14.3.1.7. Russia

            14.3.1.8. Rest of Europe

        14.3.2. By Dosage Form

        14.3.3. By Indication

        14.3.4. By End User

    14.4. Market Attractiveness Analysis

        14.4.1. By Country

        14.4.2. By Dosage Form

        14.4.3. By Indication

        14.4.4. By End User

    14.5. Key Market Participants - Intensity Mapping

    14.6. Country-Level Analysis & Forecast

        14.6.1. Germany Drug Formulation Market

            14.6.1.1. Introduction

            14.6.1.2. Market Analysis and Forecast By Market Taxonomy

                14.6.1.2.1. By Dosage Form

                14.6.1.2.2. By Indication

                14.6.1.2.3. By End User

        14.6.2. Italy Drug Formulation Market

            14.6.2.1. Introduction

            14.6.2.2. Market Analysis and Forecast By Market Taxonomy

                14.6.2.2.1. By Dosage Form

                14.6.2.2.2. By Indication

                14.6.2.2.3. By End User

        14.6.3. France Drug Formulation Market

            14.6.3.1. Introduction

            14.6.3.2. Market Analysis and Forecast By Market Taxonomy

                14.6.3.2.1. By Dosage Form

                14.6.3.2.2. By Indication

                14.6.3.2.3. By End User

        14.6.4. U.K. Drug Formulation Market

            14.6.4.1. Introduction

            14.6.4.2. Market Analysis and Forecast By Market Taxonomy

                14.6.4.2.1. By Dosage Form

                14.6.4.2.2. By Indication

                14.6.4.2.3. By End User

        14.6.5. Spain Drug Formulation Market

            14.6.5.1. Introduction

            14.6.5.2. Market Analysis and Forecast By Market Taxonomy

                14.6.5.2.1. By Dosage Form

                14.6.5.2.2. By Indication

                14.6.5.2.3. By End User

        14.6.6. BENELUX Drug Formulation Market

            14.6.6.1. Introduction

            14.6.6.2. Market Analysis and Forecast By Market Taxonomy

                14.6.6.2.1. By Dosage Form

                14.6.6.2.2. By Indication

                14.6.6.2.3. By End User

        14.6.7. Russia Drug Formulation Market

            14.6.7.1. Introduction

            14.6.7.2. Market Analysis and Forecast By Market Taxonomy

                14.6.7.2.1. By Dosage Form

                14.6.7.2.2. By Indication

                14.6.7.2.3. By End User

15. South Asia Drug Formulation Market Analysis 2012 to 2021 and Forecast 2022 to 2032

    15.1. Introduction

    15.2. Historical Market Size (US$ Million) Analysis By Market Taxonomy, 2012 to 2021

    15.3. Current and Future Market Size (US$ Million) By Market Taxonomy, 2022 to 2032

        15.3.1. By Country

            15.3.1.1. India

            15.3.1.2. Thailand

            15.3.1.3. Indonesia

            15.3.1.4. Malaysia

            15.3.1.5. Rest of South Asia

        15.3.2. By Dosage Form

        15.3.3. By Indication

        15.3.4. By End User

    15.4. Market Attractiveness Analysis

        15.4.1. By Country

        15.4.2. By Dosage Form

        15.4.3. By Indication

        15.4.4. By End User

    15.5. Key Market Participants - Intensity Mapping

    15.6. Country-Level Analysis & Forecast

        15.6.1. India Drug Formulation Market

            15.6.1.1. Introduction

            15.6.1.2. Market Analysis and Forecast By Market Taxonomy

                15.6.1.2.1. By Dosage Form

                15.6.1.2.2. By Indication

                15.6.1.2.3. By End User

        15.6.2. Thailand Drug Formulation Market

            15.6.2.1. Introduction

            15.6.2.2. Market Analysis and Forecast By Market Taxonomy

                15.6.2.2.1. By Dosage Form

                15.6.2.2.2. By Indication

                15.6.2.2.3. By End User

        15.6.3. Indonesia Drug Formulation Market

            15.6.3.1. Introduction

            15.6.3.2. Market Analysis and Forecast By Market Taxonomy

                15.6.3.2.1. By Dosage Form

                15.6.3.2.2. By Indication

                15.6.3.2.3. By End User

        15.6.4. Malaysia Drug Formulation Market

            15.6.4.1. Introduction

            15.6.4.2. Market Analysis and Forecast By Market Taxonomy

                15.6.4.2.1. By Dosage Form

                15.6.4.2.2. By Indication

                15.6.4.2.3. By End User

16. East Asia Drug Formulation Market Analysis 2012 to 2021 and Forecast 2022 to 2032

    16.1. Introduction

    16.2. Historical Market Size (US$ Million) Analysis By Market Taxonomy, 2012 to 2021

    16.3. Market Size (US$ Million) By Market Taxonomy, 2022 to 2032

        16.3.1. By Country

            16.3.1.1. China

            16.3.1.2. Japan

            16.3.1.3. South Korea

        16.3.2. By Dosage Form

        16.3.3. By Indication

        16.3.4. By End User

    16.4. Market Attractiveness Analysis

        16.4.1. By Country

        16.4.2. By Dosage Form

        16.4.3. By Indication

        16.4.4. By End User

    16.5. Key Market Participants - Intensity Mapping

    16.6. Country-Level Analysis & Forecast

        16.6.1. China Drug Formulation Market

            16.6.1.1. Introduction

            16.6.1.2. Market Analysis and Forecast By Market Taxonomy

                16.6.1.2.1. By Dosage Form

                16.6.1.2.2. By Indication

                16.6.1.2.3. By End User

        16.6.2. Japan Drug Formulation Market

            16.6.2.1. Introduction

            16.6.2.2. Market Analysis and Forecast By Market Taxonomy

                16.6.2.2.1. By Dosage Form

                16.6.2.2.2. By Indication

                16.6.2.2.3. By End User

        16.6.3. South Korea Drug Formulation Market

            16.6.3.1. Introduction

            16.6.3.2. Market Analysis and Forecast By Market Taxonomy

                16.6.3.2.1. By Dosage Form

                16.6.3.2.2. By Indication

                16.6.3.2.3. By End User

17. Oceania Drug Formulation Market Analysis 2012 to 2021 and Forecast 2022 to 2032

    17.1. Introduction

    17.2. Historical Market Size (US$ Million) Analysis By Market Taxonomy, 2012 to 2021

    17.3. Market Size (US$ Million) By Market Taxonomy, 2022 to 2032

        17.3.1. By Country

            17.3.1.1. Australia

            17.3.1.2. New Zealand

        17.3.2. B By Dosage Form

        17.3.3. By Indication

        17.3.4. By End User

    17.4. Market Attractiveness Analysis

        17.4.1. By Country

        17.4.2. By Dosage Form

        17.4.3. By Indication

        17.4.4. By End User

    17.5. Country-Level Analysis & Forecast

        17.5.1. Australia Drug Formulation Market

            17.5.1.1. Introduction

            17.5.1.2. Market Analysis and Forecast By Market Taxonomy

                17.5.1.2.1. By Dosage Form

                17.5.1.2.2. By Indication

                17.5.1.2.3. By End User

        17.5.2. New Zealand Drug Formulation Market

            17.5.2.1. Introduction

            17.5.2.2. Market Analysis and Forecast By Market Taxonomy

                17.5.2.2.1. By Dosage Form

                17.5.2.2.2. By Indication

                17.5.2.2.3. By End User

18. Middle East and Africa Drug Formulation Market Analysis 2012 to 2021and Forecast 2022 to 2032

    18.1. Introduction

    18.2. Historical Market Size (US$ Million) Analysis By Market Taxonomy, 2012 to 2021

    18.3. Market Size (US$ Million) Forecast By Market Taxonomy, 2022 to 2032

        18.3.1. By Country

            18.3.1.1. GCC Countries

            18.3.1.2. Turkey

            18.3.1.3. Israel

            18.3.1.4. South Africa

            18.3.1.5. North Africa

            18.3.1.6. Rest of Middle East and Africa

        18.3.2. By Dosage Form

        18.3.3. By Indication

        18.3.4. By End User

    18.4. Market Attractiveness Analysis

        18.4.1. By Country

        18.4.2. By Dosage Form

        18.4.3. By Indication

        18.4.4. By End User

    18.5. Key Market Participants - Intensity Mapping

    18.6. Country-Level Analysis & Forecast

        18.6.1. GCC Countries Drug Formulation Market

            18.6.1.1. Introduction

            18.6.1.2. Market Analysis and Forecast By Market Taxonomy

                18.6.1.2.1. By Dosage Form

                18.6.1.2.2. By Indication

                18.6.1.2.3. By End User

        18.6.2. Turkey Drug Formulation Market

            18.6.2.1. Introduction

            18.6.2.2. Market Analysis and Forecast By Market Taxonomy

                18.6.2.2.1. By Dosage Form

                18.6.2.2.2. By Indication

                18.6.2.2.3. By End User

        18.6.3. Egypt Drug Formulation Market

            18.6.3.1. Introduction

            18.6.3.2. Market Analysis and Forecast By Market Taxonomy

                18.6.3.2.1. By Dosage Form

                18.6.3.2.2. By Indication

                18.6.3.2.3. By End User

        18.6.4. South Africa Drug Formulation Market

            18.6.4.1. Introduction

            18.6.4.2. Market Analysis and Forecast By Market Taxonomy

                18.6.4.2.1. By Dosage Form

                18.6.4.2.2. By Indication

                18.6.4.2.3. By End User

        18.6.5. North Africa Drug Formulation Market

            18.6.5.1. Introduction

            18.6.5.2. Market Analysis and Forecast By Market Taxonomy

                18.6.5.2.1. By Dosage Form

                18.6.5.2.2. By Indication

                18.6.5.2.3. By End User

19. Market Structure Analysis

    19.1. Market Analysis By Tier of Companies

    19.2. Market Share Analysis of Top Players

    19.3. Market Presence Analysis

20. Competition Analysis

    20.1. Competition Dashboard

    20.2. Competition Deep Dive

        20.2.1. AstraZeneca plc.

            20.2.1.1. Overview

            20.2.1.2. Product Portfolio

            20.2.1.3. SWOT Analysis

            20.2.1.4. Strategy Overview

                20.2.1.4.1. Marketing Strategies

                20.2.1.4.2. Product Strategies

                20.2.1.4.3. Channel Strategies

        20.2.2. Bristol-Myers Squibb

            20.2.2.1. Overview

            20.2.2.2. Product Portfolio

            20.2.2.3. SWOT Analysis

            20.2.2.4. Strategy Overview

                20.2.2.4.1. Marketing Strategies

                20.2.2.4.2. Product Strategies

                20.2.2.4.3. Channel Strategies

        20.2.3. Eli Lilly and Company

            20.2.3.1. Overview

            20.2.3.2. Product Portfolio

            20.2.3.3. SWOT Analysis

            20.2.3.4. Strategy Overview

                20.2.3.4.1. Marketing Strategies

                20.2.3.4.2. Product Strategies

                20.2.3.4.3. Channel Strategies

        20.2.4. Gilead Sciences, Inc.

            20.2.4.1. Overview

            20.2.4.2. Product Portfolio

            20.2.4.3. SWOT Analysis

            20.2.4.4. Strategy Overview

                20.2.4.4.1. Marketing Strategies

                20.2.4.4.2. Product Strategies

                20.2.4.4.3. Channel Strategies

        20.2.5. Merck & Co., Inc.

            20.2.5.1. Overview

            20.2.5.2. Product Portfolio

            20.2.5.3. SWOT Analysis

            20.2.5.4. Strategy Overview

                20.2.5.4.1. Marketing Strategies

                20.2.5.4.2. Product Strategies

                20.2.5.4.3. Channel Strategies

        20.2.6. Novartis AG

            20.2.6.1. Overview

            20.2.6.2. Product Portfolio

            20.2.6.3. SWOT Analysis

            20.2.6.4. Strategy Overview

                20.2.6.4.1. Marketing Strategies

                20.2.6.4.2. Product Strategies

                20.2.6.4.3. Channel Strategies

        20.2.7. Pfizer Inc.

            20.2.7.1. Overview

            20.2.7.2. Product Portfolio

            20.2.7.3. SWOT Analysis

            20.2.7.4. Strategy Overview

                20.2.7.4.1. Marketing Strategies

                20.2.7.4.2. Product Strategies

                20.2.7.4.3. Channel Strategies

        20.2.8. AbbVie Inc.

            20.2.8.1. Overview

            20.2.8.2. Product Portfolio

            20.2.8.3. SWOT Analysis

            20.2.8.4. Strategy Overview

                20.2.8.4.1. Marketing Strategies

                20.2.8.4.2. Product Strategies

                20.2.8.4.3. Channel Strategies

        20.2.9. Boehringer Ingelheim International GmbH

            20.2.9.1. Overview

            20.2.9.2. Product Portfolio

            20.2.9.3. SWOT Analysis

            20.2.9.4. Strategy Overview

                20.2.9.4.1. Marketing Strategies

                20.2.9.4.2. Product Strategies

                20.2.9.4.3. Channel Strategies

        20.2.10. F. Hoffmann-La Roche AG

            20.2.10.1. Overview

            20.2.10.2. Product Portfolio

            20.2.10.3. SWOT Analysis

            20.2.10.4. Strategy Overview

                20.2.10.4.1. Marketing Strategies

                20.2.10.4.2. Product Strategies

                20.2.10.4.3. Channel Strategies

        20.2.11. Johnson & Johnson

            20.2.11.1. Overview

            20.2.11.2. Product Portfolio

            20.2.11.3. SWOT Analysis

            20.2.11.4. Strategy Overview

                20.2.11.4.1. Marketing Strategies

                20.2.11.4.2. Product Strategies

                20.2.11.4.3. Channel Strategies

        20.2.12. 3M Company

            20.2.12.1. Overview

            20.2.12.2. Product Portfolio

            20.2.12.3. SWOT Analysis

            20.2.12.4. Strategy Overview

                20.2.12.4.1. Marketing Strategies

                20.2.12.4.2. Product Strategies

                20.2.12.4.3. Channel Strategies

        20.2.13. Bayer AG

            20.2.13.1. Overview

            20.2.13.2. Product Portfolio

            20.2.13.3. SWOT Analysis

            20.2.13.4. Strategy Overview

                20.2.13.4.1. Marketing Strategies

                20.2.13.4.2. Product Strategies

                20.2.13.4.3. Channel Strategies

        20.2.14. Teva Pharmaceuticals Industries Ltd.

            20.2.14.1. Overview

            20.2.14.2. Product Portfolio

            20.2.14.3. SWOT Analysis

            20.2.14.4. Strategy Overview

                20.2.14.4.1. Marketing Strategies

                20.2.14.4.2. Product Strategies

                20.2.14.4.3. Channel Strategies

        20.2.15. Amgen, Inc.

            20.2.15.1. Overview

            20.2.15.2. Product Portfolio

            20.2.15.3. SWOT Analysis

            20.2.15.4. Strategy Overview

                20.2.15.4.1. Marketing Strategies

                20.2.15.4.2. Product Strategies

                20.2.15.4.3. Channel Strategies

        20.2.16. Sanofi SA

            20.2.16.1. Overview

            20.2.16.2. Product Portfolio

            20.2.16.3. SWOT Analysis

            20.2.16.4. Strategy Overview

                20.2.16.4.1. Marketing Strategies

                20.2.16.4.2. Product Strategies

                20.2.16.4.3. Channel Strategies

        20.2.17. GlaxoSmithKline plc

            20.2.17.1. Overview

            20.2.17.2. Product Portfolio

            20.2.17.3. SWOT Analysis

            20.2.17.4. Strategy Overview

                20.2.17.4.1. Marketing Strategies

                20.2.17.4.2. Product Strategies

                20.2.17.4.3. Channel Strategies

        20.2.18. Boston Scientific Corporation

            20.2.18.1. Overview

            20.2.18.2. Product Portfolio

            20.2.18.3. SWOT Analysis

            20.2.18.4. Strategy Overview

                20.2.18.4.1. Marketing Strategies

                20.2.18.4.2. Product Strategies

                20.2.18.4.3. Channel Strategies

        20.2.19. Gerresheimer AG

            20.2.19.1. Overview

            20.2.19.2. Product Portfolio

            20.2.19.3. SWOT Analysis

            20.2.19.4. Strategy Overview

                20.2.19.4.1. Marketing Strategies

                20.2.19.4.2. Product Strategies

                20.2.19.4.3. Channel Strategies

        20.2.20. Nimbus Therapeutics

            20.2.20.1. Overview

            20.2.20.2. Product Portfolio

            20.2.20.3. SWOT Analysis

            20.2.20.4. Strategy Overview

                20.2.20.4.1. Marketing Strategies

                20.2.20.4.2. Product Strategies

                20.2.20.4.3. Channel Strategies

        20.2.21. Antares Pharma, Inc.

            20.2.21.1. Overview

            20.2.21.2. Product Portfolio

            20.2.21.3. SWOT Analysis

            20.2.21.4. Strategy Overview

                20.2.21.4.1. Marketing Strategies

                20.2.21.4.2. Product Strategies

                20.2.21.4.3. Channel Strategies

        20.2.22. IDEAYA Biosciences, Inc.

            20.2.22.1. Overview

            20.2.22.2. Product Portfolio

            20.2.22.3. SWOT Analysis

            20.2.22.4. Strategy Overview

                20.2.22.4.1. Marketing Strategies

                20.2.22.4.2. Product Strategies

                20.2.22.4.3. Channel Strategies

21. Assumptions and Acronyms Used

22. Research Methodology

List of Tables

Table 01: Global Drug Formulation Market Size (US$ Bn) Analysis 2012 to 2021 and Forecast 2022 to 2032, By Dosage Form

Table 02: Global Drug Formulation Market Size (US$ Bn) Analysis 2012 to 2021 and Forecast 2022 to 2032, By Dosage Form

Table 03: Global Drug Formulation Market Size (US$ Bn) Analysis 2012 to 2021 and Forecast 2022 to 2032, By Dosage Form

Table 04: Global Drug Formulation Market Size (US$ Bn) Analysis 2012 to 2021 and Forecast 2022 to 2032, By Dosage Form

Table 05: Global Drug Formulation Market Size (US$ Bn) Analysis 2012 to 2021 and Forecast 2022 to 2032, By Indication

Table 06: Global Drug Formulation Market Size (US$ Bn) Analysis 2012 to 2021 and Forecast 2022 to 2032, By Indication

Table 07: Global Drug Formulation Market Size (US$ Bn) Analysis 2012 to 2021 and Forecast 2022 to 2032, By End User

Table 08: Global Drug Formulation Market Size (US$ Bn) Analysis 2012 to 2021 and Forecast 2022 to 2032, By End User

Table 09: Global Drug Formulation Market Size (US$ Bn) Analysis 2012 to 2021 and Forecast 2022 to 2032, By Region

Table 10: Global Drug Formulation Market Size (US$ Bn) Analysis 2012 to 2021 and Forecast 2022 to 2032, By Region

Table 11: North America Drug Formulation Market Size (US$ Bn) Analysis 2012 to 2021 and Forecast 2022 to 2032, By Country

Table 12: North America Drug Formulation Market Size (US$ Bn) Analysis 2012 to 2021 and Forecast 2022 to 2032, By Country

Table 13: North America Drug Formulation Market Size (US$ Bn) Analysis 2012 to 2021 and Forecast 2022 to 2032, By Dosage Form

Table 14: North America Drug Formulation Market Size (US$ Bn) Analysis 2012 to 2021 and Forecast 2022 to 2032, By Dosage Form

Table 15: North America Drug Formulation Market Size (US$ Bn) Analysis 2012 to 2021 and Forecast 2022 to 2032, By Dosage Form

Table 16: North America Drug Formulation Market Size (US$ Bn) Analysis 2012 to 2021 and Forecast 2022 to 2032, By Dosage Form

Table 17: North America Drug Formulation Market Size (US$ Bn) Analysis 2012 to 2021 and Forecast 2022 to 2032, By Indication

Table 18: North America Drug Formulation Market Size (US$ Bn) Analysis 2012 to 2021 and Forecast 2022 to 2032, By Indication

Table 19: Global Drug Formulation Market Size (US$ Bn) Analysis 2012 to 2021 and Forecast 2022 to 2032, By End User

Table 20: Global Drug Formulation Market Size (US$ Bn) Analysis 2012 to 2021 and Forecast 2022 to 2032, By End User

Table 20 :Latin America Drug Formulation Market Size (US$ Bn) Analysis 2012 to 2021 and Forecast 2022 to 2032, By End User

Table 21: Latin America Drug Formulation Market Size (US$ Bn) Analysis 2012 to 2021 and Forecast 2022 to 2032, By Country

Table 22: Latin America Drug Formulation Market Size (US$ Bn) Analysis 2012 to 2021 and Forecast 2022 to 2032, By Country

Table 23: Latin America Drug Formulation Market Size (US$ Bn) Analysis 2012 to 2021 and Forecast 2022 to 2032, By Dosage Form

Table 24: Latin America Drug Formulation Market Size (US$ Bn) Analysis 2012 to 2021 and Forecast 2022 to 2032, By Dosage Form

Table 25: Latin America Drug Formulation Market Size (US$ Bn) Analysis 2012 to 2021 and Forecast 2022 to 2032, By Dosage Form

Table 26: Latin America Drug Formulation Market Size (US$ Bn) Analysis 2012 to 2021 and Forecast 2022 to 2032, By Dosage Form

Table 27: Latin America Drug Formulation Market Size (US$ Bn) Analysis 2012 to 2021 and Forecast 2022 to 2032, By Indication

Table 28: Latin America Drug Formulation Market Size (US$ Bn) Analysis 2012 to 2021 and Forecast 2022 to 2032, By Indication

Table 30 :Latin America Drug Formulation Market Size (US$ Bn) Analysis 2012 to 2021 and Forecast 2022 to 2032, By End User

Table 31 : Europe Drug Formulation Market Size (US$ Bn) Analysis 2012 to 2021 and Forecast 2022 to 2032, By Country

Table 32 : Europe Drug Formulation Market Size (US$ Bn) Analysis 2012 to 2021 and Forecast 2022 to 2032, By Country

Table 33 : Europe Drug Formulation Market Size (US$ Bn) Analysis 2012 to 2021 and Forecast 2022 to 2032, By Dosage Form

Table 34: Europe Drug Formulation Market Size (US$ Bn) Analysis 2012 to 2021 and Forecast 2022 to 2032, By Dosage Form

Table 35: Europe Drug Formulation Market Size (US$ Bn) Analysis 2012 to 2021 and Forecast 2022 to 2032, By Dosage Form

Table 36 : Europe Drug Formulation Market Size (US$ Bn) Analysis 2012 to 2021 and Forecast 2022 to 2032, By Dosage Form

Table 37: Europe Drug Formulation Market Size (US$ Bn) Analysis 2012 to 2021 and Forecast 2022 to 2032, By Indication

Table 38 : Europe Drug Formulation Market Size (US$ Bn) Analysis 2012 to 2021 and Forecast 2022 to 2032, By Indication

Table 39 : Europe Drug Formulation Market Size (US$ Bn) Analysis 2012 to 2021 and Forecast 2022 to 2032, By End User

Table 40 : Europe Drug Formulation Market Size (US$ Bn) Analysis 2012 to 2021 and Forecast 2022 to 2032, By End User

Table 41 : South Asia Drug Formulation Market Size (US$ Bn) Analysis 2012 to 2021 and Forecast 2022 to 2032, By Country

Table 42 : South Asia Drug Formulation Market Size (US$ Bn) Analysis 2012 to 2021 and Forecast 2022 to 2032, By Country

Table 43: South Asia Drug Formulation Market Size (US$ Bn) Analysis 2012 to 2021 and Forecast 2022 to 2032, By Dosage Form

Table 44 :South Asia Drug Formulation Market Size (US$ Bn) Analysis 2012 to 2021 and Forecast 2022 to 2032, By Dosage Form

Table 45 :South Asia Drug Formulation Market Size (US$ Bn) Analysis 2012 to 2021 and Forecast 2022 to 2032, By Dosage Form

Table 46 :South Asia Drug Formulation Market Size (US$ Bn) Analysis 2012 to 2021 and Forecast 2022 to 2032, By Dosage Form

Table 47 :South Asia Drug Formulation Market Size (US$ Bn) Analysis 2012 to 2021 and Forecast 2022 to 2032, By Indication

Table 48 : South Asia Drug Formulation Market Size (US$ Bn) Analysis 2012 to 2021 and Forecast 2022 to 2032, By Indication

Table 49 : South Asia Drug Formulation Market Size (US$ Bn) Analysis 2012 to 2021 and Forecast 2022 to 2032, By End User

Table 50 : South Asia Drug Formulation Market Size (US$ Bn) Analysis 2012 to 2021 and Forecast 2022 to 2032, By End User

Table 51: East Asia Drug Formulation Market Size (US$ Bn) Analysis 2012 to 2021 and Forecast 2022 to 2032, By Country

Table 52: East Asia Drug Formulation Market Size (US$ Bn) Analysis 2012 to 2021 and Forecast 2022 to 2032, By Country

Table 53 :East Asia Drug Formulation Market Size (US$ Bn) Analysis 2012 to 2021 and Forecast 2022 to 2032, By Dosage Form

Table 54: East Asia Drug Formulation Market Size (US$ Bn) Analysis 2012 to 2021 and Forecast 2022 to 2032, By Dosage Form

Table 55: East Asia Drug Formulation Market Size (US$ Bn) Analysis 2012 to 2021 and Forecast 2022 to 2032, By Dosage Form

Table 56: East Asia Drug Formulation Market Size (US$ Bn) Analysis 2012 to 2021 and Forecast 2022 to 2032, By Dosage Form

Table 57: East Asia Drug Formulation Market Size (US$ Bn) Analysis 2012 to 2021 and Forecast 2022 to 2032, By Indication

Table 58: East Asia Drug Formulation Market Size (US$ Bn) Analysis 2012 to 2021 and Forecast 2022 to 2032, By Indication

Table 59: East Asia Drug Formulation Market Size (US$ Bn) Analysis 2012 to 2021 and Forecast 2022 to 2032, By End User

Table 60: East Asia Drug Formulation Market Size (US$ Bn) Analysis 2012 to 2021 and Forecast 2022 to 2032, By End User

Table 61: Oceania Drug Formulation Market Size (US$ Bn) Analysis 2012 to 2021 and Forecast 2022 to 2032, By Country

Table 62: Oceania Drug Formulation Market Size (US$ Bn) Analysis 2012 to 2021 and Forecast 2022 to 2032, By Country

Table 63 :Oceania Drug Formulation Market Size (US$ Bn) Analysis 2012 to 2021 and Forecast 2022 to 2032, By Dosage Form

Table 64 :Oceania Drug Formulation Market Size (US$ Bn) Analysis 2012 to 2021 and Forecast 2022 to 2032, By Dosage Form

Table 65: Oceania Drug Formulation Market Size (US$ Bn) Analysis 2012 to 2021 and Forecast 2022 to 2032, By Dosage Form

Table 66: Oceania Drug Formulation Market Size (US$ Bn) Analysis 2012 to 2021 and Forecast 2022 to 2032, By Dosage Form

Table 67 : Oceania Drug Formulation Market Size (US$ Bn) Analysis 2012 to 2021 and Forecast 2022 to 2032, By Indication

Table 68 : Oceania Drug Formulation Market Size (US$ Bn) Analysis 2012 to 2021 and Forecast 2022 to 2032, By Indication

Table 69: Oceania Drug Formulation Market Size (US$ Bn) Analysis 2012 to 2021 and Forecast 2022 to 2032, By End User

Table 70: Oceania Drug Formulation Market Size (US$ Bn) Analysis 2012 to 2021 and Forecast 2022 to 2032, By End User

Table 71 : Middle East & Africa Drug Formulation Market Size (US$ Bn) Analysis 2012 to 2021 and Forecast 2022 to 2032, By Country

Table 72 : Middle East & Africa Drug Formulation Market Size (US$ Bn) Analysis 2012 to 2021 and Forecast 2022 to 2032, By Country

Table 73 :Middle East & Africa Drug Formulation Market Size (US$ Bn) Analysis 2012 to 2021 and Forecast 2022 to 2032, By Dosage Form

Table 74 :Middle East & Africa Drug Formulation Market Size (US$ Bn) Analysis 2012 to 2021 and Forecast 2022 to 2032, By Dosage Form

Table 75 : Middle East & Africa Drug Formulation Market Size (US$ Bn) Analysis 2012 to 2021 and Forecast 2022 to 2032, By Dosage Form

Table 76 : Middle East & Africa Drug Formulation Market Size (US$ Bn) Analysis 2012 to 2021 and Forecast 2022 to 2032, By Dosage Form

Table 77: Middle East & Africa Drug Formulation Market Size (US$ Bn) Analysis 2012 to 2021 and Forecast 2022 to 2032, By Indication

Table 78: Middle East & Africa Drug Formulation Market Size (US$ Bn) Analysis 2012 to 2021 and Forecast 2022 to 2032, By Indication

Table 79: Middle East & Africa Drug Formulation Market Size (US$ Bn) Analysis 2012 to 2021 and Forecast 2022 to 2032, By End User

Table 80: Middle East & Africa Drug Formulation Market Size (US$ Bn) Analysis 2012 to 2021 and Forecast 2022 to 2032, By End User

List of Charts

Figure 01: Global Drug Formulation Market Size (US$ Mn) 2021A & 2032F

Figure 02: Global Drug Formulation Market Share 2021A, By Dosage Form

Figure 03: Global Drug Formulation Market Share 2021A, By Indication

Figure 04: Global Drug Formulation Market Share 2021A, By End User

Figure 05: Global Drug Formulation Market Share 2021A, By Region

Figure 06: Global Drug Formulation Market Size (US$ Bn) Analysis, 2012 to 2021

Figure 07: Global Drug Formulation Market Size (US$ Bn) & Y-o-Y Growth (%) Analysis, 2022 to 2032

Figure 08: Global Drug Formulation Market Absolute $ Opportunity Analysis, 2022 to 2032

Figure 09: Global Drug Formulation Market Analysis By Dosage Form 2022 to 2032

Figure 10: Global Drug Formulation Market Y-o-Y Growth Projections By Dosage Form, 2022 to 2032

Figure 11: Global Drug Formulation Market Attractiveness, By Dosage Form, 2022 to 2032

Figure 12: Global Drug Formulation Market Analysis By Indication 2021 to 2032

Figure 13: Global Drug Formulation Market Y-o-Y Growth Projections By Indication, 2022 to 2032

Figure 14: Global Drug Formulation Market Attractiveness, By Indication, 2022 to 2032

Figure 15: Global Drug Formulation Market Analysis By End User, 2021 to 2032

Figure 16: Global Drug Formulation Market Y-o-Y Growth Projections By End User, 2022 to 2032

Figure 17: Global Drug Formulation Market Attractiveness, By End User, 2022 to 2032

Figure 18: Global Drug Formulation Market Analysis By Region, 2021 to 2032

Figure 19: Global Drug Formulation Market Y-o-Y Growth Projections By Region, 2022 to 2032

Figure 20: Global Drug Formulation Market Attractiveness, By Region, 2022 to 2032

Figure 21: North America Drug Formulation Market Value Share, By Dosage Form 2022 (E)

Figure 22: North America Drug Formulation Market Value Share, By Indication 2022 (E)

Figure 23: North America Drug Formulation Market Value Share, By End User 2022 (E)

Figure 24: North America Drug Formulation Market Value Share, By Region 2022 (E)

Figure 25: North America Drug Formulation Market Size (US$ Bn) Analysis, 2012 to 2021

Figure 26: North America Drug Formulation Market Size (US$ Bn) & Y-o-Y Growth (%) Analysis, 2022 to 2032

Figure 27: North America Drug Formulation Market Attractiveness Analysis, By Country

Figure 28: North America Drug Formulation Market Attractiveness Analysis, By Dosage Form

Figure 29: North America Drug Formulation Market Attractiveness, By Indication

Figure 30: North America Drug Formulation Market Attractiveness, By End User

Figure 31: US Market Value Proportion Analysis, 2021

Figure 32: Global Vs. US Growth Comparison, 2021 to 2032

Figure 33: US Drug Formulation Market Share Analysis (%), By Dosage Form, 2021 to 2032

Figure 34: US Drug Formulation Market Share Analysis (%), By Indication, 2021 to 2032

Figure 35: US Drug Formulation Market Share Analysis (%), By End User, 2021 to 2032

Figure 36: Canada Market Value Proportion Analysis, 2021

Figure 37: Global Vs. Canada Growth Comparison, 2021 to 2032

Figure 38: Canada Drug Formulation Market Share Analysis (%), By Dosage Form, 2021 to 2032

Figure 39: Canada Drug Formulation Market Share Analysis (%), By Indication, 2021 to 2032

Figure 40: Canada Drug Formulation Market Share Analysis (%), By End User, 2021 to 2032

Figure 41: Latin America Drug Formulation Market Value Share, By Dosage Form 2022 (E)

Figure 42: Latin America Drug Formulation Market Value Share, By Indication 2022 (E)

Figure 43: Latin America Drug Formulation Market Value Share, By End User 2022 (E)

Figure 44: Latin America Drug Formulation Market Value Share, By Region 2022 (E)

Figure 45: Latin America Drug Formulation Market Size (US$ Bn) Analysis, 2012 to 2021

Figure 46: Latin America Drug Formulation Market Size (US$ Bn) & Y-o-Y Growth (%) Analysis, 2022 to 2032

Figure 47: Latin America Drug Formulation Market Attractiveness Analysis, By Country

Figure 48: Latin America Drug Formulation Market Attractiveness Analysis, By Dosage Form

Figure 49: Latin America Drug Formulation Market Attractiveness, By Indication

Figure 50: Latin America Drug Formulation Market Attractiveness, By End User

Figure 51: Brazil Market Value Proportion Analysis, 2021

Figure 52: Global Vs. Brazil Growth Comparison, 2021 to 2032

Figure 53: Brazil Drug Formulation Market Share Analysis (%), By Dosage Form, 2021 to 2032

Figure 54: Brazil Drug Formulation Market Share Analysis (%), By Indication, 2021 to 2032

Figure 55: Brazil Drug Formulation Market Share Analysis (%), By End User, 2021 to 2032

Figure 56: Mexico Market Value Proportion Analysis, 2021

Figure 57: Global Vs. Mexico Growth Comparison, 2021 to 2032

Figure 58: Mexico Drug Formulation Market Share Analysis (%), By Dosage Form, 2021 to 2032

Figure 59: Mexico Drug Formulation Market Share Analysis (%), By Indication, 2021 to 2032

Figure 60: Mexico Drug Formulation Market Share Analysis (%), By End User, 2021 to 2032

Figure 61: Argentina Market Value Proportion Analysis, 2021

Figure 62: Global Vs. Argentina Growth Comparison, 2021 to 2032

Figure 63: Argentina Drug Formulation Market Share Analysis (%), By Dosage Form, 2021 to 2032

Figure 64: Argentina Drug Formulation Market Share Analysis (%), By Indication, 2021 to 2032

Figure 65: Argentina Drug Formulation Market Share Analysis (%), By End User, 2021 to 2032

Figure 66: Europe Drug Formulation Market Value Share, By Dosage Form 2022 (E)

Figure 67: Europe Drug Formulation Market Value Share, By Indication 2022 (E)

Figure 68: Europe Drug Formulation Market Value Share, By End User 2022 (E)

Figure 69: Europe Drug Formulation Market Value Share, By Region 2022 (E)

Figure 70: Europe Drug Formulation Market Size (US$ Bn) Analysis, 2012 to 2021

Figure 71: Europe Drug Formulation Market Size (US$ Bn) & Y-o-Y Growth (%) Analysis, 2022 to 2032

Figure 72: Europe Drug Formulation Market Attractiveness Analysis, By Country

Figure 73: Europe Drug Formulation Market Attractiveness Analysis, By Dosage Form

Figure 74: Europe Drug Formulation Market Attractiveness, By Indication

Figure 75: Europe Drug Formulation Market Attractiveness, By End User

Figure 76: UK Market Value Proportion Analysis, 2021

Figure 77: Global Vs. UK Growth Comparison, 2021 to 2032

Figure 78: UK Drug Formulation Market Share Analysis (%), By Dosage Form, 2021 to 2032

Figure 79: UK Drug Formulation Market Share Analysis (%), By Indication, 2021 to 2032

Figure 80: UK Drug Formulation Market Share Analysis (%), By End User, 2021 to 2032

Figure 81: Germany Market Value Proportion Analysis, 2021

Figure 82: Global Vs. Germany Growth Comparison, 2021 to 2032

Figure 83: Germany Drug Formulation Market Share Analysis (%), By Dosage Form, 2021 to 2032

Figure 84: Germany Drug Formulation Market Share Analysis (%), By Indication, 2021 to 2032

Figure 85: Germany Drug Formulation Market Share Analysis (%), By End User, 2021 to 2032

Figure 86: Italy Market Value Proportion Analysis, 2021

Figure 87: Global Vs. Italy Growth Comparison, 2021 to 2032

Figure 88: Italy Drug Formulation Market Share Analysis (%), By Dosage Form, 2021 to 2032

Figure 89: Italy Drug Formulation Market Share Analysis (%), By Indication, 2021 to 2032

Figure 90: Italy Drug Formulation Market Share Analysis (%), By End User, 2021 to 2032

Figure 91: France Market Value Proportion Analysis, 2021

Figure 92: Global Vs. France Growth Comparison, 2021 to 2032

Figure 93: France Drug Formulation Market Share Analysis (%), By Dosage Form, 2021 to 2032

Figure 94: France Drug Formulation Market Share Analysis (%), By Indication, 2021 to 2032

Figure 95: France Drug Formulation Market Share Analysis (%), By End User, 2021 to 2032

Figure 96: Spain Market Value Proportion Analysis, 2021

Figure 97: Global Vs. Spain Growth Comparison, 2021 to 2032

Figure 98: Spain Drug Formulation Market Share Analysis (%), By Dosage Form, 2021 to 2032

Figure 99: Spain Drug Formulation Market Share Analysis (%), By Indication, 2021 to 2032

Figure 100: Spain Drug Formulation Market Share Analysis (%), By End User, 2021 to 2032

Figure 101: BENELUX Market Value Proportion Analysis, 2021

Figure 102: Global Vs. BENELUX Growth Comparison, 2021 to 2032

Figure 103: BENELUX Drug Formulation Market Share Analysis (%), By Dosage Form, 2021 to 2032

Figure 104: BENELUX Drug Formulation Market Share Analysis (%), By Indication, 2021 to 2032

Figure 105: BENELUX Drug Formulation Market Share Analysis (%), By End User, 2021 to 2032

Figure 106: Russia Market Value Proportion Analysis, 2021

Figure 107: Global Vs. Russia Growth Comparison, 2021 to 2032

Figure 108: Russia Drug Formulation Market Share Analysis (%), By Dosage Form, 2021 to 2032

Figure 109: Russia Drug Formulation Market Share Analysis (%), By Indication, 2021 to 2032

Figure 110: Russia Drug Formulation Market Share Analysis (%), By End User, 2021 to 2032

Figure 111: South Asia Drug Formulation Market Value Share, By Dosage Form 2022 (E)

Figure 112: South Asia Drug Formulation Market Value Share, By Indication 2022 (E)

Figure 113: South Asia Drug Formulation Market Value Share, By End User 2022 (E)

Figure 114: South Asia Drug Formulation Market Value Share, By Region 2022 (E)

Figure 115: South Asia Drug Formulation Market Size (US$ Bn) Analysis, 2012 to 2021

Figure 116: South Asia Drug Formulation Market Size (US$ Bn) & Y-o-Y Growth (%) Analysis, 2022 to 2032

Figure 117: South Asia Drug Formulation Market Attractiveness Analysis, By Country

Figure 118: South Asia Drug Formulation Market Attractiveness Analysis, By Dosage Form

Figure 119: South Asia Drug Formulation Market Attractiveness, By Indication

Figure 120: South Asia Drug Formulation Market Attractiveness, By End User

Figure 121: India Market Value Proportion Analysis, 2021

Figure 122: Global Vs. India Growth Comparison, 2021 to 2032

Figure 123: India Drug Formulation Market Share Analysis (%), By Dosage Form, 2021 to 2032

Figure 124: India Drug Formulation Market Share Analysis (%), By Indication, 2021 to 2032

Figure 125: India Drug Formulation Market Share Analysis (%), By End User, 2021 to 2032

Figure 126: Malaysia Market Value Proportion Analysis, 2021

Figure 127: Global Vs. Malaysia Growth Comparison, 2021 to 2032

Figure 128: Malaysia Drug Formulation Market Share Analysis (%), By Dosage Form, 2021 to 2032

Figure 129: Malaysia Drug Formulation Market Share Analysis (%), By Indication, 2021 to 2032

Figure 130: Malaysia Drug Formulation Market Share Analysis (%), By End User, 2021 to 2032

Figure 131: Thailand Market Value Proportion Analysis, 2021

Figure 132: Global Vs. Thailand Growth Comparison, 2021 to 2032

Figure 133: Thailand Drug Formulation Market Share Analysis (%), By Dosage Form, 2021 to 2032

Figure 134: Thailand Drug Formulation Market Share Analysis (%), By Indication, 2021 to 2032

Figure 135: Thailand Drug Formulation Market Share Analysis (%), By End User, 2021 to 2032

Figure 136: Indonesia Market Value Proportion Analysis, 2021

Figure 137: Global Vs. Indonesia Growth Comparison, 2021 to 2032

Figure 138: Indonesia Drug Formulation Market Share Analysis (%), By Dosage Form, 2021 to 2032

Figure 139: Indonesia Drug Formulation Market Share Analysis (%), By Indication, 2021 to 2032

Figure 140: Indonesia Drug Formulation Market Share Analysis (%), By End User, 2021 to 2032

Figure 141: East Asia Drug Formulation Market Value Share, By Dosage Form 2022 (E)

Figure 142: East Asia Drug Formulation Market Value Share, By Indication 2022 (E)

Figure 143: East Asia Drug Formulation Market Value Share, By End User 2022 (E)

Figure 144: East Asia Drug Formulation Market Value Share, By Region 2022 (E)

Figure 145: East Asia Drug Formulation Market Size (US$ Bn) Analysis, 2012 to 2021

Figure 146: East Asia Drug Formulation Market Size (US$ Bn) & Y-o-Y Growth (%) Analysis, 2022 to 2032

Figure 147: East Asia Drug Formulation Market Attractiveness Analysis, By Country

Figure 148: East Asia Drug Formulation Market Attractiveness Analysis, By Dosage Form

Figure 149: East Asia Drug Formulation Market Attractiveness, By Indication

Figure 150: East Asia Drug Formulation Market Attractiveness, By End User

Figure 151: China Market Value Proportion Analysis, 2021

Figure 152: Global Vs. China Growth Comparison, 2021 to 2032

Figure 153: China Drug Formulation Market Share Analysis (%), By Dosage Form, 2021 to 2032

Figure 154: China Drug Formulation Market Share Analysis (%), By Indication, 2021 to 2032

Figure 155: China Drug Formulation Market Share Analysis (%), By End User, 2021 to 2032

Figure 156: Japan Market Value Proportion Analysis, 2021

Figure 157: Global Vs. Japan Growth Comparison, 2021 to 2032

Figure 158: Japan Drug Formulation Market Share Analysis (%), By Dosage Form, 2021 to 2032

Figure 159: Japan Drug Formulation Market Share Analysis (%), By Indication, 2021 to 2032

Figure 160: Japan Drug Formulation Market Share Analysis (%), By End User, 2021 to 2032

Figure 161: South Korea Market Value Proportion Analysis, 2021

Figure 162: Global Vs. South Korea Growth Comparison, 2021 to 2032

Figure 163: South Korea Drug Formulation Market Share Analysis (%), By Dosage Form, 2021 to 2032

Figure 164: South Korea Drug Formulation Market Share Analysis (%), By Indication, 2021 to 2032

Figure 165: South Korea Drug Formulation Market Share Analysis (%), By End User, 2021 to 2032

Figure 166: Oceania Drug Formulation Market Value Share, By Dosage Form 2022 (E)

Figure 167: Oceania Drug Formulation Market Value Share, By Indication 2022 (E)

Figure 168: Oceania Drug Formulation Market Value Share, By End User 2022 (E)

Figure 169: Oceania Drug Formulation Market Value Share, By Region 2022 (E)

Figure 170: Oceania Drug Formulation Market Size (US$ Bn) Analysis, 2012 to 2021

Figure 171: Oceania Drug Formulation Market Size (US$ Bn) & Y-o-Y Growth (%) Analysis, 2022 to 2032

Figure 172: Oceania Drug Formulation Market Attractiveness Analysis, By Country

Figure 173: Oceania Drug Formulation Market Attractiveness Analysis, By Dosage Form

Figure 174: Oceania Drug Formulation Market Attractiveness, By Indication

Figure 175: Oceania Drug Formulation Market Attractiveness, By End User

Figure 176: Australia Market Value Proportion Analysis, 2021

Figure 177: Global Vs. Australia Growth Comparison, 2021 to 2032

Figure 178: Australia Drug Formulation Market Share Analysis (%), By Dosage Form, 2021 to 2032

Figure 179: Australia Drug Formulation Market Share Analysis (%), By Indication, 2021 to 2032

Figure 180: Australia Drug Formulation Market Share Analysis (%), By End User, 2021 to 2032

Figure 181: New Zealand Market Value Proportion Analysis, 2021

Figure 182: Global Vs. New Zealand Growth Comparison, 2021 to 2032

Figure 183: New Zealand Drug Formulation Market Share Analysis (%), By Dosage Form, 2021 to 2032

Figure 184: New Zealand Drug Formulation Market Share Analysis (%), By Indication, 2021 to 2032

Figure 185: New Zealand Drug Formulation Market Share Analysis (%), By End User, 2021 to 2032

Figure 186: Middle East & Africa Drug Formulation Market Value Share, By Dosage Form 2022 (E)

Figure 187: Middle East & Africa Drug Formulation Market Value Share, By Indication 2022 (E)

Figure 188: Middle East & Africa Drug Formulation Market Value Share, By End User 2022 (E)

Figure 189: Middle East & Africa Drug Formulation Market Value Share, By Region 2022 (E)

Figure 190: Middle East & Africa Drug Formulation Market Size (US$ Bn) Analysis, 2012 to 2021

Figure 191: Middle East & Africa Drug Formulation Market Size (US$ Bn) & Y-o-Y Growth (%) Analysis, 2022 to 2032

Figure 192: Middle East & Africa Drug Formulation Market Attractiveness Analysis, By Country

Figure 193: Middle East & Africa Drug Formulation Market Attractiveness Analysis, By Dosage Form

Figure 194: Middle East & Africa Drug Formulation Market Attractiveness, By Indication

Figure 195: Middle East & Africa Drug Formulation Market Attractiveness, By End User

Figure 196: GCC Countries Market Value Proportion Analysis, 2021

Figure 197: Global Vs. GCC Countries Growth Comparison, 2021 to 2032

Figure 198: GCC Countries Drug Formulation Market Share Analysis (%), By Dosage Form, 2021 to 2032

Figure 199: GCC Countries Drug Formulation Market Share Analysis (%), By Indication, 2021 to 2032

Figure 200: GCC Countries Drug Formulation Market Share Analysis (%), By End User, 2021 to 2032

Figure 201: Turkey Market Value Proportion Analysis, 2021

Figure 202: Global Vs. Turkey Growth Comparison, 2021 to 2032

Figure 203: Turkey Drug Formulation Market Share Analysis (%), By Dosage Form, 2021 to 2032

Figure 204: Turkey Drug Formulation Market Share Analysis (%), By Indication, 2021 to 2032

Figure 205: Turkey Drug Formulation Market Share Analysis (%), By End User, 2021 to 2032

Figure 206: Egypt Market Value Proportion Analysis, 2021

Figure 207: Global Vs. Egypt Growth Comparison, 2021 to 2032

Figure 208: Egypt Drug Formulation Market Share Analysis (%), By Dosage Form, 2021 to 2032

Figure 209: Egypt Drug Formulation Market Share Analysis (%), By Indication, 2021 to 2032

Figure 210: Egypt Drug Formulation Market Share Analysis (%), By End User, 2021 to 2032

Figure 211: South Africa Market Value Proportion Analysis, 2021

Figure 212: Global Vs. South Africa Growth Comparison, 2021 to 2032

Figure 213: South Africa Drug Formulation Market Share Analysis (%), By Dosage Form, 2021 to 2032

Figure 214: South Africa Drug Formulation Market Share Analysis (%), By Indication, 2021 to 2032

Figure 215: South Africa Drug Formulation Market Share Analysis (%), By End User, 2021 to 2032

Figure 216: North Africa Market Value Proportion Analysis, 2021

Figure 217: Global Vs. North Africa Growth Comparison, 2021 to 2032

Figure 218: North Africa Drug Formulation Market Share Analysis (%), By Dosage Form, 2021 to 2032

Figure 219: North Africa Drug Formulation Market Share Analysis (%), By Indication, 2021 to 2032

Figure 220: North Africa Drug Formulation Market Share Analysis (%), By End User, 2021 to 2032

Recommendations

Healthcare

Injectable Drug Delivery Market

Published : April 2024

Healthcare

Oral Solid Dosage Pharmaceutical Formulation Market

Published : March 2024

Healthcare

Empty Capsule Market

Published : January 2024

Healthcare

Topical Bioadhesives market

Published : July 2023

Explore Healthcare Insights

View Reports