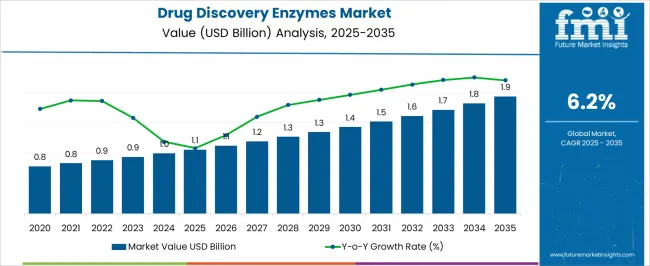
The Drug Discovery Enzymes Market is estimated to be valued at USD 1.1 billion in 2025 and is projected to reach USD 1.9 billion by 2035, registering a compound annual growth rate (CAGR) of 6.2% over the forecast period.

| Metric | Value |
|---|---|
| Drug Discovery Enzymes Market Estimated Value in (2025 E) | USD 1.1 billion |
| Drug Discovery Enzymes Market Forecast Value in (2035 F) | USD 1.9 billion |
| Forecast CAGR (2025 to 2035) | 6.2% |
The drug discovery enzymes market is progressing steadily, fueled by the increasing demand for precision medicine and rapid advancements in molecular biology. Industry journals and biopharmaceutical company updates have emphasized the growing importance of enzymes in target identification, lead optimization, and high-throughput screening processes. Enzymes such as kinases, polymerases, and proteases are being utilized extensively in preclinical and clinical drug discovery pipelines to accelerate therapeutic innovation.
Investments highlighted in annual reports of pharmaceutical companies have underscored significant funding in enzyme-based platforms to enhance assay sensitivity and reproducibility. In addition, the rising prevalence of chronic diseases and the urgent need for novel therapies have intensified the use of enzyme technologies in oncology, immunology, and metabolic disorders.
The market outlook remains optimistic as strategic collaborations between academic institutions and industry players strengthen enzyme validation and functional characterization. Future growth is expected to be supported by expanding adoption of enzyme engineering, AI-driven discovery platforms, and next-generation assays that streamline drug discovery workflows.

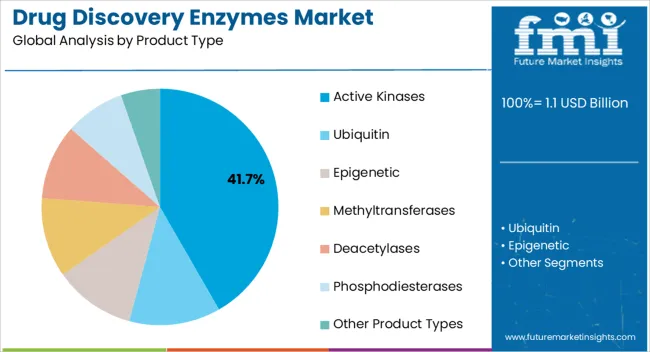
The Active Kinases segment is projected to capture 41.70% of the drug discovery enzymes market revenue in 2025, establishing itself as the leading product category. Growth in this segment has been supported by the pivotal role of kinases in cellular signaling pathways that regulate growth, differentiation, and apoptosis. Scientific publications have consistently identified kinases as high-value drug targets due to their direct involvement in cancer, inflammatory conditions, and neurological disorders.
The broad clinical relevance of kinase inhibitors has reinforced demand for reliable kinase assays in drug discovery research. Additionally, technological advancements in kinase profiling and assay design have improved the precision of target validation, reducing attrition rates in early-stage drug development.
Pharmaceutical pipelines remain heavily focused on kinase-related therapies, which has amplified the reliance on active kinase enzymes for screening and validation. These factors together are expected to sustain the leadership of the Active Kinases segment within the overall market.

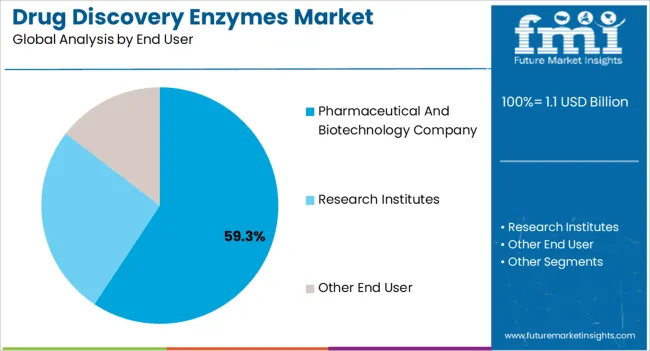
The Pharmaceutical and Biotechnology Company segment is projected to account for 59.30% of the drug discovery enzymes market revenue in 2025, reflecting its position as the primary end-user group. Growth of this segment has been driven by significant R&D investments in developing enzyme-based drug discovery platforms that improve success rates in clinical pipelines. Annual reports and investor presentations from leading pharmaceutical companies have highlighted the prioritization of enzyme assays to streamline preclinical studies and identify novel therapeutic targets.
Biotechnology firms have also played a key role by adopting enzyme technologies in niche therapeutic areas, supported by venture funding and collaborative research agreements. Furthermore, the increasing complexity of drug discovery, requiring multi-target validation and combinatorial screening, has reinforced the reliance on specialized enzymes within corporate R&D environments.
The segment’s strength has been further enhanced by global initiatives to accelerate innovation in oncology, rare diseases, and personalized medicine. With continued focus on efficiency and therapeutic breakthroughs, pharmaceutical and biotechnology companies are expected to remain the dominant users of drug discovery enzymes.
| Factors | Explanation |
|---|---|
| Research & Development | Companies in the pharmaceutical, biopharmaceutical, and medical device industries make significant investments in the creation of novel drugs and technologies that increase the adoption of drug discovery enzymes. However, in recent years, phase III and preclinical phases have received the lion's share of their funding. An increase in R&D spending is one of the main factors influencing the worldwide market. The need for various preclinical and clinical services during the drug discovery and development process motivates the growth. |
| Target Specific Drugs | As manufacturers use enzymes to create more relevant medications that target certain action areas, the market for drug discovery enzymes is anticipated to expand throughout the forecast period. Furthermore, to identify the R-ATA enzyme from soil bacteria, Kaneka Corporation and the University of Tokyo worked together in the biotechnology and development wing. |
| Innovations | The food business is using a finite amount of enzymes to extend food's shelf life and enhance flavor. MetXtra is a newly developed food enzyme in the market. The search for and production of novel enzymes for testing samples takes less time and money, thanks to this new enzyme. During the anticipated period, these factors are likely to drive the demand for drug discovery enzymes to rise. However, in recent years, research institutions have innovated and focused on drug discovery enzymes to expand application domains. |
Handling and safety hazards connected with enzymes and increased sensitivity to temperature and pH are expected to limit market expansion. Furthermore, high financial costs and difficulties in participant recruitment and retention slow down market growth.
Additionally, deficiencies in the clinical research workforce, drug sponsor-imposed barriers, and barriers related to clinical research globalization may all harm the market growth.
| Regional Market Comparison | Global Market Share in Percentage |
|---|---|
| North America | 42.7% |
| Europe | 22.2% |
Asia Pacific is expected to be the fastest-growing market during the forecast period. However, due to the introduction of novel enzymes used to treat various chronic illnesses and a rise in development strategies by leading companies, there is rising market growth in the region.
Furthermore, the region is growing rapidly due to the availability of highly skilled labor with low-cost charges and due to environmental regulations in recent years.
| Regional Market Comparison | Global Market Share in Percentage |
|---|---|
| United States | 38.1% |
| Germany | 4.7% |
| Japan | 5.2% |
Regarding pharmaceutical R&D investment, North America dominates the overall market during the forecast period. It is also the leading market for final dose formulations and bulk pharmaceuticals.
The market runs as a free economy, with transparent trading procedures and restrictions on anti-competitive behaviors. The region adopted high techniques with well-established infrastructure, which propelled the market growth in recent years.
The United States market is expected to become one of the primary competitors for biosimilars by 2024. Remicade, Enbrel, Rituximab, Adalimumab, Infliximab, Etanercept, Darbepoetin Alpha, and other key medications are available in the United States market. As a result of the aforementioned reasons, the market is expected to develop rapidly over the projected period.
| Regional Markets | CAGR (2025 to 2035) |
|---|---|
| United Kingdom | 4.5% |
| China | 7.8% |
| India | 6.4% |
| Australia | 5.7% |
Start-Ups Companies in the Drug Discovery Enzymes Market
To untangle the drug discovery process. Artificial intelligence and machine learning have given the pharmaceutical business new hope. AI tools enable researchers to develop innovative medications with the required features rapidly. Using these new methods, several businesses are developing innovative medicinal compounds. Some notable start-up companies are as follows:
| Category | By Product Type |
|---|---|
| Top Segment | Active Kinases |
| Market Share in Percentage | 18.5% |
| Category | By Therapeutic Ares |
|---|---|
| Top Segment | Oncology |
| Market Share in Percentage | 25.4% |

Various prominent players have been researching drug discovery enzymes in recent years. Pharmaceutical scientists are developing several drug enzymes that have helped to cure patients' critical diseases in recent years.
Some recent developments in the Drug Discovery Enzymes industry are as follows:
| Report Attribute | Details |
|---|---|
| Growth Rate | CAGR of 6.5% from 2025 to 2035 |
| Base Year for Estimation | 2025 |
| Historical Data | 2020 to 2025 |
| Forecast Period | 2025 to 2035 |
| Quantitative Units | Revenue in USD million and CAGR from 2025 to 2035 |
| Report Coverage | Revenue Forecast, Volume Forecast, Company Ranking, Competitive Landscape, Growth Factors, Trends, and Pricing Analysis |
| Segments Covered | Product Type, End User, Region |
| Regions Covered | North America; Latin America; East Asia; South Asia; Oceania; The Middle East and Africa |
| Key Countries Profiled | United States, Canada, Brazil, Argentina, Germany, United Kingdom, France, Spain, Italy, Nordics, BENELUX, Australia & New Zealand, China, India, ASEAN, GCC, South Africa |
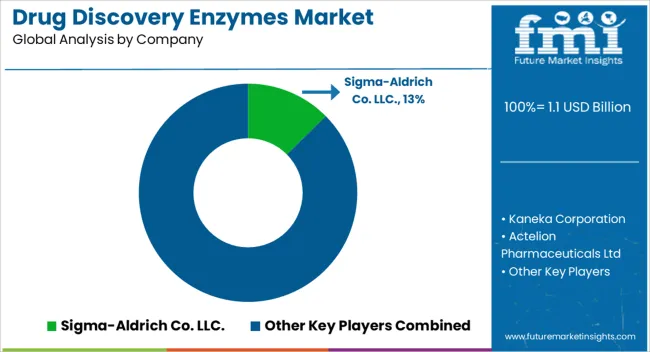
| Key Companies Profiled | Sigma-Aldrich Co. LLC.; Kaneka Corporation; Actelion Pharmaceuticals Ltd; Genesis Biotechnology Group; Suven Life Sciences Limited; Enzo Life Sciences, Inc.; Merck KGaA |
| Customization | Available Upon Request |
The global drug discovery enzymes market is estimated to be valued at USD 1.1 billion in 2025.
The market size for the drug discovery enzymes market is projected to reach USD 1.9 billion by 2035.
The drug discovery enzymes market is expected to grow at a 6.2% CAGR between 2025 and 2035.
The key product types in drug discovery enzymes market are active kinases, ubiquitin, epigenetic, methyltransferases, deacetylases, phosphodiesterases and other product types.
In terms of end user, pharmaceutical and biotechnology company segment to command 59.3% share in the drug discovery enzymes market in 2025.


Full Research Suite comprises of:
Market outlook & trends analysis
Interviews & case studies
Strategic recommendations
Vendor profiles & capabilities analysis
5-year forecasts
8 regions and 60+ country-level data splits
Market segment data splits
12 months of continuous data updates
DELIVERED AS:
PDF EXCEL ONLINE
Drug Taste Masking Technologies Market Forecast and Outlook 2025 to 2035
Drug-Gene Interaction Panels Market Size and Share Forecast Outlook 2025 to 2035
Drug Testing Systems Market Size and Share Forecast Outlook 2025 to 2035
Drug Tester Market Size and Share Forecast Outlook 2025 to 2035
Drug Device Combination Products Market Size and Share Forecast Outlook 2025 to 2035
Drug Integrated Polymer Fibers Market Size and Share Forecast Outlook 2025 to 2035
Drug Formulation Market Analysis - Size, Growth, & Forecast Outlook 2025 to 2035
Drug-Induced Dyskinesia Market Size and Share Forecast Outlook 2025 to 2035
Drug Free Depression Treatment Market Size and Share Forecast Outlook 2025 to 2035
Drug Delivery Technology Market is segmented by route of administration, and end user from 2025 to 2035
Drugs Glass Packaging Market Analysis - Size, Share, and Forecast Outlook 2025 to 2035
Drug Delivery Solutions Market Insights - Growth & Forecast 2025 to 2035
Drug Designing Tools Market Growth – Trends & Forecast 2025 to 2035
Drug of Abuse Testing Market Growth – Trends & Forecast 2025-2035
Drug-Induced Immune Hemolytic Anemia Market - Demand & Forecast 2025 to 2035
Drug Screening Market Overview - Trends, Demand & Forecast 2025 to 2035
Drug Eruptions Treatment Market - Innovations & Future Outlook 2025 to 2035
Drug Testing Equipment Market
Drug Resistant Pulmonary Tuberculosis Market
Drug Discovery Outsourcing Market Size and Share Forecast Outlook 2025 to 2035

Thank you!
You will receive an email from our Business Development Manager. Please be sure to check your SPAM/JUNK folder too.
Chat With
MaRIA