Drugs Glass Packaging Market Size & Share Forecast Outlook 2025 to 2035

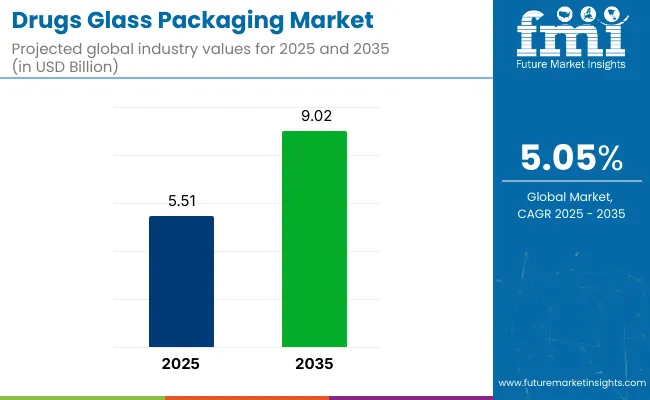
The global drugs glass packaging market will witness a steady rise, reaching nearly USD 9.02 billion by 2035, up from USD 5.51 billion in 2025. This growth, paced at a CAGR of 5.05%, is being fueled by pharmaceutical sector reliance on chemically inert and durable materials for injectable drug safety. With cartridges projected to account for 35% of all units and injection applications commanding half the market by 2025, the industry is leaning heavily on glass to meet evolving standards in biologics and vaccine delivery.
Drugs Glass Packaging Market Quick Stats

  • Market Value (2025): USD 5.51 billion
  • Forecast Value (2035): USD 9.02 billion
  • Forecast CAGR: 5.05%
  • Leading Segment in 2025: Cartridges (~35% share)
  • Key Growth Region: Asia Pacific (India)
  • Top Key Players: SCHOTT AG, Gerresheimer AG, NIPRO CORPORATION, SGD Pharma, West Pharmaceutical Services Inc.

Drugs Glass Packaging Market

Glass packaging continues to be preferred due to its chemical stability, inert nature, and superior protection against contamination, all of which are crucial for preserving the integrity of sensitive drugs. The expanding biopharmaceuticals sector, coupled with the rising demand for vaccines, will further fuel the adoption of glass packaging in the pharmaceutical industry.

The demand for glass packaging solutions is driven by the increasing need for sustainable and safe drug delivery systems. Growing concerns about plastic pollution and environmental impact are encouraging the shift toward glass packaging, a biodegradable and recyclable alternative. Additionally, regulatory compliance and global health initiatives are anticipated to further drive the demand for high-quality, secure packaging solutions for vaccines and injectables.

“We see an opportunity for the industry to improve drug filling quality and performance capabilities by transitioning to Corning’s coated vial technology,” said Olivier Rousseau, CEO of SGD Pharma. This statement underscores the growing trend of adopting next-generation glass vials, focusing on improving drug delivery precision and manufacturing efficiency. As the industry continues to evolve, sustainability and regulatory compliance will play pivotal roles in shaping the future of drug glass packaging, contributing to the industry's steady growth through 2035.

Analyzing Drugs Glass Packaging Market by Top Investment Segments

The industry is projected to grow with significant investments in cartridges, injection applications, and borosilicate glass, driven by the increasing demand for safe and efficient pharmaceutical packaging solutions.

Cartridges are projected to lead demand for drug glass packaging in 2025, with a 35% share.

Cartridges are expected to account for 35% of the share in 2025. Their use in secure drug delivery systems for injectable medications is crucial, especially in managing chronic diseases.

  • Cartridges are widely adopted for pre-filled syringes and auto-injectors, benefiting from features like ease of use, precise dosage, and reliability. The increasing demand for biologic drugs, particularly for diabetes and autoimmune treatments, has driven the adoption of cartridge-based packaging.
  • Leading companies, such as SCHOTT and Gerresheimer, are making significant investments to enhance the design and functionality of cartridges, ensuring better patient compliance and safety. These innovations aim to reduce contamination risks and meet evolving regulatory and healthcare standards globally.

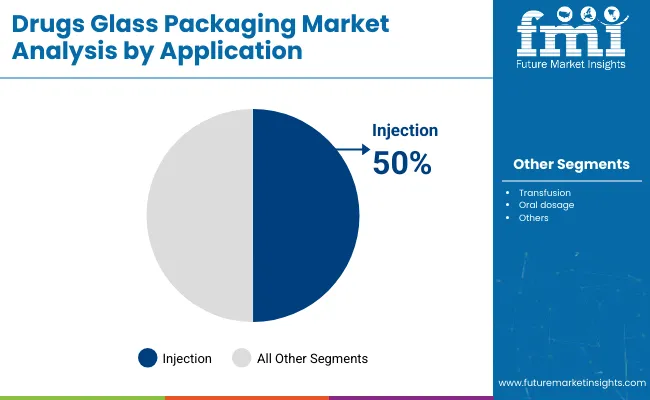
Injection applications are expected to dominate the industry with a 50% share by 2025

Injection applications are projected to account for 50% of the industry share in 2025. Glass containers, including vials, ampoules, and pre-filled syringes, are preferred for injectable pharmaceuticals due to their resistance to chemical reactions and ability to preserve the integrity of sensitive formulations.
Drugs Glass Packaging Market Analysis By Application

  • The demand for injectable biologics, vaccines, and other therapeutics has led to a higher adoption of glass packaging.
  • Prominent pharmaceutical companies, such as Pfizer and Bayer, rely on glass packaging to ensure the safety and efficacy of injectable drugs. The ability of glass to prevent leaching and contamination makes it an essential material in injection-based drug delivery.

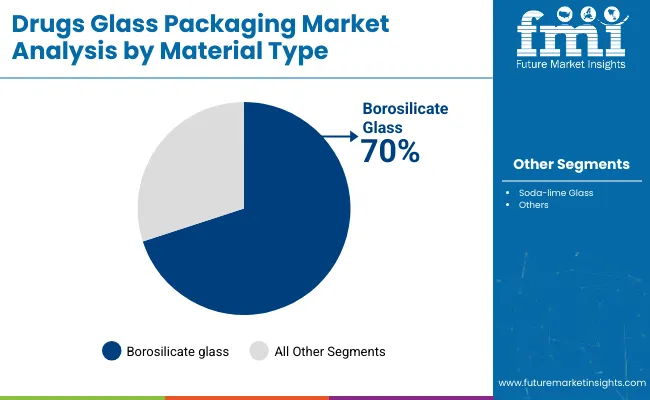
Borosilicate glass is expected to hold 70% of the industry share by material type in 2025

Borosilicate glass is anticipated to hold 70% of the industry share by 2025, due to its unique properties such as high resistance to thermal shock, chemical durability, and non-reactivity with drugs. This makes borosilicate glass ideal for packaging sensitive medications, particularly biologics and injectables.
Drugs Glass Packaging Market Analysis By Material Type

  • Borosilicate is widely used in producing vials, ampoules, and syringes, offering protection against contamination and ensuring the safety of drug formulations.
  • Leading companies like Corning and Schott are continuously advancing borosilicate glass production to meet the growing demand for pharmaceutical packaging. The material's superior qualities make it the preferred choice in the industry.

Top Drugs Glass Packaging Market Dynamics

The industry is driven by rising demand for injectable medicines and biologic treatments. However, regulatory challenges and cost pressures are limiting industry growth and accessibility.

Increasing demand for injectable medicines is driving industry growth

The demand for injectable medicines is being significantly boosted by the rising prevalence of chronic diseases and the growing need for biologic treatments. Glass packaging, known for its chemical resistance and ability to maintain drug stability, is being increasingly preferred for packaging injectables.

Pharmaceutical companies are increasingly seeking reliable and safe packaging solutions to ensure the efficacy and safety of injectable drugs. This trend is driving the growth of the industry, as injectable drugs require packaging materials that provide durability and protect from external contamination.

Regulatory challenges and cost pressures are limiting industry expansion

The industry is being faced with challenges related to stringent regulatory requirements and cost pressures. Compliance with regulations governing the safety and quality of pharmaceutical packaging requires continuous investment in quality control and certification processes.

Additionally, the high cost of raw materials and manufacturing processes is impacting the affordability of glass packaging solutions. These factors are limiting the accessibility of glass packaging, particularly for small and medium-sized pharmaceutical manufacturers, and may hinder broader industry expansion. Overcoming these challenges is essential for supporting long-term industry growth.

Analyzing Top Countries Manufacturing, Distributing, and Supplying Drugs Glass Packaging

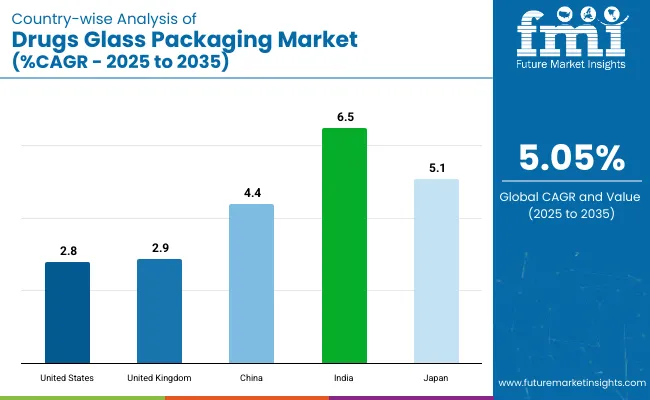
The industry is expected to experience steady growth through 2035. This growth is driven by rising demand for durable and safe pharmaceutical packaging solutions. Industrialization in China and India is contributing significantly to industry growth, while innovation in packaging materials and sustainability is being emphasized in mature industries such as the United States and the United Kingdom.

Countries CAGR (2025 to 2035)
United States 2.8%
United Kingdom 2.9%
China 4.4%
India 6.5%
Japan 5.1%

Country Wise Analysis Of Drugs Glass Packaging Market

United States Drugs Glass Packaging Market Driven by Safety and Durability

The United States industry is expected to grow at a CAGR of 2.8% through 2035. Growth is supported by rising demand for tamper-proof, durable packaging solutions that maintain the integrity of pharmaceuticals.

  • Innovation in glass packaging technologies is being driven by companies like Corning, SGD Pharma, and Piramal Glass. These companies focus on enhancing product safety, stability, and sustainability.
  • Government regulations and consumer awareness of product quality are contributing to the industry’s growth. Demand for eco-friendly materials and packaging solutions that meet stringent safety standards is expected to sustain industry growth.

United Kingdom Drugs Glass Packaging Market Focused on Innovation and Sustainability

The United Kingdom industry is projected to grow at a CAGR of 2.9% through 2035. This growth is driven by the increasing need for high-quality packaging solutions in the pharmaceutical sector and the growing demand for eco-friendly alternatives.

  • Companies like Gerresheimer, SGD Pharma, and Stoelzle Glass are advancing glass packaging technologies to ensure better protection and shelf life for pharmaceutical products.
  • Sustainability concerns are leading to greater emphasis on recyclable materials and eco-friendly solutions. Government policies aimed at supporting packaging safety and promoting sustainability are further accelerating industry growth in the UK.

China Drugs Glass Packaging Market Expanding with Industrialization and Pharmaceutical Demand

The industry is expected to grow at a CAGR of 4.4% through 2035. Rapid industrialization and rising pharmaceutical production are driving the demand for packaging solutions that ensure drug safety.

  • Leading companies such as Zhejiang Glass, Piramal Glass, and China National Pharmaceutical Group (Sinopharm) are heavily investing in developing advanced glass packaging technologies.
  • Government policies focusing on improving pharmaceutical safety and packaging standards are accelerating the adoption of glass packaging solutions. The expanding pharmaceutical sector and the increase in exports are contributing significantly to the growing demand for durable and secure glass packaging solutions in China.

India Drugs Glass Packaging Market Growing with Pharmaceutical Industry Expansion

The industry is expected to grow at a CAGR of 6.5% through 2035. Growth is being driven by the expanding pharmaceutical industry and the increasing production of generic drugs.

  • Demand for packaging solutions that meet international standards is rising. Companies like Bormioli Pharma, SGD Pharma, and Piramal Glass are expanding their production capacities and improving packaging quality to meet industry needs.
  • The Indian government’s focus on strengthening the pharmaceutical industry and enhancing packaging standards is supporting industry growth. Increased export demand for pharmaceuticals is also accelerating the adoption of high-quality glass packaging solutions in India.

Japan Drugs Glass Packaging Market Driven by Technological Advancements and Safety Standards

The industry is projected to grow at a CAGR of 5.1% through 2035. Growth is supported by the country’s advanced pharmaceutical sector, which focuses heavily on drug safety and packaging quality.

  • Companies such as Nipro Corporation, Gerresheimer, and SGD Pharma are advancing packaging technologies that enhance product safety, integrity, and shelf life.
  • Government regulations mandating high-quality packaging and an increasing emphasis on pharmaceutical safety are sustaining industry demand. Innovations in glass manufacturing processes, alongside a greater focus on environmental sustainability, are contributing to the steady growth of the industry in Japan.

Leading Suppliers in the Drug Glass Packaging Market

The global industry is characterized by a diverse range of suppliers. Key players like Schott AG and Gerresheimer AG hold dominant positions due to their extensive product portfolios, technological advancements, and strong global presence in the pharmaceutical, biotechnology, and healthcare sectors.

Other prominent players, such as Corning Incorporated and Stevanato Group, cater to specialized industries, offering durable and innovative packaging solutions for sensitive drug formulations. Emerging companies like Nipro Corporation and PGP Glass target regional industries with cost-effective and niche product offerings.

Recent Drugs Glass Packaging Industry News

  • In December 2024, Gerresheimer announced the acquisition of Blitz LuxCo Sarl, the parent company of Bormioli Pharma Group, an Italian leader in primary pharmaceutical packaging. This move expands Gerresheimer's production footprint in Europe.
  • In 2025, Corning's Valor Glass, a robust aluminosilicate glass, received FDA approval and played a crucial role in COVID-19 vaccine distribution, bolstered by funding from the White House’s Operation Warp Speed to expand its manufacturing capacity.

Leading Companies in the Drug Glass Packaging Market

  • Schott AG
  • Gerresheimer AG
  • Owens-Illinois, Inc.
  • Ardagh Group S.A.
  • Nipro Corporation
  • West Pharmaceutical Services, Inc.
  • Stevanato Group (Ompi)
  • Sisecam Group
  • DWK Life Sciences GmbH
  • Beatson Clark Ltd.
  • Piramal Glass Limited
  • Acme Vial and Glass Company, LLC
  • Wheaton BrasilVidros.
  • SGD Pharma
  • Hindusthan National Glass & Industries Limited
  • Bormioli Pharma Srl
  • Agrado S.A.
  • Corning Incorporated
  • Wiegand-Glas
  • Stölzle Glass Group

Research Coverage and Scope Summary

Report Attributes Details
Current Total Market Size (2025) USD 5.51 billion
Projected Market Size (2035) USD 9.02 billion
CAGR (2025 to 2035) 5.05%
Base Year for Estimation 2024
Historical Period 2020 to 2024
Projections Period 2025 to 2035
Quantitative Units USD billion for value, million for units sold
Types Analyzed (Segment 1) Cartridges; Vials; Ampoules; Syringes
Applications Covered (Segment 2) Injection, Transfusion, Oral dosage forms
Materials Covered (Segment 3) Borosilicate glass; Soda-lime glass
Regions Covered North America; Europe; Asia Pacific; Latin America; Middle East & Africa
Countries Covered United States; Canada, United Kingdom; Germany; France; Italy; Spain; Netherlands, China; India; Japan; South Korea; Australia, Brazil; Mexico; Argentina, Saudi Arabia; UAE; South Africa; Egypt; Turkey
Key Players Influencing the Industry SCHOTT AG; Gerresheimer AG; NIPRO CORPORATION; SGD Pharma; West Pharmaceutical Services Inc.; PGP Glass; Ajanta Bottle Pvt. Ltd.; Becton, Dickinson and Company; Amcor; Berry Global; Borosil
Additional Attributes Dollar sales by product type (cartridges, vials, ampoules, syringes); Regional trends in glass packaging for pharmaceuticals; Adoption of borosilicate glass vs soda-lime glass; Technological innovations in pharmaceutical packaging

Key Segmentation

By Type:

The industry is segmented into cartridges, vials, ampoules, and syringes.

By Application:

The industry includes injection, transfusion, and oral dosage forms.

By Material:

The industry covers borosilicate glass and soda-lime glass.

By Region:

The industry spans North America, Europe, Asia Pacific, Latin America, and the Middle East & Africa.

Table of Content

  1. Executive Summary
  2. Market Overview
  3. Market Background
  4. Global Market Analysis 2020 to 2024 and Forecast, 2025 to 2035
  5. Global Market Pricing Analysis 2020 to 2024 and Forecast 2025 to 2035
  6. Global Market Analysis 2020 to 2024 and Forecast 2025 to 2035, By Type
    • Cartridges
    • Vials
    • Ampoules
    • Syringes
  7. Global Market Analysis 2020 to 2024 and Forecast 2025 to 2035, By Application
    • Injection
    • Transfusion
    • Oral Dosage Forms
  8. Global Market Analysis 2020 to 2024 and Forecast 2025 to 2035, By Material
    • Borosilicate Glass
    • Soda-lime Glass
  9. Global Market Analysis 2020 to 2024 and Forecast 2025 to 2035, By Region
    • North America
    • Latin America
    • Western Europe
    • Eastern Europe
    • East Asia
    • South Asia & Pacific
    • Middle East and Africa
  10. North America Market Analysis 2020 to 2024 and Forecast 2025 to 2035, By Country
  11. Latin America Market Analysis 2020 to 2024 and Forecast 2025 to 2035, By Country
  12. Western Europe Market Analysis 2020 to 2024 and Forecast 2025 to 2035, By Country
  13. Eastern Europe Market Analysis 2020 to 2024 and Forecast 2025 to 2035, By Country
  14. East Asia Market Analysis 2020 to 2024 and Forecast 2025 to 2035, By Country
  15. South Asia & Pacific Market Analysis 2020 to 2024 and Forecast 2025 to 2035, By Country
  16. Middle East and Africa Market Analysis 2020 to 2024 and Forecast 2025 to 2035, By Country
  17. Key Countries Market Analysis
  18. Market Structure Analysis
  19. Competition Analysis
    • Gerresheimer AG
    • Owens-Illinois, Inc.
    • Ardagh Group S.A.
    • Nipro Corporation
    • West Pharmaceutical Services, Inc.
    • Stevanato Group (Ompi)
    • Sisecam Group
    • DWK Life Sciences GmbH
    • Beatson Clark Ltd.
    • Piramal Glass Limited
    • Acme Vial and Glass Company, LLC
    • Wheaton Brasil Vidros
    • SGD Pharma
    • Hindusthan National Glass & Industries Limited
    • Bormioli Pharma Srl
    • Agrado S.A.
    • Corning Incorporated
    • Wiegand-Glas
    • Stölzle Glass Group
  20. Assumptions & Acronyms Used
  21. Research Methodology

List of Tables

  • Table 1: Global Market Value (USD Billion) Forecast by Region, 2020 to 2035
  • Table 2: Global Market Volume (Million units) Forecast by Region, 2020 to 2035
  • Table 3: Global Market Value (USD Billion) Forecast by Type, 2020 to 2035
  • Table 4: Global Market Volume (Million units) Forecast by Type, 2020 to 2035
  • Table 5: Global Market Value (USD Billion) Forecast by Application, 2020 to 2035
  • Table 6: Global Market Volume (Million units) Forecast by Application, 2020 to 2035
  • Table 7: Global Market Value (USD Billion) Forecast by Material, 2020 to 2035
  • Table 8: Global Market Volume (Million units) Forecast by Material, 2020 to 2035
  • Table 9: North America Market Value (USD Billion) Forecast by Country, 2020 to 2035
  • Table 10: North America Market Volume (Million units) Forecast by Country, 2020 to 2035
  • Table 11: North America Market Value (USD Billion) Forecast by Type, 2020 to 2035
  • Table 12: North America Market Volume (Million units) Forecast by Type, 2020 to 2035
  • Table 13: North America Market Value (USD Billion) Forecast by Application, 2020 to 2035
  • Table 14: North America Market Volume (Million units) Forecast by Application, 2020 to 2035
  • Table 15: North America Market Value (USD Billion) Forecast by Material, 2020 to 2035
  • Table 16: North America Market Volume (Million units) Forecast by Material, 2020 to 2035
  • Table 17: Latin America Market Value (USD Billion) Forecast by Country, 2020 to 2035
  • Table 18: Latin America Market Volume (Million units) Forecast by Country, 2020 to 2035
  • Table 19: Latin America Market Value (USD Billion) Forecast by Type, 2020 to 2035
  • Table 20: Latin America Market Volume (Million units) Forecast by Type, 2020 to 2035
  • Table 21: Latin America Market Value (USD Billion) Forecast by Application, 2020 to 2035
  • Table 22: Latin America Market Volume (Million units) Forecast by Application, 2020 to 2035
  • Table 23: Latin America Market Value (USD Billion) Forecast by Material, 2020 to 2035
  • Table 24: Latin America Market Volume (Million units) Forecast by Material, 2020 to 2035
  • Table 25: Western Europe Market Value (USD Billion) Forecast by Country, 2020 to 2035
  • Table 26: Western Europe Market Volume (Million units) Forecast by Country, 2020 to 2035
  • Table 27: Western Europe Market Value (USD Billion) Forecast by Type, 2020 to 2035
  • Table 28: Western Europe Market Volume (Million units) Forecast by Type, 2020 to 2035
  • Table 29: Western Europe Market Value (USD Billion) Forecast by Application, 2020 to 2035
  • Table 30: Western Europe Market Volume (Million units) Forecast by Application, 2020 to 2035
  • Table 31: Western Europe Market Value (USD Billion) Forecast by Material, 2020 to 2035
  • Table 32: Western Europe Market Volume (Million units) Forecast by Material, 2020 to 2035
  • Table 33: Eastern Europe Market Value (USD Billion) Forecast by Country, 2020 to 2035
  • Table 34: Eastern Europe Market Volume (Million units) Forecast by Country, 2020 to 2035
  • Table 35: Eastern Europe Market Value (USD Billion) Forecast by Type, 2020 to 2035
  • Table 36: Eastern Europe Market Volume (Million units) Forecast by Type, 2020 to 2035
  • Table 37: Eastern Europe Market Value (USD Billion) Forecast by Application, 2020 to 2035
  • Table 38: Eastern Europe Market Volume (Million units) Forecast by Application, 2020 to 2035
  • Table 39: Eastern Europe Market Value (USD Billion) Forecast by Material, 2020 to 2035
  • Table 40: Eastern Europe Market Volume (Million units) Forecast by Material, 2020 to 2035
  • Table 41: East Asia Market Value (USD Billion) Forecast by Country, 2020 to 2035
  • Table 42: East Asia Market Volume (Million units) Forecast by Country, 2020 to 2035
  • Table 43: East Asia Market Value (USD Billion) Forecast by Type, 2020 to 2035
  • Table 44: East Asia Market Volume (Million units) Forecast by Type, 2020 to 2035
  • Table 45: East Asia Market Value (USD Billion) Forecast by Application, 2020 to 2035
  • Table 46: East Asia Market Volume (Million units) Forecast by Application, 2020 to 2035
  • Table 47: East Asia Market Value (USD Billion) Forecast by Material, 2020 to 2035
  • Table 48: East Asia Market Volume (Million units) Forecast by Material, 2020 to 2035
  • Table 49: South Asia & Pacific Market Value (USD Billion) Forecast by Country, 2020 to 2035
  • Table 50: South Asia & Pacific Market Volume (Million units) Forecast by Country, 2020 to 2035
  • Table 51: South Asia & Pacific Market Value (USD Billion) Forecast by Type, 2020 to 2035
  • Table 52: South Asia & Pacific Market Volume (Million units) Forecast by Type, 2020 to 2035
  • Table 53: South Asia & Pacific Market Value (USD Billion) Forecast by Application, 2020 to 2035
  • Table 54: South Asia & Pacific Market Volume (Million units) Forecast by Application, 2020 to 2035
  • Table 55: South Asia & Pacific Market Value (USD Billion) Forecast by Material, 2020 to 2035
  • Table 56: South Asia & Pacific Market Volume (Million units) Forecast by Material, 2020 to 2035
  • Table 57: Middle East and Africa Market Value (USD Billion) Forecast by Country, 2020 to 2035
  • Table 58: Middle East and Africa Market Volume (Million units) Forecast by Country, 2020 to 2035
  • Table 59: Middle East and Africa Market Value (USD Billion) Forecast by Type, 2020 to 2035
  • Table 60: Middle East and Africa Market Volume (Million units) Forecast by Type, 2020 to 2035
  • Table 61: Middle East and Africa Market Value (USD Billion) Forecast by Application, 2020 to 2035
  • Table 62: Middle East and Africa Market Volume (Million units) Forecast by Application, 2020 to 2035
  • Table 63: Middle East and Africa Market Value (USD Billion) Forecast by Material, 2020 to 2035
  • Table 64: Middle East and Africa Market Volume (Million units) Forecast by Material, 2020 to 2035

List of Figures

  • Figure 1: Global Market Volume (Million units) Forecast 2020 to 2035
  • Figure 2: Global Market Pricing Analysis
  • Figure 3: Global Market Value (USD Billion) Forecast 2020 to 2035
  • Figure 4: Global Market Value Share and BPS Analysis by Type, 2025 and 2035
  • Figure 5: Global Market Y-o-Y Growth Comparison by Type, 2025 to 2035
  • Figure 6: Global Market Attractiveness Analysis by Type
  • Figure 7: Global Market Value Share and BPS Analysis by Application, 2025 and 2035
  • Figure 8: Global Market Y-o-Y Growth Comparison by Application, 2025 to 2035
  • Figure 9: Global Market Attractiveness Analysis by Application
  • Figure 10: Global Market Value Share and BPS Analysis by Material, 2025 and 2035
  • Figure 11: Global Market Y-o-Y Growth Comparison by Material, 2025 to 2035
  • Figure 12: Global Market Attractiveness Analysis by Material
  • Figure 13: Global Market Value (USD Billion) Share and BPS Analysis by Region, 2025 and 2035
  • Figure 14: Global Market Y-o-Y Growth Comparison by Region, 2025 to 2035
  • Figure 15: Global Market Attractiveness Analysis by Region
  • Figure 16: North America Market Incremental USD Opportunity, 2025 to 2035
  • Figure 17: Latin America Market Incremental USD Opportunity, 2025 to 2035
  • Figure 18: Western Europe Market Incremental USD Opportunity, 2025 to 2035
  • Figure 19: Eastern Europe Market Incremental USD Opportunity, 2025 to 2035
  • Figure 20: East Asia Market Incremental USD Opportunity, 2025 to 2035
  • Figure 21: South Asia & Pacific Market Incremental USD Opportunity, 2025 to 2035
  • Figure 22: Middle East and Africa Market Incremental USD Opportunity, 2025 to 2035
  • Figure 23: North America Market Value Share and BPS Analysis by Country, 2025 and 2035
  • Figure 24: North America Market Value Share and BPS Analysis by Type, 2025 and 2035
  • Figure 25: North America Market Y-o-Y Growth Comparison by Type, 2025 to 2035
  • Figure 26: North America Market Attractiveness Analysis by Type
  • Figure 27: North America Market Value Share and BPS Analysis by Application, 2025 and 2035
  • Figure 28: North America Market Y-o-Y Growth Comparison by Application, 2025 to 2035
  • Figure 29: North America Market Attractiveness Analysis by Application
  • Figure 30: North America Market Value Share and BPS Analysis by Material, 2025 and 2035
  • Figure 31: North America Market Y-o-Y Growth Comparison by Material, 2025 to 2035
  • Figure 32: North America Market Attractiveness Analysis by Material
  • Figure 33: Latin America Market Value Share and BPS Analysis by Country, 2025 and 2035
  • Figure 34: Latin America Market Value Share and BPS Analysis by Type, 2025 and 2035
  • Figure 35: Latin America Market Y-o-Y Growth Comparison by Type, 2025 to 2035
  • Figure 36: Latin America Market Attractiveness Analysis by Type
  • Figure 37: Latin America Market Value Share and BPS Analysis by Application, 2025 and 2035
  • Figure 38: Latin America Market Y-o-Y Growth Comparison by Application, 2025 to 2035
  • Figure 39: Latin America Market Attractiveness Analysis by Application
  • Figure 40: Latin America Market Value Share and BPS Analysis by Material, 2025 and 2035
  • Figure 41: Latin America Market Y-o-Y Growth Comparison by Material, 2025 to 2035
  • Figure 42: Latin America Market Attractiveness Analysis by Material
  • Figure 43: Western Europe Market Value Share and BPS Analysis by Country, 2025 and 2035
  • Figure 44: Western Europe Market Value Share and BPS Analysis by Type, 2025 and 2035
  • Figure 45: Western Europe Market Y-o-Y Growth Comparison by Type, 2025 to 2035
  • Figure 46: Western Europe Market Attractiveness Analysis by Type
  • Figure 47: Western Europe Market Value Share and BPS Analysis by Application, 2025 and 2035
  • Figure 48: Western Europe Market Y-o-Y Growth Comparison by Application, 2025 to 2035
  • Figure 49: Western Europe Market Attractiveness Analysis by Application
  • Figure 50: Western Europe Market Value Share and BPS Analysis by Material, 2025 and 2035
  • Figure 51: Western Europe Market Y-o-Y Growth Comparison by Material, 2025 to 2035
  • Figure 52: Western Europe Market Attractiveness Analysis by Material
  • Figure 53: Eastern Europe Market Value Share and BPS Analysis by Country, 2025 and 2035
  • Figure 54: Eastern Europe Market Value Share and BPS Analysis by Type, 2025 and 2035
  • Figure 55: Eastern Europe Market Y-o-Y Growth Comparison by Type, 2025 to 2035
  • Figure 56: Eastern Europe Market Attractiveness Analysis by Type
  • Figure 57: Eastern Europe Market Value Share and BPS Analysis by Application, 2025 and 2035
  • Figure 58: Eastern Europe Market Y-o-Y Growth Comparison by Application, 2025 to 2035
  • Figure 59: Eastern Europe Market Attractiveness Analysis by Application
  • Figure 60: Eastern Europe Market Value Share and BPS Analysis by Material, 2025 and 2035
  • Figure 61: Eastern Europe Market Y-o-Y Growth Comparison by Material, 2025 to 2035
  • Figure 62: Eastern Europe Market Attractiveness Analysis by Material
  • Figure 63: East Asia Market Value Share and BPS Analysis by Country, 2025 and 2035
  • Figure 64: East Asia Market Value Share and BPS Analysis by Type, 2025 and 2035
  • Figure 65: East Asia Market Y-o-Y Growth Comparison by Type, 2025 to 2035
  • Figure 66: East Asia Market Attractiveness Analysis by Type
  • Figure 67: East Asia Market Value Share and BPS Analysis by Application, 2025 and 2035
  • Figure 68: East Asia Market Y-o-Y Growth Comparison by Application, 2025 to 2035
  • Figure 69: East Asia Market Attractiveness Analysis by Application
  • Figure 70: East Asia Market Value Share and BPS Analysis by Material, 2025 and 2035
  • Figure 71: East Asia Market Y-o-Y Growth Comparison by Material, 2025 to 2035
  • Figure 72: East Asia Market Attractiveness Analysis by Material
  • Figure 73: South Asia & Pacific Market Value Share and BPS Analysis by Country, 2025 and 2035
  • Figure 74: South Asia & Pacific Market Value Share and BPS Analysis by Type, 2025 and 2035
  • Figure 75: South Asia & Pacific Market Y-o-Y Growth Comparison by Type, 2025 to 2035

Frequently Asked Questions

What is the projected size of the drugs glass packaging market by 2035?

The industry is expected to reach USD 9.02 billion by 2035.

What is the estimated size of the drugs glass packaging market in 2025?

The industry size is projected to be USD 5.51 billion in 2025.

What is the CAGR of the drugs glass packaging market from 2025 to 2035?

The industry is expected to grow at a CAGR of 5.05%.

Who are the key suppliers in the drugs glass packaging market?

Key suppliers include SCHOTT AG, Gerresheimer AG, NIPRO CORPORATION, SGD Pharma, West Pharmaceutical Services Inc., PGP Glass, Ajanta Bottle Pvt. Ltd., Becton, Dickinson and Company, Amcor, Berry Global, and Borosil.

What factors are driving the growth of the drugs glass packaging market?

Growth is driven by the increasing demand for drugs packaging, safety, and product integrity in the healthcare industry.

Explore Healthcare Packaging Insights

Future Market Insights

Drugs Glass Packaging Market