Antiviral Drugs Market
Market Survey on Antiviral Drugs Market Covering Sales Outlook, Up-to-date Key Trends, Market Size and Forecast, Per Capita Expenditure, Company Share, Brand Share, Regulations, Reimbursement Scenario, Epidemiology, Procedure Numbers, and Pipeline Assessment
An In-depth Market Insights of Antiviral Drugs Market including Hepatitis-C antivirals, HIV antivirals, Herpes antivirals, Hepatitis-B antivirals, and Influenza antivirals Covering 30+ Countries like United States, United Kingdom, Germany, France, Norway, Sweden, Saudi Arabia, United Arab Emirates, Japan, Korea, Australia, New Zealand, and Others
Antiviral Drugs Market Outlook
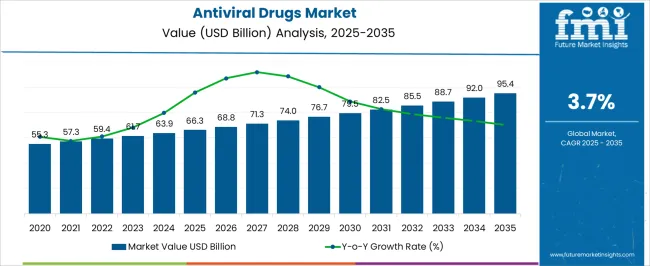
The antiviral drugs market is anticipated to flourish at an average CAGR of 3.9% between 2023 and 2033. The market is expected to hold a market share of US$ 89.68 billion by 2033, while the market is likely to reach a value of US$ 61.42 billion in 2023.
Attributes | Details |
---|---|
Antiviral Drugs Market CAGR (2023 to 2033) | 3.9% |
Antiviral Drugs Market Size (2023) | US$ 61.42 billion |
Antiviral Drugs Market Size (2033) | US$ 89.68 billion |
Antiviral drugs are medicines that are used especially for treating viral infections. Most antiviral drugs are used for particular viral infections, similar to antibiotics, while a broad-spectrum antiviral drug is effective against a varied range of viruses. Antiviral drugs do not kill their target pathogen. Instead, they inhibit the development of those viruses.
The global antiviral drugs market is projected to register a moderate growth rate in the pharmaceutical market and is anticipated to increase due to a rise in awareness level, an increase in the diseased population, and the introduction of new drugs with improved efficacy.
Some key patents are reaching their expiry during the forecast periods, such as Combivir, Sustiva, Tenofovir, Tamiflu, Relenza, and Telbivudine. The patent expiries of these blockbuster drugs are expected to trigger generic competition in the antiviral therapeutics market, making the market more competitive.
The late-stage pipeline drugs are expected to enter the market, positively impacting the market. Most antivirals are considered comparatively harmless to the host and therefore are used to treat infections. They are different from viricides, which are not used for medication but can destroy or deactivate virus particles outside or inside the body. Antiviral drugs are used in the treatment of patients suffering from herpes viruses, HIV, influenza A and B viruses, and hepatitis B and C viruses.
Don't pay for what you don't need
Customize your report by selecting specific countries or regions and save 30%!
Antiviral Drugs Demand Analysis (2018 to 2022) Vs Market Outlook (2023 to 2033)
The global demand for antiviral drugs is projected to increase at a CAGR of 3.9% during the forecast period between 2023 and 2033, reaching a total of US$ 89.68 billion in 2033, according to a report from Future Market Insights (FMI). From 2018 to 2022, sales witnessed significant growth, registering a CAGR of 3.8%.
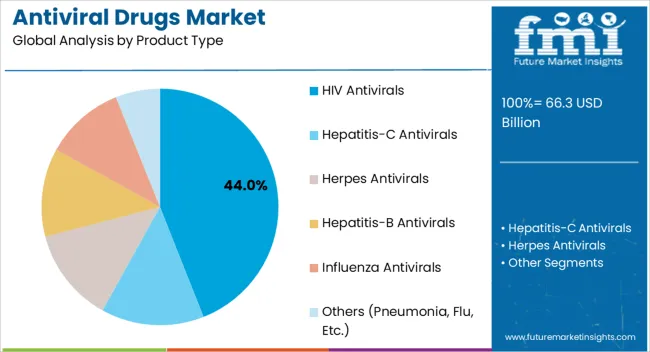
During the historical outlook, the biggest driver of the overall antiviral drugs market was Human Immunodeficiency Virus/Acquired Immune Deficiency Syndrome (HIV/AIDS) therapeutic sales, which accounted for more than half the share of the market in 2021. According to WHO, in 2021, several patients living with HIV are 38.4 million, and 650k people acquired the disease in the same year.
Nearly four out of five people were freshly put on treatment in sub-Saharan Africa. In 21 African countries with a high burden of HIV, two out of three people in need are receiving treatment, and two out of three positive pregnant women are receiving antiretroviral drugs to prevent HIV transmission to their infants. The introduction of solid R&D activities, newer and advanced treatments, and formulations, such as vaccines and combination therapy, are projected to fuel the market growth of antiviral drugs over the forecast period.
Which Drivers underpin Antiviral Drugs Industry Expansion?
The increasing commonness of viral infections such as HIV, Herpes, Influenza, and others is expected to upsurge the demand for antiviral medicines throughout the forecast period. For instance, according to UNAIDS, in 2020, more than 37 billion individuals were living with HIV across the globe. Out of these, around 1.5 billion new people acquired HIV infection in 2020. Overall, the COVID-19 pandemic has pointedly accelerated the market growth in 2021, whereas a negative impact of the pandemic has been detected for other applications of antiviral drugs.
Owing to solid R&D activities, newer and advanced treatments, and formulations, such as vaccines, combination therapy, and others, are being introduced in the market, and the demand is anticipated to upsurge. Hence, strong R&D is one of the crucial factors in the antiviral drugs market growth.
Which Factors are limiting the Growth of the Antiviral Drugs Market?
Several factors hampering the market expansion of Antiviral Drugs include the high risk of failure, the high cost of R&D and therapy, and government austerity. However, the swelling usage of natural products and the high cost of developing drugs are the market's key challenges.
Country-wise Insights
Country | Revenue Share % (2022) |
---|---|
United States | 7.1% |
Germany | 5.8% |
Japan | 6.4% |
North America | 38.7% |
Europe | 24.9% |
Country | CAGR % (2023 to 2033) |
---|---|
China | 4.7% |
India | 3.8% |
United Kingdom | 2.7% |
Australia | 3.4% |
North America Holds a Significant Position in the Global Antiviral Drugs Market
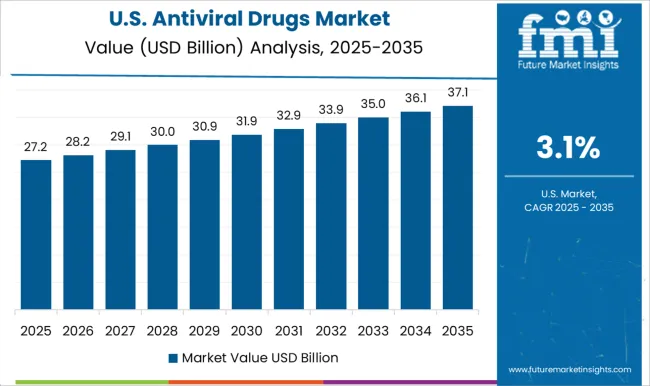
In terms of market contribution, North America acquired the leading share in revenue collection across the globe, accounting for a 38.7% share in 2022. As per the recent analysis by Future Market Insights, the region is anticipated to maintain its dominance during the assessment period 2022-2032. The United States and Canada are estimated to be the leading shareholders in regional revenue generation.
The market decline can be attributed to the loss of market exclusivity of patented drugs, mounting vaccination rates against viral infections, and government initiatives to minimize the prevalence of viral infections.
For instance, the United States government is responsible for several measures, including funding and grants in infectious diseases programs and encouraging the R&D activities of innovative therapies to manage viral infections.
How Growth of the European Antiviral Drugs Market May Unfold?
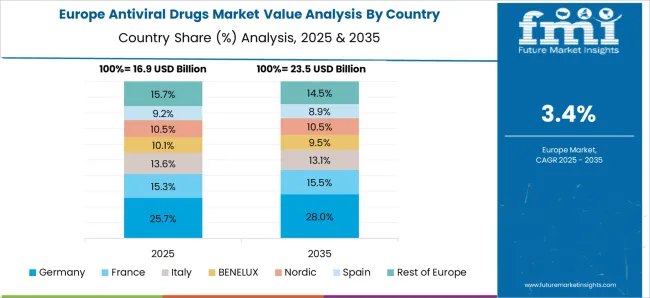
Based on the geographies, European is the second-leading region, acquiring a 24.9% share in the antiviral drugs market. During the forecast period, the region is estimated to witness moderate growth, backed by soaring investments in the development of new drugs and therapies. This market growth is also attributed to the easy approval and promising healthcare policies by several governments.
In April 2022, European Medicines Agency, the European Union's drug regulator, signed off on emergency usage of Merck's Covid antiviral pill for adults who get tested positive as it prepares to decide on full approval by the year's end.
In July 2021, GSK and Vir announced a Joint Procurement Agreement (JPA) with the European Commission to supply up to 220,000 doses of sotrovimab. Following the grant of the marketing authorization in the EU, Member States participating in the JPA can now order sotrovimab to support their pandemic responses. These initiatives are likely to fuel the market growth of Antiviral Drugs in the coming years.
How is the APAC Region Bolstering the Demand for Antiviral Drugs?
In the Asia Pacific, the market for antiviral drugs is anticipated to witness the fastest growth rate throughout the forecast period. The market's exponential growth can be attributed to the rising prevalence and treatment rate of viral infections, emerging healthcare infrastructure in the region, and growing awareness among people regarding infectious diseases.
Besides, the strong presence of generic pharmaceutical manufacturing companies in India, China, and other South Asian countries and the rising geriatric population in the region are some principal driving factors of the segment.
The introduction of new and innovative strategies in emerging economies is also likely to boost the demand for Antiviral Drugs over the coming decade.
Get the data you need at a Fraction of the cost
Personalize your report by choosing insights you need
and save 40%!
Category Analysis
Category | By Application Type |
---|---|
Leading Segment | HIV |
Market Share (2022) | 44.0% |
Category | By End Use |
---|---|
Leading Segment | Hospitals |
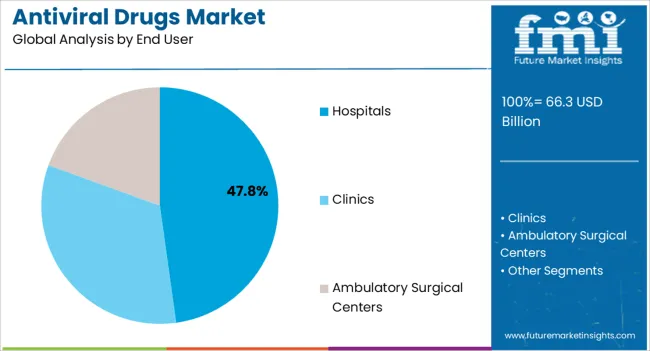
Market Share (2022) | 47.80% |
By Application, Which Antiviral Drugs Category May Remain Prominent?
The global antiviral drugs market is segmented based on product type and end user. The HIV segment captured the majority share in terms of market revenue generation and held the leading revenue share of 44.0% in 2022.
The segment is projected to observe the fastest growth rate over the forecast period. The rising prevalence of HIV infection associated with a high treatment rate, availability of branded drugs, and government initiatives to upsurge the treatment rate is projected to stimulate the market at a higher growth rate.
For instance, in 2019, the United States government introduced the Ending the HIV Epidemic (EHE) plan to end the HIV epidemic in the country by 2032. The initiative seeks to decrease HIV infections and enhance the diagnosis and treatment rate in the United States. Furthermore, the existence of strong pipeline drugs for HIV infection may also fuel market growth throughout the conjecture period.
The hepatitis segment held the second-leading revenue share in 2021. Escalating vaccination against hepatitis A and B is affecting the growth adversely. Besides, the COVID-19 pandemic has significantly augmented the growth of the other segment in 2020.
The Start-up Ecosystem: How Key Players Are Opening Frontiers for Future Growth?
- Founded in 2010, New American Therapeutics is a United States-based specialty pharmaceutical company. The company acquires, markets, and develops therapeutic products for infectious diseases. It develops Denavir, a topical antiviral drug for the treatment of recurrent herpes labialis in adults and children 12 years of age and older. Denavir was acquired from Novartis in 2010
- Founded in 2009, Adaptive Biotechnologies is a United States-based provider of clinical diagnostics and drug discovery for immune diseases. The company's immune profiling sequencing technology, immunoSEQ, enables the characterization of the immune system, helping scientists & clinicians in research and drug development. The company also offers clonoSEQ for monitoring Minimal Residual Disease (MRD) in blood-based cancers. Also, develops cell therapies, vaccines, and antibody molecules for infectious diseases.
Competitive Landscape
Recent Developments:
- In May 2022, Cipla Limited, in partnership with Genes2Me Pvt. Ltd., announced the commercialization of the 'RT-Direct' multiplex COVID-19 RT PCR Test kit in India. Cipla is increasing its diagnostics portfolio in an attempt to take more innovative and innovative solutions to the market.
- In May 2022, Abbott reached an agreement with the Food and Drug Administration on Monday to reopen the company's manufacturing plant in Michigan to help ease a nationwide shortage of baby formula after the facility was closed due to bacterial contamination.
- In March 2022, Scripps Research, non-profit research and technology drug discovery organization, and AbbVie Inc. established a strategic collaboration to investigate novel, immediate antiviral treatments for COVID-19.
- The European Commission has approved Roche's Xofluza for the advanced treatment of influenza. The commission has approved the single dose for patients.
- Gilead has introduced Veklury for pediatric patients that are hospitalized and not hospitalized.
Key Players
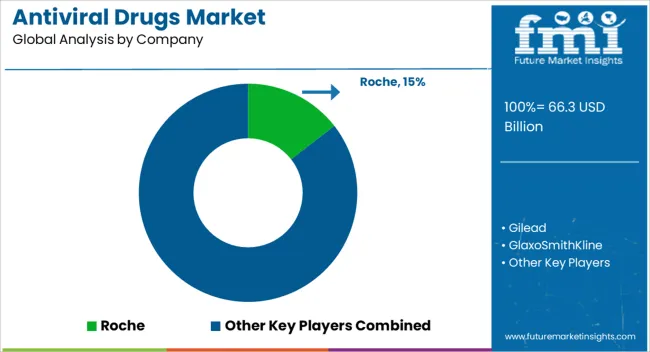
- Roche
- Gilead
- GlaxoSmithKline
- Bristol-Myers-Squibb
- Abbott
- AstraZeneca
- Cipla
- Bayer AG
- Johnson & Johnson
- Merck & Co
- AbbVie
- Aurobindo Pharma
- Dr. Reddy’s Laboratories Ltd.
Key Segments Covered
By Product type:
- Hepatitis-C antivirals
- HIV antivirals
- Herpes antivirals
- Hepatitis-B antivirals
- Influenza antivirals
- Others (Pneumonia, Flu, etc.)
By End User:
- Hospitals
- Clinics
- Ambulatory Surgical Centers
Key Regions Covered:
- North America
- United States
- Canada
- Latin America
- Brazil
- Mexico
- Rest of Latin America
- Europe
- Germany
- United Kingdom
- France
- Spain
- Russia
- Rest of Europe
- Japan
- Asia Pacific Excluding Japan
- China
- India
- Malaysia
- Singapore
- Australia
- Rest of Asia Pacific Excluding Japan (APEJ)
- The Middle East and Africa
- GCC Countries
- Israel
- South Africa
- Middle East and Africa (MEA)
Frequently Asked Questions
How Big is the Antiviral Drugs market?
The market is valued at US$ 61.42 billion in 2023.
Who are the key Antiviral Drugs Market Players?
AstraZeneca, Cipla, Bayer AG are the key market players.
What is the Growth Potential of the Antiviral Drugs Market?
The growth potential of the market is 3.9% through 2033.
What is the Projected Market Value 2033?
The market is estimated to reach US$ 89.68 billion by 2033.
How is the Historical Performance of the Market?
The market registered a CAGR of 3.8% from 2018 to 2022.
Table of Content
1. Executive Summary 1.1. Global Market Outlook 1.2. Demand-side Trends 1.3. Supply-side Trends 1.4. Technology Roadmap Analysis 1.5. Analysis and Recommendations 2. Market Overview 2.1. Market Coverage / Taxonomy 2.2. Market Definition / Scope / Limitations 3. Market Background 3.1. Market Dynamics 3.1.1. Drivers 3.1.2. Restraints 3.1.3. Opportunity 3.1.4. Trends 3.2. Scenario Forecast 3.2.1. Demand in Optimistic Scenario 3.2.2. Demand in Likely Scenario 3.2.3. Demand in Conservative Scenario 3.3. Opportunity Map Analysis 3.4. Investment Feasibility Matrix 3.5. PESTLE and Porter’s Analysis 3.6. Regulatory Landscape 3.6.1. By Key Regions 3.6.2. By Key Countries 3.7. Regional Parent Market Outlook 4. Global Market Analysis 2018 to 2022 and Forecast, 2023 to 2033 4.1. Historical Market Size Value (US$ Million) Analysis, 2018 to 2022 4.2. Current and Future Market Size Value (US$ Million) Projections, 2023 to 2033 4.2.1. Y-o-Y Growth Trend Analysis 4.2.2. Absolute $ Opportunity Analysis 5. Global Market Analysis 2018 to 2022 and Forecast 2023 to 2033, By Product type 5.1. Introduction / Key Findings 5.2. Historical Market Size Value (US$ Million) Analysis By Product type, 2018 to 2022 5.3. Current and Future Market Size Value (US$ Million) Analysis and Forecast By Product type, 2023 to 2033 5.3.1. Hepatitis-C antivirals 5.3.2. HIV antivirals 5.3.3. Herpes antivirals 5.3.4. Hepatitis-B antivirals 5.3.5. Influenza antivirals 5.3.6. Others 5.4. Y-o-Y Growth Trend Analysis By Product type, 2018 to 2022 5.5. Absolute $ Opportunity Analysis By Product type, 2023 to 2033 6. Global Market Analysis 2018 to 2022 and Forecast 2023 to 2033, By End-user 6.1. Introduction / Key Findings 6.2. Historical Market Size Value (US$ Million) Analysis By End-user, 2018 to 2022 6.3. Current and Future Market Size Value (US$ Million) Analysis and Forecast By End-user, 2023 to 2033 6.3.1. Hospitals 6.3.2. Clinics 6.3.3. Ambulatory Surgical Centers 6.4. Y-o-Y Growth Trend Analysis By End-user, 2018 to 2022 6.5. Absolute $ Opportunity Analysis By End-user, 2023 to 2033 7. Global Market Analysis 2018 to 2022 and Forecast 2023 to 2033, By Region 7.1. Introduction 7.2. Historical Market Size Value (US$ Million) Analysis By Region, 2018 to 2022 7.3. Current Market Size Value (US$ Million) Analysis and Forecast By Region, 2023 to 2033 7.3.1. North America 7.3.2. Latin America 7.3.3. Western Europe 7.3.4. Eastern Europe 7.3.5. South Asia and Pacific 7.3.6. East Asia 7.3.7. Middle East and Africa 7.4. Market Attractiveness Analysis By Region 8. North America Market Analysis 2018 to 2022 and Forecast 2023 to 2033, By Country 8.1. Historical Market Size Value (US$ Million) Trend Analysis By Market Taxonomy, 2018 to 2022 8.2. Market Size Value (US$ Million) Forecast By Market Taxonomy, 2023 to 2033 8.2.1. By Country 8.2.1.1. U.S. 8.2.1.2. Canada 8.2.2. By Product type 8.2.3. By End-user 8.3. Market Attractiveness Analysis 8.3.1. By Country 8.3.2. By Product type 8.3.3. By End-user 8.4. Key Takeaways 9. Latin America Market Analysis 2018 to 2022 and Forecast 2023 to 2033, By Country 9.1. Historical Market Size Value (US$ Million) Trend Analysis By Market Taxonomy, 2018 to 2022 9.2. Market Size Value (US$ Million) Forecast By Market Taxonomy, 2023 to 2033 9.2.1. By Country 9.2.1.1. Brazil 9.2.1.2. Mexico 9.2.1.3. Rest of Latin America 9.2.2. By Product type 9.2.3. By End-user 9.3. Market Attractiveness Analysis 9.3.1. By Country 9.3.2. By Product type 9.3.3. By End-user 9.4. Key Takeaways 10. Western Europe Market Analysis 2018 to 2022 and Forecast 2023 to 2033, By Country 10.1. Historical Market Size Value (US$ Million) Trend Analysis By Market Taxonomy, 2018 to 2022 10.2. Market Size Value (US$ Million) Forecast By Market Taxonomy, 2023 to 2033 10.2.1. By Country 10.2.1.1. Germany 10.2.1.2. U.K. 10.2.1.3. France 10.2.1.4. Spain 10.2.1.5. Italy 10.2.1.6. Rest of Western Europe 10.2.2. By Product type 10.2.3. By End-user 10.3. Market Attractiveness Analysis 10.3.1. By Country 10.3.2. By Product type 10.3.3. By End-user 10.4. Key Takeaways 11. Eastern Europe Market Analysis 2018 to 2022 and Forecast 2023 to 2033, By Country 11.1. Historical Market Size Value (US$ Million) Trend Analysis By Market Taxonomy, 2018 to 2022 11.2. Market Size Value (US$ Million) Forecast By Market Taxonomy, 2023 to 2033 11.2.1. By Country 11.2.1.1. Poland 11.2.1.2. Russia 11.2.1.3. Czech Republic 11.2.1.4. Romania 11.2.1.5. Rest of Eastern Europe 11.2.2. By Product type 11.2.3. By End-user 11.3. Market Attractiveness Analysis 11.3.1. By Country 11.3.2. By Product type 11.3.3. By End-user 11.4. Key Takeaways 12. South Asia and Pacific Market Analysis 2018 to 2022 and Forecast 2023 to 2033, By Country 12.1. Historical Market Size Value (US$ Million) Trend Analysis By Market Taxonomy, 2018 to 2022 12.2. Market Size Value (US$ Million) Forecast By Market Taxonomy, 2023 to 2033 12.2.1. By Country 12.2.1.1. India 12.2.1.2. Bangladesh 12.2.1.3. Australia 12.2.1.4. New Zealand 12.2.1.5. Rest of South Asia and Pacific 12.2.2. By Product type 12.2.3. By End-user 12.3. Market Attractiveness Analysis 12.3.1. By Country 12.3.2. By Product type 12.3.3. By End-user 12.4. Key Takeaways 13. East Asia Market Analysis 2018 to 2022 and Forecast 2023 to 2033, By Country 13.1. Historical Market Size Value (US$ Million) Trend Analysis By Market Taxonomy, 2018 to 2022 13.2. Market Size Value (US$ Million) Forecast By Market Taxonomy, 2023 to 2033 13.2.1. By Country 13.2.1.1. China 13.2.1.2. Japan 13.2.1.3. South Korea 13.2.2. By Product type 13.2.3. By End-user 13.3. Market Attractiveness Analysis 13.3.1. By Country 13.3.2. By Product type 13.3.3. By End-user 13.4. Key Takeaways 14. Middle East and Africa Market Analysis 2018 to 2022 and Forecast 2023 to 2033, By Country 14.1. Historical Market Size Value (US$ Million) Trend Analysis By Market Taxonomy, 2018 to 2022 14.2. Market Size Value (US$ Million) Forecast By Market Taxonomy, 2023 to 2033 14.2.1. By Country 14.2.1.1. GCC Countries 14.2.1.2. South Africa 14.2.1.3. Israel 14.2.1.4. Rest of MEA 14.2.2. By Product type 14.2.3. By End-user 14.3. Market Attractiveness Analysis 14.3.1. By Country 14.3.2. By Product type 14.3.3. By End-user 14.4. Key Takeaways 15. Key Countries Market Analysis 15.1. U.S. 15.1.1. Pricing Analysis 15.1.2. Market Share Analysis, 2022 15.1.2.1. By Product type 15.1.2.2. By End-user 15.2. Canada 15.2.1. Pricing Analysis 15.2.2. Market Share Analysis, 2022 15.2.2.1. By Product type 15.2.2.2. By End-user 15.3. Brazil 15.3.1. Pricing Analysis 15.3.2. Market Share Analysis, 2022 15.3.2.1. By Product type 15.3.2.2. By End-user 15.4. Mexico 15.4.1. Pricing Analysis 15.4.2. Market Share Analysis, 2022 15.4.2.1. By Product type 15.4.2.2. By End-user 15.5. Germany 15.5.1. Pricing Analysis 15.5.2. Market Share Analysis, 2022 15.5.2.1. By Product type 15.5.2.2. By End-user 15.6. U.K. 15.6.1. Pricing Analysis 15.6.2. Market Share Analysis, 2022 15.6.2.1. By Product type 15.6.2.2. By End-user 15.7. France 15.7.1. Pricing Analysis 15.7.2. Market Share Analysis, 2022 15.7.2.1. By Product type 15.7.2.2. By End-user 15.8. Spain 15.8.1. Pricing Analysis 15.8.2. Market Share Analysis, 2022 15.8.2.1. By Product type 15.8.2.2. By End-user 15.9. Italy 15.9.1. Pricing Analysis 15.9.2. Market Share Analysis, 2022 15.9.2.1. By Product type 15.9.2.2. By End-user 15.10. Poland 15.10.1. Pricing Analysis 15.10.2. Market Share Analysis, 2022 15.10.2.1. By Product type 15.10.2.2. By End-user 15.11. Russia 15.11.1. Pricing Analysis 15.11.2. Market Share Analysis, 2022 15.11.2.1. By Product type 15.11.2.2. By End-user 15.12. Czech Republic 15.12.1. Pricing Analysis 15.12.2. Market Share Analysis, 2022 15.12.2.1. By Product type 15.12.2.2. By End-user 15.13. Romania 15.13.1. Pricing Analysis 15.13.2. Market Share Analysis, 2022 15.13.2.1. By Product type 15.13.2.2. By End-user 15.14. India 15.14.1. Pricing Analysis 15.14.2. Market Share Analysis, 2022 15.14.2.1. By Product type 15.14.2.2. By End-user 15.15. Bangladesh 15.15.1. Pricing Analysis 15.15.2. Market Share Analysis, 2022 15.15.2.1. By Product type 15.15.2.2. By End-user 15.16. Australia 15.16.1. Pricing Analysis 15.16.2. Market Share Analysis, 2022 15.16.2.1. By Product type 15.16.2.2. By End-user 15.17. New Zealand 15.17.1. Pricing Analysis 15.17.2. Market Share Analysis, 2022 15.17.2.1. By Product type 15.17.2.2. By End-user 15.18. China 15.18.1. Pricing Analysis 15.18.2. Market Share Analysis, 2022 15.18.2.1. By Product type 15.18.2.2. By End-user 15.19. Japan 15.19.1. Pricing Analysis 15.19.2. Market Share Analysis, 2022 15.19.2.1. By Product type 15.19.2.2. By End-user 15.20. South Korea 15.20.1. Pricing Analysis 15.20.2. Market Share Analysis, 2022 15.20.2.1. By Product type 15.20.2.2. By End-user 15.21. GCC Countries 15.21.1. Pricing Analysis 15.21.2. Market Share Analysis, 2022 15.21.2.1. By Product type 15.21.2.2. By End-user 15.22. South Africa 15.22.1. Pricing Analysis 15.22.2. Market Share Analysis, 2022 15.22.2.1. By Product type 15.22.2.2. By End-user 15.23. Israel 15.23.1. Pricing Analysis 15.23.2. Market Share Analysis, 2022 15.23.2.1. By Product type 15.23.2.2. By End-user 16. Market Structure Analysis 16.1. Competition Dashboard 16.2. Competition Benchmarking 16.3. Market Share Analysis of Top Players 16.3.1. By Regional 16.3.2. By Product type 16.3.3. By End-user 17. Competition Analysis 17.1. Competition Deep Dive 17.1.1. Roche 17.1.1.1. Overview 17.1.1.2. Product Portfolio 17.1.1.3. Profitability by Market Segments 17.1.1.4. Sales Footprint 17.1.1.5. Strategy Overview 17.1.1.5.1. Marketing Strategy 17.1.2. Gilead 17.1.2.1. Overview 17.1.2.2. Product Portfolio 17.1.2.3. Profitability by Market Segments 17.1.2.4. Sales Footprint 17.1.2.5. Strategy Overview 17.1.2.5.1. Marketing Strategy 17.1.3. GlaxoSmithKline 17.1.3.1. Overview 17.1.3.2. Product Portfolio 17.1.3.3. Profitability by Market Segments 17.1.3.4. Sales Footprint 17.1.3.5. Strategy Overview 17.1.3.5.1. Marketing Strategy 17.1.4. Bristol-Myers-Squibb 17.1.4.1. Overview 17.1.4.2. Product Portfolio 17.1.4.3. Profitability by Market Segments 17.1.4.4. Sales Footprint 17.1.4.5. Strategy Overview 17.1.4.5.1. Marketing Strategy 17.1.5. Abbott 17.1.5.1. Overview 17.1.5.2. Product Portfolio 17.1.5.3. Profitability by Market Segments 17.1.5.4. Sales Footprint 17.1.5.5. Strategy Overview 17.1.5.5.1. Marketing Strategy 17.1.6. AstraZeneca 17.1.6.1. Overview 17.1.6.2. Product Portfolio 17.1.6.3. Profitability by Market Segments 17.1.6.4. Sales Footprint 17.1.6.5. Strategy Overview 17.1.6.5.1. Marketing Strategy 17.1.7. Cipla 17.1.7.1. Overview 17.1.7.2. Product Portfolio 17.1.7.3. Profitability by Market Segments 17.1.7.4. Sales Footprint 17.1.7.5. Strategy Overview 17.1.7.5.1. Marketing Strategy 17.1.8. Bayer AG 17.1.8.1. Overview 17.1.8.2. Product Portfolio 17.1.8.3. Profitability by Market Segments 17.1.8.4. Sales Footprint 17.1.8.5. Strategy Overview 17.1.8.5.1. Marketing Strategy 17.1.9. Johnson & Johnson 17.1.9.1. Overview 17.1.9.2. Product Portfolio 17.1.9.3. Profitability by Market Segments 17.1.9.4. Sales Footprint 17.1.9.5. Strategy Overview 17.1.9.5.1. Marketing Strategy 17.1.10. Merck & Co 17.1.10.1. Overview 17.1.10.2. Product Portfolio 17.1.10.3. Profitability by Market Segments 17.1.10.4. Sales Footprint 17.1.10.5. Strategy Overview 17.1.10.5.1. Marketing Strategy 17.1.11. AbbVie 17.1.11.1. Overview 17.1.11.2. Product Portfolio 17.1.11.3. Profitability by Market Segments 17.1.11.4. Sales Footprint 17.1.11.5. Strategy Overview 17.1.11.5.1. Marketing Strategy 17.1.12. Aurobindo Pharma 17.1.12.1. Overview 17.1.12.2. Product Portfolio 17.1.12.3. Profitability by Market Segments 17.1.12.4. Sales Footprint 17.1.12.5. Strategy Overview 17.1.12.5.1. Marketing Strategy 17.1.13. Dr. Reddy’s Laboratories Ltd. 17.1.13.1. Overview 17.1.13.2. Product Portfolio 17.1.13.3. Profitability by Market Segments 17.1.13.4. Sales Footprint 17.1.13.5. Strategy Overview 17.1.13.5.1. Marketing Strategy 18. Assumptions & Acronyms Used 19. Research Methodology
Don't pay for what you don't need
Customize your report by selecting specific countries or regions and save 30%!
List of Tables
Table 1: Global Market Value (US$ Million) Forecast by Region, 2018 to 2033 Table 2: Global Market Value (US$ Million) Forecast by Product type, 2018 to 2033 Table 3: Global Market Value (US$ Million) Forecast by End-user, 2018 to 2033 Table 4: North America Market Value (US$ Million) Forecast by Country, 2018 to 2033 Table 5: North America Market Value (US$ Million) Forecast by Product type, 2018 to 2033 Table 6: North America Market Value (US$ Million) Forecast by End-user, 2018 to 2033 Table 7: Latin America Market Value (US$ Million) Forecast by Country, 2018 to 2033 Table 8: Latin America Market Value (US$ Million) Forecast by Product type, 2018 to 2033 Table 9: Latin America Market Value (US$ Million) Forecast by End-user, 2018 to 2033 Table 10: Western Europe Market Value (US$ Million) Forecast by Country, 2018 to 2033 Table 11: Western Europe Market Value (US$ Million) Forecast by Product type, 2018 to 2033 Table 12: Western Europe Market Value (US$ Million) Forecast by End-user, 2018 to 2033 Table 13: Eastern Europe Market Value (US$ Million) Forecast by Country, 2018 to 2033 Table 14: Eastern Europe Market Value (US$ Million) Forecast by Product type, 2018 to 2033 Table 15: Eastern Europe Market Value (US$ Million) Forecast by End-user, 2018 to 2033 Table 16: South Asia and Pacific Market Value (US$ Million) Forecast by Country, 2018 to 2033 Table 17: South Asia and Pacific Market Value (US$ Million) Forecast by Product type, 2018 to 2033 Table 18: South Asia and Pacific Market Value (US$ Million) Forecast by End-user, 2018 to 2033 Table 19: East Asia Market Value (US$ Million) Forecast by Country, 2018 to 2033 Table 20: East Asia Market Value (US$ Million) Forecast by Product type, 2018 to 2033 Table 21: East Asia Market Value (US$ Million) Forecast by End-user, 2018 to 2033 Table 22: Middle East and Africa Market Value (US$ Million) Forecast by Country, 2018 to 2033 Table 23: Middle East and Africa Market Value (US$ Million) Forecast by Product type, 2018 to 2033 Table 24: Middle East and Africa Market Value (US$ Million) Forecast by End-user, 2018 to 2033
List of Charts
Figure 1: Global Market Value (US$ Million) by Product type, 2023 to 2033 Figure 2: Global Market Value (US$ Million) by End-user, 2023 to 2033 Figure 3: Global Market Value (US$ Million) by Region, 2023 to 2033 Figure 4: Global Market Value (US$ Million) Analysis by Region, 2018 to 2033 Figure 5: Global Market Value Share (%) and BPS Analysis by Region, 2023 to 2033 Figure 6: Global Market Y-o-Y Growth (%) Projections by Region, 2023 to 2033 Figure 7: Global Market Value (US$ Million) Analysis by Product type, 2018 to 2033 Figure 8: Global Market Value Share (%) and BPS Analysis by Product type, 2023 to 2033 Figure 9: Global Market Y-o-Y Growth (%) Projections by Product type, 2023 to 2033 Figure 10: Global Market Value (US$ Million) Analysis by End-user, 2018 to 2033 Figure 11: Global Market Value Share (%) and BPS Analysis by End-user, 2023 to 2033 Figure 12: Global Market Y-o-Y Growth (%) Projections by End-user, 2023 to 2033 Figure 13: Global Market Attractiveness by Product type, 2023 to 2033 Figure 14: Global Market Attractiveness by End-user, 2023 to 2033 Figure 15: Global Market Attractiveness by Region, 2023 to 2033 Figure 16: North America Market Value (US$ Million) by Product type, 2023 to 2033 Figure 17: North America Market Value (US$ Million) by End-user, 2023 to 2033 Figure 18: North America Market Value (US$ Million) by Country, 2023 to 2033 Figure 19: North America Market Value (US$ Million) Analysis by Country, 2018 to 2033 Figure 20: North America Market Value Share (%) and BPS Analysis by Country, 2023 to 2033 Figure 21: North America Market Y-o-Y Growth (%) Projections by Country, 2023 to 2033 Figure 22: North America Market Value (US$ Million) Analysis by Product type, 2018 to 2033 Figure 23: North America Market Value Share (%) and BPS Analysis by Product type, 2023 to 2033 Figure 24: North America Market Y-o-Y Growth (%) Projections by Product type, 2023 to 2033 Figure 25: North America Market Value (US$ Million) Analysis by End-user, 2018 to 2033 Figure 26: North America Market Value Share (%) and BPS Analysis by End-user, 2023 to 2033 Figure 27: North America Market Y-o-Y Growth (%) Projections by End-user, 2023 to 2033 Figure 28: North America Market Attractiveness by Product type, 2023 to 2033 Figure 29: North America Market Attractiveness by End-user, 2023 to 2033 Figure 30: North America Market Attractiveness by Country, 2023 to 2033 Figure 31: Latin America Market Value (US$ Million) by Product type, 2023 to 2033 Figure 32: Latin America Market Value (US$ Million) by End-user, 2023 to 2033 Figure 33: Latin America Market Value (US$ Million) by Country, 2023 to 2033 Figure 34: Latin America Market Value (US$ Million) Analysis by Country, 2018 to 2033 Figure 35: Latin America Market Value Share (%) and BPS Analysis by Country, 2023 to 2033 Figure 36: Latin America Market Y-o-Y Growth (%) Projections by Country, 2023 to 2033 Figure 37: Latin America Market Value (US$ Million) Analysis by Product type, 2018 to 2033 Figure 38: Latin America Market Value Share (%) and BPS Analysis by Product type, 2023 to 2033 Figure 39: Latin America Market Y-o-Y Growth (%) Projections by Product type, 2023 to 2033 Figure 40: Latin America Market Value (US$ Million) Analysis by End-user, 2018 to 2033 Figure 41: Latin America Market Value Share (%) and BPS Analysis by End-user, 2023 to 2033 Figure 42: Latin America Market Y-o-Y Growth (%) Projections by End-user, 2023 to 2033 Figure 43: Latin America Market Attractiveness by Product type, 2023 to 2033 Figure 44: Latin America Market Attractiveness by End-user, 2023 to 2033 Figure 45: Latin America Market Attractiveness by Country, 2023 to 2033 Figure 46: Western Europe Market Value (US$ Million) by Product type, 2023 to 2033 Figure 47: Western Europe Market Value (US$ Million) by End-user, 2023 to 2033 Figure 48: Western Europe Market Value (US$ Million) by Country, 2023 to 2033 Figure 49: Western Europe Market Value (US$ Million) Analysis by Country, 2018 to 2033 Figure 50: Western Europe Market Value Share (%) and BPS Analysis by Country, 2023 to 2033 Figure 51: Western Europe Market Y-o-Y Growth (%) Projections by Country, 2023 to 2033 Figure 52: Western Europe Market Value (US$ Million) Analysis by Product type, 2018 to 2033 Figure 53: Western Europe Market Value Share (%) and BPS Analysis by Product type, 2023 to 2033 Figure 54: Western Europe Market Y-o-Y Growth (%) Projections by Product type, 2023 to 2033 Figure 55: Western Europe Market Value (US$ Million) Analysis by End-user, 2018 to 2033 Figure 56: Western Europe Market Value Share (%) and BPS Analysis by End-user, 2023 to 2033 Figure 57: Western Europe Market Y-o-Y Growth (%) Projections by End-user, 2023 to 2033 Figure 58: Western Europe Market Attractiveness by Product type, 2023 to 2033 Figure 59: Western Europe Market Attractiveness by End-user, 2023 to 2033 Figure 60: Western Europe Market Attractiveness by Country, 2023 to 2033 Figure 61: Eastern Europe Market Value (US$ Million) by Product type, 2023 to 2033 Figure 62: Eastern Europe Market Value (US$ Million) by End-user, 2023 to 2033 Figure 63: Eastern Europe Market Value (US$ Million) by Country, 2023 to 2033 Figure 64: Eastern Europe Market Value (US$ Million) Analysis by Country, 2018 to 2033 Figure 65: Eastern Europe Market Value Share (%) and BPS Analysis by Country, 2023 to 2033 Figure 66: Eastern Europe Market Y-o-Y Growth (%) Projections by Country, 2023 to 2033 Figure 67: Eastern Europe Market Value (US$ Million) Analysis by Product type, 2018 to 2033 Figure 68: Eastern Europe Market Value Share (%) and BPS Analysis by Product type, 2023 to 2033 Figure 69: Eastern Europe Market Y-o-Y Growth (%) Projections by Product type, 2023 to 2033 Figure 70: Eastern Europe Market Value (US$ Million) Analysis by End-user, 2018 to 2033 Figure 71: Eastern Europe Market Value Share (%) and BPS Analysis by End-user, 2023 to 2033 Figure 72: Eastern Europe Market Y-o-Y Growth (%) Projections by End-user, 2023 to 2033 Figure 73: Eastern Europe Market Attractiveness by Product type, 2023 to 2033 Figure 74: Eastern Europe Market Attractiveness by End-user, 2023 to 2033 Figure 75: Eastern Europe Market Attractiveness by Country, 2023 to 2033 Figure 76: South Asia and Pacific Market Value (US$ Million) by Product type, 2023 to 2033 Figure 77: South Asia and Pacific Market Value (US$ Million) by End-user, 2023 to 2033 Figure 78: South Asia and Pacific Market Value (US$ Million) by Country, 2023 to 2033 Figure 79: South Asia and Pacific Market Value (US$ Million) Analysis by Country, 2018 to 2033 Figure 80: South Asia and Pacific Market Value Share (%) and BPS Analysis by Country, 2023 to 2033 Figure 81: South Asia and Pacific Market Y-o-Y Growth (%) Projections by Country, 2023 to 2033 Figure 82: South Asia and Pacific Market Value (US$ Million) Analysis by Product type, 2018 to 2033 Figure 83: South Asia and Pacific Market Value Share (%) and BPS Analysis by Product type, 2023 to 2033 Figure 84: South Asia and Pacific Market Y-o-Y Growth (%) Projections by Product type, 2023 to 2033 Figure 85: South Asia and Pacific Market Value (US$ Million) Analysis by End-user, 2018 to 2033 Figure 86: South Asia and Pacific Market Value Share (%) and BPS Analysis by End-user, 2023 to 2033 Figure 87: South Asia and Pacific Market Y-o-Y Growth (%) Projections by End-user, 2023 to 2033 Figure 88: South Asia and Pacific Market Attractiveness by Product type, 2023 to 2033 Figure 89: South Asia and Pacific Market Attractiveness by End-user, 2023 to 2033 Figure 90: South Asia and Pacific Market Attractiveness by Country, 2023 to 2033 Figure 91: East Asia Market Value (US$ Million) by Product type, 2023 to 2033 Figure 92: East Asia Market Value (US$ Million) by End-user, 2023 to 2033 Figure 93: East Asia Market Value (US$ Million) by Country, 2023 to 2033 Figure 94: East Asia Market Value (US$ Million) Analysis by Country, 2018 to 2033 Figure 95: East Asia Market Value Share (%) and BPS Analysis by Country, 2023 to 2033 Figure 96: East Asia Market Y-o-Y Growth (%) Projections by Country, 2023 to 2033 Figure 97: East Asia Market Value (US$ Million) Analysis by Product type, 2018 to 2033 Figure 98: East Asia Market Value Share (%) and BPS Analysis by Product type, 2023 to 2033 Figure 99: East Asia Market Y-o-Y Growth (%) Projections by Product type, 2023 to 2033 Figure 100: East Asia Market Value (US$ Million) Analysis by End-user, 2018 to 2033 Figure 101: East Asia Market Value Share (%) and BPS Analysis by End-user, 2023 to 2033 Figure 102: East Asia Market Y-o-Y Growth (%) Projections by End-user, 2023 to 2033 Figure 103: East Asia Market Attractiveness by Product type, 2023 to 2033 Figure 104: East Asia Market Attractiveness by End-user, 2023 to 2033 Figure 105: East Asia Market Attractiveness by Country, 2023 to 2033 Figure 106: Middle East and Africa Market Value (US$ Million) by Product type, 2023 to 2033 Figure 107: Middle East and Africa Market Value (US$ Million) by End-user, 2023 to 2033 Figure 108: Middle East and Africa Market Value (US$ Million) by Country, 2023 to 2033 Figure 109: Middle East and Africa Market Value (US$ Million) Analysis by Country, 2018 to 2033 Figure 110: Middle East and Africa Market Value Share (%) and BPS Analysis by Country, 2023 to 2033 Figure 111: Middle East and Africa Market Y-o-Y Growth (%) Projections by Country, 2023 to 2033 Figure 112: Middle East and Africa Market Value (US$ Million) Analysis by Product type, 2018 to 2033 Figure 113: Middle East and Africa Market Value Share (%) and BPS Analysis by Product type, 2023 to 2033 Figure 114: Middle East and Africa Market Y-o-Y Growth (%) Projections by Product type, 2023 to 2033 Figure 115: Middle East and Africa Market Value (US$ Million) Analysis by End-user, 2018 to 2033 Figure 116: Middle East and Africa Market Value Share (%) and BPS Analysis by End-user, 2023 to 2033 Figure 117: Middle East and Africa Market Y-o-Y Growth (%) Projections by End-user, 2023 to 2033 Figure 118: Middle East and Africa Market Attractiveness by Product type, 2023 to 2033 Figure 119: Middle East and Africa Market Attractiveness by End-user, 2023 to 2033 Figure 120: Middle East and Africa Market Attractiveness by Country, 2023 to 2033
Recommendations
Explore Healthcare Insights
View Reports