HIV Antivirals Market
Market Insights on HIV Antivirals covering sales outlook, demand forecast & up-to-date key trends
HIV Antivirals Market by Product, Distribution Channel & Region - Forecast 2022 - 2032
HIV Antivirals Market Outlook (2022-2032)
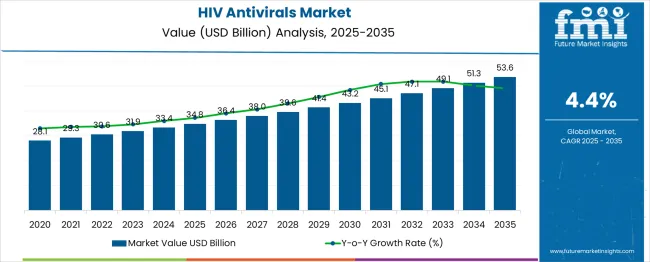
[300 Pages Report] The global HIV antivirals market is set to reach a valuation of US$ 30.6 Bn in 2022, and register a CAGR of 4.4% during the forecast period (2022-2032). According to a recent study, fixed-dose combinations (FDCs) are leading the HIV antivirals market with a share of over 83% in 2021.
Market Outlook:
Data Points |
Market Insights |
HIV Antivirals Market Value 2021 |
US$ 29.4 Bn |
Market Value 2022 |
US$ 30.6 Bn |
Market Value 2032 |
US$ 47.0 Bn |
CAGR 2022-2032 |
4.4% |
Market Share of Top 5 Countries |
64.8% |
The demand for HIV antivirals is projected to surge with increasing access to effective HIV diagnosis, treatment, prevention, and care. It makes HIV infection a manageable chronic health condition such as cancer and tuberculosis, which enables people living with HIV to lead healthy and long lives.
The HIV antivirals market is poised to expand on the back of rising awareness about HIV causes, symptoms, and available treatment options. There are various awareness programs organized by the U.S. Department of Health & Human Services for creating awareness regarding HIV and its testing.
For instance, the National Institutes of Health’s National Institute of Allergy and Infectious Diseases (NIAID) observe the day 18th May as HIV Vaccine Awareness Day. This is to show gratitude towards the community members, volunteers, healthcare professionals, and scientists working together to find a safe and effective preventive HIV vaccine.
Let us know your requirement to get
100% FREE customization
Sales Analysis of HIV Antivirals Market from 2017 to 2021 Vs Market Outlook for 2022 to 2032
Overall sales of HIV antivirals expanded at a CAGR of 4.0% from 2017 to 2021 owing to the rise in various government and NGO plans to offer greater accessibility to disease diagnosis and treatment for infected persons. As per Future Market Insights (FMI), the demand for HIV antivirals was approximately 66.5%, totalling US$ 44.2 Bn of the global antiviral drugs market in 2021.
For instance, the International AIDS Society (IAS) is the world’s largest association of HIV professionals from more than 170 countries. It plays a vital role in improving the lives of people with and most vulnerable to acquiring HIV by promoting the implementation of evidence-informed and human rights-based strategies.
Rising initiatives by government across the globe and NGOs is expected to boost the HIV antiviral market. Hence, key players operating in the market are capitalizing on this existing trend by launching new products.
For instance, in January 2021, ViiV Healthcare gained marketing authorization from European Commission for Tivicay (dolutegravir) for the treatment of human immunodeficiency virus (HIV-1) infection in pediatric patients.
In addition, increasing awareness about the available treatments to control HIV growth is also enhancing the demand for the HIV antivirals market.
What are the Key Opportunities for Manufacturers in the HIV Antivirals Market?
Key manufacturers in HIV antivirals market are actively participating in clinical trials for the development of HIV antivirals. For instance, ViiV Healthcare is sponsoring “the study to evaluate the antiviral effect, safety and tolerability of GSK3810109A in Viremic Human Immunodeficiency Virus (HIV)-1 infected adults”, which is currently in phase 2.
Similarly, the National Institute of Allergy and Infectious Diseases (NIAID) is also sponsoring a project named “Safety of and Immune Response to Dolutegravir in HIV-1 Infected Infants, Children, and Adolescents”, which is currently in phase 2. On the back of these developments, the demand in the HIV antivirals market is expected to propel over the assessment period.
Find your sweet spots for generating winning opportunities in this market.
Talk to AnalystWhat are the Factors Restraining the Demand in HIV Antivirals Market?
The market is being impacted by limited access to HIV treatment and a lack of awareness in emerging nations. One-fifth of the urban population is HIV-positive and unaware of it. Increased HIV testing among the general population could be one way for regional and national planning actions to address this issue.
Rigorous government guidelines for the approval and commercialization of HIV drugs is also creating a hurdle for the growth of the market by limiting the number of drugs launched every year for HIV. Thus, it is harming the overall market growth.
Additionally, the lack of advanced infrastructure and limited facilities for screening and testing may limit the population with HIV infection to opt for proper treatment.
Furthermore, a large number of under-diagnosed populations is increasing due to a lack of adequate data to guide country-specific testing approaches, lack of guidelines on testing for resource-limited settings, and stigmatization of populations with or at high risk of infection.
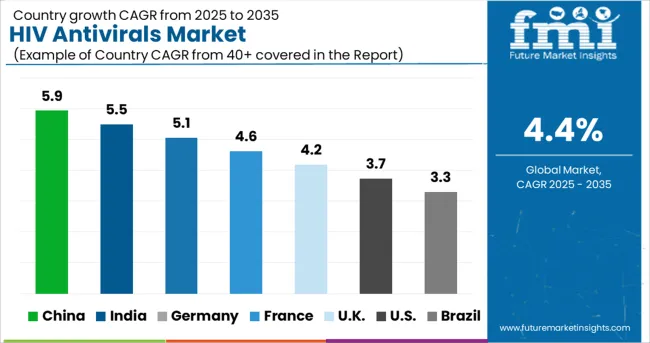
Country-wise Insights
What Makes the U.S. the Largest Market for HIV Antivirals?
Availability of Funded Drug Assistance Programs in the U.S. to Propel Growth in HIV Antivirals Market
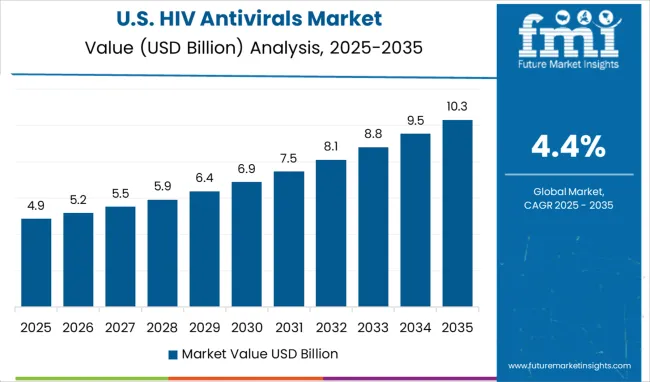
The U.S. dominated the North America HIV antivirals market with a total market share of around 96.8% in 2021. Demand for HIV antivirals is expected to surge due to the presence of various federally funded assistance programs in the country.
For instance, the AIDS Drug Assistance Program (ADAP) helps people with less income pay for HIV and AIDS medications. In many states, it covers extra costs such as prescription drugs and lab tests that are not for treating HIV/AIDS.
Thus, U.S. market will have a great opportunity in the region for growth, due to better assistance programs in the approaching years.
Why is the U.K. Considered a Lucrative HIV Antivirals Market in Europe?
Favorable Government and NGO Policies to Boost the U.K. HIV Antivirals Market
As per FMI, the U.K. is set to exhibit a CAGR of nearly 4.3% in the Europe HIV antivirals market during the forecast period. Government in the U.K. provides all HIV treatment free for the residents in the country, regardless of their immigration status. These kinds of facilities aid the middle and low-income population to take the best treatment for HIV.
Moreover, the approval for the use of injectable treatment using a combination of cabotegravir with rilpivirine instead of oral antiretroviral is a better treatment option for HIV patients. This is due to the dosing frequency of injectable is much lower than the oral dosage.
Will China Emerge as a Remunerative HIV Antivirals Market in East Asia?
Rising Prevalence of HIV to Improve the Demand for HIV Vaccine Boosting China HIV Antivirals Market
China held more than 75% share in the East Asia HIV antivirals market in 2021 and is projected to increase at a CAGR of 4.4% during the forecast period. Demand in the market is projected to surge on the back of rising prevalence of HIV in China.
For instance, according to studies published in NCBI, approximately 1.1 million people were living with HIV in 2020 in China. The demand for HIV antivirals is increasing with the growing rate of infection to treat or manage the disease.
How Big is the India HIV Antivirals Market?
Demand for HIV Drugs to Surge in India Amid Growing Cases of HIV and Rising Infant Mortality Rate
India held around 45.3% share in South Asia HIV antivirals market in 2021 and is projected to register a CAGR of 4.8% during the forecast period. Growth is primarily due to the high infant mortality rate and presence of HIV cases in the country.
Further, presence of awareness programs in the country, such as the National Aids Control Programme, is a key factor accelerating the demand in the market. It is a centrally sponsored scheme run by the Ministry of Health and Family Welfare of the Government of India with the goal of halving new HIV/AIDS infections and providing comprehensive care, support, and treatment to all HIV/AIDS patients.

A unified Market Research Subscription Platform, built for today's disparate research needs.
Category-wise Insights
Which Product Will Account for Lion’s Share in HIV Antivirals Market?
Fixed Dose Combinations (FDCs) to Account for Over 4/5th of HIV Antivirals Sales
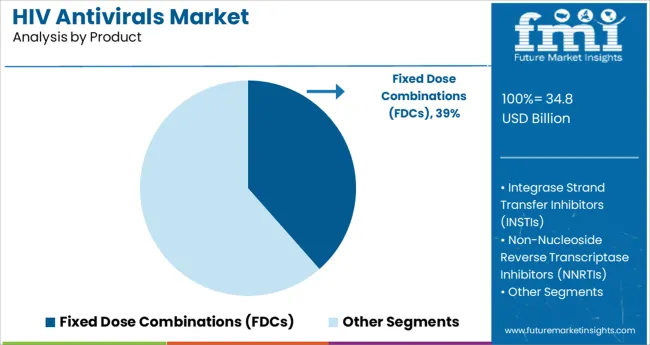
Fixed dose combinations (FDCs) held a market share of around 83.2% in 2021 and is estimated to witness growth at a CAGR of 4.5% during the forecast period.
High demand for FDCs drugs is due to the simplicity of the regimen, drug-drug interactions, and infrequent adverse effects in combination with a low pill burden. It also prevents the virus to reproduce by restricting an enzyme HIV needs to make copies of itself.
Thus, FDCs drugs help to improve adherence to an HIV treatment regimen which drives the demand for FDCs in forthcoming years.
Which is the Leading Sales Channel in the HIV Antivirals Market?
Sales of HIV Antivirals in Hospital Pharmacies to Surge at a Robust Pace
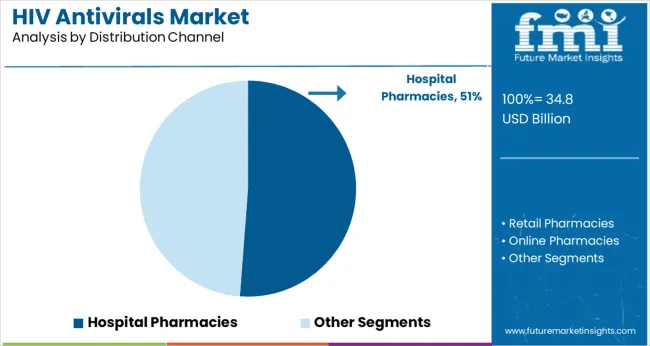
The hospital pharmacies segment held a market share of 53.4% in 2021 and is expected to hold a share of over 54.0% in 2032.
Increasing number of people seeking treatment in hospitals are purchasing the drugs through hospital pharmacies. This is due to factors such as easy availability and subsidized prices. Thus, hospital pharmacies help in increasing the sale of HIV antiviral drugs and will drive the HIV antivirals market.
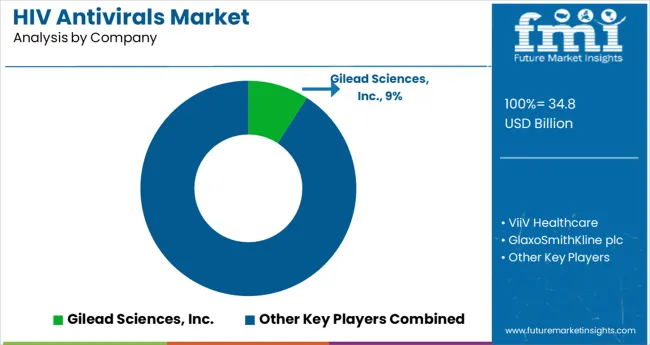
Competitive Landscape
Key players in the HIV antivirals market are concentrating on collaborations and gaining FDA approvals, as the key strategies for expanding their business in the market.
These factors will support the market players, such as Theratechnologies and AbbVie, to improve their product portfolio together with market penetration, thus, increasing their revenue share in the global market.
For instance:
- In December 2021, Theratechnologies announced the submission of a license application for supplemental biologics to FDA for advancing the development of IV Push Trogarzo® for patients living with HIV.
- • In March 2020, AbbVie announced a partnership with international authorities to test the efficacy of HIV medicines in treating COVID-19.
Report Scope as per HIV Antivirals Market Analysis
Attribute |
Details |
Market Value 2022 |
US$ 30.6 Bn |
Market Value 2032 |
US$ 47.0 Bn |
CAGR 2022-2032 |
4.4% |
Forecast Period |
2017-2021 |
Historical Data Available for |
2022-2032 |
Market Analysis |
US$ Mn for Value |
Key Regions Covered |
North America, Latin America, Europe, South Asia, East Asia, Oceania, and Middle East & Africa |
Key Countries Covered |
US, China, Japan, Germany, Canada, UK, India, South Korea, Russia, Australia, BENELUX, Spain, Indonesia, France, Italy, Brazil, Thailand, Malaysia, Vietnam, Philippines, Mexico, GCC Countries, Argentina, South Africa, North Africa, Turkey, and New Zealand |
Key Market Segments Covered |
Product, Sales Channel, and Region |
Key Companies Profiled |
|
Key Market Segments Covered in HIV Antivirals Market Research
By Product:
- Fixed Dose Combinations (FDCs)
- Integrase Strand Transfer Inhibitors (INSTIs)
- Non-Nucleoside Reverse Transcriptase Inhibitors (NNRTIs)
- Entry Inhibitors - CCR5 co-receptor antagonist
- Protease Inhibitors (PIs)
- Nucleoside Reverse Transcriptase Inhibitors (NRTIs)
- Others
By Distribution Channel:
- Hospital Pharmacies
- Retail Pharmacies
- Online Pharmacies
By Region:
- North America
- Latin America
- Europe
- South Asia
- East Asia
- Oceania
- The Middle East and Africa (MEA)
Frequently Asked Questions
How much is the HIV antivirals market worth in 2021?
The global HIV antivirals market is worth US$ 29.4 Bn in 2021 and is set to expand 1.5X over the next ten years.
What is the sales forecast for HIV antivirals through 2032?
The HIV antivirals market is expected to reach US$ 47.0 Bn by the end of 2032, with sales revenue expected to register a 4.4% CAGR over the forecast period (2022-2032).
What are the key trends shaping the HIV antivirals market?
Increasing research and development activities to develop long-acting antiviral therapies, the rising number of clinical trials, and the increasing number of product launches, are some of the key trends in this market.
Which are the top 5 countries driving demand for HIV antivirals market?
The U.S., Germany, India, China, and the U.K. are expected to drive demand for the HIV antivirals industry.
What is the North America market outlook for HIV antivirals?
North America is one of the key markets for HIV antivirals and the U.S. is accounting for around 96.8% of the North American market in the year 2021.
At what percentage is the demand for HIV antivirals expected to register growth in Europe?
The demand for HIV antivirals in Europe is expected to register a growth of 4.1% over the next ten years.
Table of Content
1. Executive Summary 1.1. Global Market Outlook 1.2. Demand Side Trends 1.3. Supply-Side Trends 1.4. Analysis and Recommendations 2. Market Overview 2.1. Market Coverage / Taxonomy 2.2. Market Definition / Scope / Limitations 2.3. Inclusions and Exclusions 3. Key Market Trends 3.1. Key Trends Impacting the Market 3.2. Product Innovation / Development Trends 4. Key Success Factors 4.1. HIV Disease Epidemiology 4.2. Regulatory Scenario 4.3. Clinical Pipeline Assessment 4.4. PESTLE Analysis 4.5. Porters Analysis 4.6. Key Promotional Strategies by Key Manufacturers 5. Market Background 5.1. Macro-Economic Factors 5.1.1. Global GDP Growth Outlook 5.1.2. Global Healthcare Spending Outlook 5.1.3. Global Antiviral Drugs Market Outlook 5.2. Forecast Factors - Relevance & Impact 5.2.1. Increasing Incidence of HIV Infection 5.2.2. Demand for HIV Medications 5.2.3. Rise in Research & Development Activities 5.2.4. Increase in Drug Approvals 5.2.5. Rising Awareness Among People 5.2.6. Rise in Use of Antivirals 5.2.7. Strategical Mergers and Acquisitions Among Key Players 5.3. Market Dynamics 5.3.1. Drivers 5.3.2. Restraints 5.3.3. Opportunity Analysis 6. COVID19 Crisis Analysis 6.1. COVID19 and Impact Analysis 6.1.1. Revenue By Product 6.1.2. Revenue By Sales Channel 6.1.3. Revenue By Country 6.2. 2021 Market Scenario 7. Global HIV Antivirals Market Demand (in Value or Size in US$ Mn) Analysis 2012–2021 and Forecast, 2022–2032 7.1. Historical Market Value (US$ Mn) Analysis, 2012–2021 7.2. Current and Future Market Value (US$ Mn) Projections, 2022–2032 7.2.1. Y-o-Y Growth Trend Analysis 7.2.2. Absolute $ Opportunity Analysis 8. Global HIV Antivirals Market Analysis 2012–2021 and Forecast 2022–2032, by Product 8.1. Introduction / Key Findings 8.2. Historical Market Size (US$ Mn), By Product, 2012–2021 8.3. Current and Future Market Size (US$ Mn) Analysis and Forecast By Product, 2022–2032 8.3.1. Fixed Dose Combinations (FDCs) 8.3.2. Integrase Strand Transfer Inhibitors (INSTIs) 8.3.3. Non-Nucleoside Reverse Transcriptase Inhibitors (NNRTIs) 8.3.4. Entry Inhibitors - CCR5 co-receptor antagonist 8.3.5. Protease Inhibitors (PIs) 8.3.6. Nucleoside Reverse Transcriptase Inhibitors (NRTIs) 8.3.7. Others 8.4. Market Attractiveness Analysis By Product 9. Global HIV Antivirals Market Analysis 2012–2021 and Forecast 2022–2032, by Sales Channel 9.1. Introduction / Key Findings 9.2. Historical Market Size (US$ Mn), By Sales Channel, 2012–2021 9.3. Current and Future Market Size (US$ Mn) and Forecast By Sales Channel, 2022–2032 9.3.1. Hospital Pharmacies 9.3.2. Retail Pharmacies 9.3.3. Online Pharmacies 9.4. Market Attractiveness Analysis By Sales Channel 10. Global HIV Antivirals Market Analysis 2012–2021 and Forecast 2022–2032, by Region 10.1. Introduction 10.2. Historical Market Size (US$ Mn) Analysis By Region, 2012–2021 10.3. Current and Future Market Size (US$ Mn) and Forecast By Region, 2022–2032 10.3.1. North America 10.3.2. Latin America 10.3.3. Europe 10.3.4. East Asia 10.3.5. South Asia 10.3.6. Oceania 10.3.7. Middle East and Africa (MEA) 10.4. Market Attractiveness Analysis By Region 11. North America HIV Antivirals Market Analysis 2012–2021 and Forecast 2022–2032 11.1. Introduction 11.2. Historical Market Size (US$ Mn) Analysis By Market Taxonomy, 2012–2021 11.3. Current and Future Market Size (US$ Mn) Analysis and Forecast By Market Taxonomy, 2022–2032 11.3.1. By Country 11.3.1.1. U.S. 11.3.1.2. Canada 11.3.2. By Product 11.3.3. By Sales Channel 11.4. Market Attractiveness Analysis 11.4.1. By Country 11.4.2. By Product 11.4.3. By Sales Channel 11.5. Market Trends 11.6. Key Market Participants - Intensity Mapping 11.7. Drivers and Restraints - Impact Analysis 11.8. Country Level Analysis & Forecast 11.8.1. U.S. HIV Antivirals Market Analysis 11.8.1.1. Introduction 11.8.1.2. Market Analysis and Forecast by Market Taxonomy 11.8.1.2.1. By Product 11.8.1.2.2. By Sales Channel 11.8.2. Canada HIV Antivirals Market Analysis 11.8.2.1. Introduction 11.8.2.2. Market Analysis and Forecast by Market Taxonomy 11.8.2.2.1. By Product 11.8.2.2.2. By Sales Channel 12. Latin America HIV Antivirals Market Analysis 2012–2021 and Forecast 2022–2032 12.1. Introduction 12.2. Historical Market Size (US$ Mn) Analysis By Market Taxonomy, 2012–2021 12.3. Current and Future Market Size (US$ Mn) Analysis and Forecast By Market Taxonomy, 2022–2032 12.3.1. By Country 12.3.1.1. Mexico 12.3.1.2. Brazil 12.3.1.3. Argentina 12.3.1.4. Rest of Latin America 12.3.2. By Product 12.3.3. By Sales Channel 12.4. Market Attractiveness Analysis 12.4.1. By Country 12.4.2. By Product 12.4.3. By Sales Channel 12.5. Market Trends 12.6. Key Market Participants - Intensity Mapping 12.7. Drivers and Restraints - Impact Analysis 12.8. Country Level Analysis & Forecast 12.8.1. Mexico HIV Antivirals Market Analysis 12.8.1.1. Introduction 12.8.1.2. Market Analysis and Forecast by Market Taxonomy 12.8.1.2.1. By Product 12.8.1.2.2. By Sales Channel 12.8.2. Brazil HIV Antivirals Market Analysis 12.8.2.1. Introduction 12.8.2.2. Market Analysis and Forecast by Market Taxonomy 12.8.2.2.1. By Product 12.8.2.2.2. By Sales Channel 12.8.3. Argentina HIV Antivirals Market Analysis 12.8.3.1. Introduction 12.8.3.2. Market Analysis and Forecast by Market Taxonomy 12.8.3.2.1. By Product 12.8.3.2.1.2. By Sales Channel 13. Europe HIV Antivirals Market Analysis 2012–2021 and Forecast 2022–2032 13.1. Introduction 13.2. Historical Market Size (US$ Mn) Analysis By Market Taxonomy, 2012–2021 13.3. Current and Future Market Size (US$ Mn) Analysis and Forecast By Market Taxonomy, 2022–2032 13.3.1. By Country 13.3.1.1. Germany 13.3.1.2. Italy 13.3.1.3. France 13.3.1.4. U.K. 13.3.1.5. Spain 13.3.1.6. BENELUX 13.3.1.7. Nordic Countries 13.3.1.8. Russia 13.3.1.9. Rest of Europe 13.3.2. By Product 13.3.3. By Sales Channel 13.4. Market Attractiveness Analysis 13.4.1. By Country 13.4.2. By Product 13.4.3. By Sales Channel 13.5. Market Trends 13.6. Key Market Participants - Intensity Mapping 13.7. Drivers and Restraints - Impact Analysis 13.8. Country Level Analysis & Forecast 13.8.1. Germany HIV Antivirals Market Analysis 13.8.1.1. Introduction 13.8.1.2. Market Analysis and Forecast by Market Taxonomy 13.8.1.2.1. By Product 13.8.1.2.2. By Sales Channel 13.8.2. Italy HIV Antivirals Market Analysis 13.8.2.1. Introduction 13.8.2.2. Market Analysis and Forecast by Market Taxonomy 13.8.2.2.1. By Product 13.8.2.2.2. By Sales Channel 13.8.3. France HIV Antivirals Market Analysis 13.8.3.1. Introduction 13.8.3.2. Market Analysis and Forecast by Market Taxonomy 13.8.3.2.1. By Product 13.8.3.2.2. By Sales Channel 13.8.4. U.K. HIV Antivirals Market Analysis 13.8.4.1. Introduction 13.8.4.2. Market Analysis and Forecast by Market Taxonomy 13.8.4.2.1. By Product 13.8.4.2.2. By Sales Channel 13.8.5. Spain HIV Antivirals Market Analysis 13.8.5.1. Introduction 13.8.5.2. Market Analysis and Forecast by Market Taxonomy 13.8.5.2.1. By Product 13.8.5.2.2. By Sales Channel 13.8.6. BENELUX HIV Antivirals Market Analysis 13.8.6.1. Introduction 13.8.6.2. Market Analysis and Forecast by Market Taxonomy 13.8.6.2.1. By Product 13.8.6.2.2. By Sales Channel 13.8.7. Nordic Countries HIV Antivirals Market Analysis 13.8.7.1. Introduction 13.8.7.2. Market Analysis and Forecast by Market Taxonomy 13.8.7.2.1. By Product 13.8.7.2.2. By Sales Channel 13.8.8. Russia HIV Antivirals Market Analysis 13.8.8.1. Introduction 13.8.8.2. Market Analysis and Forecast by Market Taxonomy 13.8.8.2.1. By Product 13.8.8.2.2. By Sales Channel 14. East Asia HIV Antivirals Market Analysis 2012–2021 and Forecast 2022–2032 14.1. Introduction 14.2. Historical Market Size (US$ Mn) Analysis By Market Taxonomy, 2012–2021 14.3. Current and Future Market Size (US$ Mn) Analysis and Forecast By Market Taxonomy, 2022–2032 14.3.1. By Country 14.3.1.1. China 14.3.1.2. Japan 14.3.1.3. South Korea 14.3.2. By Product 14.3.3. By Sales Channel 14.4. Market Attractiveness Analysis 14.4.1. By Country 14.4.2. By Product 14.4.3. By Sales Channel 14.5. Market Trends 14.6. Key Market Participants - Intensity Mapping 14.7. Drivers and Restraints - Impact Analysis 14.8. Country Level Analysis & Forecast 14.8.1. China HIV Antivirals Market Analysis 14.8.1.1. Introduction 14.8.1.2. Market Analysis and Forecast by Market Taxonomy 14.8.1.2.1. By Product 14.8.1.2.2. By Sales Channel 14.8.2. Japan HIV Antivirals Market Analysis 14.8.2.1. Introduction 14.8.2.2. Market Analysis and Forecast by Market Taxonomy 14.8.2.2.1. By Product 14.8.2.2.2. By Sales Channel 14.8.3. South Korea HIV Antivirals Market Analysis 14.8.3.1. Introduction 14.8.3.2. Market Analysis and Forecast by Market Taxonomy 14.8.3.2.1. By Product 14.8.3.2.2. By Sales Channel 15. South Asia HIV Antivirals Market Analysis 2012–2021 and Forecast 2022–2032 15.1. Introduction 15.2. Historical Market Size (US$ Mn) Analysis By Market Taxonomy, 2012–2021 15.3. Current and Future Market Size (US$ Mn) Analysis and Forecast By Market Taxonomy, 2022–2032 15.3.1. By Country 15.3.1.1. India 15.3.1.2. Indonesia 15.3.1.3. Malaysia 15.3.1.4. Philippines 15.3.1.5. Thailand 15.3.1.6. Vietnam 15.3.1.7. Rest of South Asia 15.3.2. By Product 15.3.3. By Sales Channel 15.4. Market Attractiveness Analysis 15.4.1. By Country 15.4.2. By Product 15.4.3. By Sales Channel 15.5. Market Trends 15.6. Key Market Participants - Intensity Mapping 15.7. Drivers and Restraints - Impact Analysis 15.8. Country Level Analysis & Forecast 15.8.1. India HIV Antivirals Market Analysis 15.8.1.1. Introduction 15.8.1.2. Market Analysis and Forecast by Market Taxonomy 15.8.1.2.1. By Product 15.8.1.2.2. By Sales Channel 15.8.2. Indonesia HIV Antivirals Market Analysis 15.8.2.1. Introduction 15.8.2.2. Market Analysis and Forecast by Market Taxonomy 15.8.2.2.1. By Product 15.8.2.2.2. By Sales Channel 15.8.3. Malaysia HIV Antivirals Market Analysis 15.8.3.1. Introduction 15.8.3.2. Market Analysis and Forecast by Market Taxonomy 15.8.3.2.1. By Product 15.8.3.2.2. By Sales Channel 15.8.4. Philippines HIV Antivirals Market Analysis 15.8.4.1. Introduction 15.8.4.2. Market Analysis and Forecast by Market Taxonomy 15.8.4.2.1. By Product 15.8.4.2.2. By Sales Channel 15.8.5. Thailand HIV Antivirals Market Analysis 15.8.5.1. Introduction 15.8.5.2. Market Analysis and Forecast by Market Taxonomy 15.8.5.2.1. By Product 15.8.5.2.2. By Sales Channel 15.8.6. Vietnam HIV Antivirals Market Analysis 15.8.6.1. Introduction 15.8.6.2. Market Analysis and Forecast by Market Taxonomy 15.8.6.2.1. By Product 15.8.6.2.2. By Sales Channel 16. Oceania HIV Antivirals Market 2012-2021 and Forecast 2022-2032 16.1. Introduction 16.2. Historical Market Size (US$ Mn) Analysis By Market Taxonomy, 2012–2021 16.3. Current and Future Market Size (US$ Mn) Analysis and Forecast By Market Taxonomy, 2022–2032 16.3.1. By Country 16.3.1.1. Australia 16.3.1.2. New Zealand 16.3.2. By Product 16.3.3. By Sales Channel 16.4. Market Attractiveness Analysis 16.4.1. By Country 16.4.2. By Product 16.4.3. By Sales Channel 16.5. Market Trends 16.6. Key Market Participants - Intensity Mapping 16.7. Drivers and Restraints - Impact Analysis 16.8. Country Level Analysis & Forecast 16.8.1. Australia HIV Antivirals Market Analysis 16.8.1.1. Introduction 16.8.1.2. Market Analysis and Forecast by Market Taxonomy 16.8.1.2.1. By Product 16.8.1.2.2. By Sales Channel 16.8.2. New Zealand HIV Antivirals Market Analysis 16.8.2.1. Introduction 16.8.2.2. Market Analysis and Forecast by Market Taxonomy 16.8.2.2.1. By Product 16.8.2.2.2. By Sales Channel 17. Middle East and Africa (MEA) HIV Antivirals Market Analysis 2012–2021 and Forecast 2022–2032 17.1. Introduction 17.2. Historical Market Size (US$ Mn) Analysis By Market Taxonomy, 2012–2021 17.3. Current and Future Market Size (US$ Mn) Analysis and Forecast By Market Taxonomy, 2022–2032 17.3.1. By Country 17.3.1.1. GCC Countries 17.3.1.2. Israel 17.3.1.3. Turkey 17.3.1.4. South Africa 17.3.1.5. North Africa 17.3.1.6. Rest of Middle East and Africa 17.3.2. By Product 17.3.3. By Sales Channel 17.4. Market Attractiveness Analysis 17.4.1. By Country 17.4.2. By Product 17.4.3. By Sales Channel 17.5. Market Trends 17.6. Key Market Participants - Intensity Mapping 17.7. Drivers and Restraints - Impact Analysis 17.8. Country Level Analysis & Forecast 17.8.1. GCC Countries HIV Antivirals Market Analysis 17.8.1.1. Introduction 17.8.1.2. Market Analysis and Forecast by Market Taxonomy 17.8.1.2.1. By Product 17.8.1.2.2. By Sales Channel 17.8.2. Israel HIV Antivirals Market Analysis 17.8.2.1. Introduction 17.8.2.2. Market Analysis and Forecast by Market Taxonomy 17.8.2.2.1. By Product 17.8.2.2.2. By Sales Channel 17.8.3. Turkey HIV Antivirals Market Analysis 17.8.3.1. Introduction 17.8.3.2. Market Analysis and Forecast by Market Taxonomy 17.8.3.2.1. By Product 17.8.3.2.2. By Sales Channel 17.8.4. South Africa HIV Antivirals Market Analysis 17.8.4.1. Introduction 17.8.4.2. Market Analysis and Forecast by Market Taxonomy 17.8.4.2.1. By Product 17.8.4.2.2. By Sales Channel 17.8.5. North Africa HIV Antivirals Market Analysis 17.8.5.1. Introduction 17.8.5.2. Market Analysis and Forecast by Market Taxonomy 17.8.5.2.1. By Product 17.8.5.2.2. By Sales Channel 18. Market Structure Analysis 18.1. Market Analysis by Tier of Companies 18.2. Market Share Analysis of Top Players 18.3. Market Concentration 18.4. Market Presence Analysis 18.4.1. Regional Footprint Analysis 18.4.2. Channel Footprint Analysis 19. Competition Analysis 19.1. Competition Dashboard 19.2. Competition Benchmarking 19.3. Competition Deep Dive 19.3.1. ViiV Healthcare 19.3.1.1. Overview 19.3.1.2. Product Portfolio 19.3.1.3. Sales Footprint 19.3.1.4. Key Developments 19.3.1.5. SWOT Analysis 19.3.1.6. Strategy Overview 19.3.1.6.1. Marketing Strategies 19.3.1.6.2. Channel Strategies 19.3.2. Gilead Sciences, Inc. 19.3.2.1. Overview 19.3.2.2. Product Portfolio 19.3.2.3. Sales Footprint 19.3.2.4. Key Developments 19.3.2.5. SWOT Analysis 19.3.2.6. Strategy Overview 19.3.2.6.1. Marketing Strategies 19.3.2.6.2. Channel Strategies 19.3.3. GlaxoSmithKline plc 19.3.3.1. Overview 19.3.3.2. Product Portfolio 19.3.3.3. Sales Footprint 19.3.3.4. Key Developments 19.3.3.5. SWOT Analysis 19.3.3.6. Strategy Overview 19.3.3.6.1. Marketing Strategies 19.3.3.6.2. Channel Strategies 19.3.4. Merck & Co., Inc. 19.3.4.1. Overview 19.3.4.2. Product Portfolio 19.3.4.3. Sales Footprint 19.3.4.4. Key Developments 19.3.4.5. SWOT Analysis 19.3.4.6. Strategy Overview 19.3.4.6.1. Marketing Strategies 19.3.4.6.2. Channel Strategies 19.3.5. Johnson & Johnson 19.3.5.1. Overview 19.3.5.2. Product Portfolio 19.3.5.3. Sales Footprint 19.3.5.4. Key Developments 19.3.5.5. SWOT Analysis 19.3.5.6. Strategy Overview 19.3.5.6.1. Marketing Strategies 19.3.5.6.2. Channel Strategies 19.3.6. Genetech, Inc. 19.3.6.1. Overview 19.3.6.2. Product Portfolio 19.3.6.3. Sales Footprint 19.3.6.4. Key Developments 19.3.6.5. SWOT Analysis 19.3.6.6. Strategy Overview 19.3.6.6.1. Marketing Strategies 19.3.6.6.2. Channel Strategies 19.3.7. Teva Pharmaceutical Industries Ltd. 19.3.7.1. Overview 19.3.7.2. Product Portfolio 19.3.7.3. Sales Footprint 19.3.7.4. Key Developments 19.3.7.5. SWOT Analysis 19.3.7.6. Strategy Overview 19.3.7.6.1. Marketing Strategies 19.3.7.6.2. Channel Strategies 19.3.8. AbbVie 19.3.8.1. Overview 19.3.8.2. Product Portfolio 19.3.8.3. Sales Footprint 19.3.8.4. Key Developments 19.3.8.5. SWOT Analysis 19.3.8.6. Strategy Overview 19.3.8.6.1. Marketing Strategies 19.3.8.6.2. Channel Strategies 19.3.9. Cipla 19.3.9.1. Overview 19.3.9.2. Product Portfolio 19.3.9.3. Sales Footprint 19.3.9.4. Key Developments 19.3.9.5. SWOT Analysis 19.3.9.6. Strategy Overview 19.3.9.6.1. Marketing Strategies 19.3.9.6.2. Channel Strategies 19.3.10. Pfizer Inc. 19.3.10.1. Overview 19.3.10.2. Product Portfolio 19.3.10.3. Sales Footprint 19.3.10.4. Key Developments 19.3.10.5. SWOT Analysis 19.3.10.6. Strategy Overview 19.3.10.6.1. Marketing Strategies 19.3.10.6.2. Channel Strategies 19.3.11. Mylan N.V. 19.3.11.1. Overview 19.3.11.2. Product Portfolio 19.3.11.3. Sales Footprint 19.3.11.4. Key Developments 19.3.11.5. SWOT Analysis 19.3.11.6. Strategy Overview 19.3.11.6.1. Marketing Strategies 19.3.11.6.2. Channel Strategies 19.3.12. Bristol-Myers Squibb Company 19.3.12.1. Overview 19.3.12.2. Product Portfolio 19.3.12.3. Sales Footprint 19.3.12.4. Key Developments 19.3.12.5. SWOT Analysis 19.3.12.6. Strategy Overview 19.3.12.6.1. Marketing Strategies 19.3.12.6.2. Channel Strategies 19.3.13. Boehringer Ingelheim International GmbH 19.3.13.1. Overview 19.3.13.2. Product Portfolio 19.3.13.3. Sales Footprint 19.3.13.4. Key Developments 19.3.13.5. SWOT Analysis 19.3.13.6. Strategy Overview 19.3.13.6.1. Marketing Strategies 19.3.13.6.2. Channel Strategies 19.3.14. Macleods Pharmaceuticals Ltd 19.3.14.1. Overview 19.3.14.2. Product Portfolio 19.3.14.3. Sales Footprint 19.3.14.4. Key Developments 19.3.14.5. SWOT Analysis 19.3.14.6. Strategy Overview 19.3.14.6.1. Marketing Strategies 19.3.14.6.2. Channel Strategies 19.3.15. Emcure Pharmaceuticals Limited 19.3.15.1. Overview 19.3.15.2. Product Portfolio 19.3.15.3. Sales Footprint 19.3.15.4. Key Developments 19.3.15.5. SWOT Analysis 19.3.15.6. Strategy Overview 19.3.15.6.1. Marketing Strategies 19.3.15.6.2. Channel Strategies 19.3.16. Aspen Pharmacare Limited 19.3.16.1. Overview 19.3.16.2. Product Portfolio 19.3.16.3. Sales Footprint 19.3.16.4. Key Developments 19.3.16.5. SWOT Analysis 19.3.16.6. Strategy Overview 19.3.16.6.1. Marketing Strategies 19.3.16.6.2. Channel Strategies 19.3.17. Lupin Ltd. 19.3.17.1. Overview 19.3.17.2. Product Portfolio 19.3.17.3. Sales Footprint 19.3.17.4. Key Developments 19.3.17.5. SWOT Analysis 19.3.17.6. Strategy Overview 19.3.17.6.1. Marketing Strategies 19.3.17.6.2. Channel Strategies 19.3.18. Sun Pharmaceutical Industries Ltd. 19.3.18.1. Overview 19.3.18.2. Product Portfolio 19.3.18.3. Sales Footprint 19.3.18.4. Key Developments 19.3.18.5. SWOT Analysis 19.3.18.6. Strategy Overview 19.3.18.6.1. Marketing Strategies 19.3.18.6.2. Channel Strategies 19.3.19. Theratechnologies Inc. 19.3.19.1. Overview 19.3.19.2. Product Portfolio 19.3.19.3. Sales Footprint 19.3.19.4. Key Developments 19.3.19.5. SWOT Analysis 19.3.19.6. Strategy Overview 19.3.19.6.1. Marketing Strategies 19.3.19.6.2. Channel Strategies 19.3.20. Strides Arcolab Limited 19.3.20.1. Overview 19.3.20.2. Product Portfolio 19.3.20.3. Sales Footprint 19.3.20.4. Key Developments 19.3.20.5. SWOT Analysis 19.3.20.6. Strategy Overview 19.3.20.6.1. Marketing Strategies 19.3.20.6.2. Channel Strategies 19.3.21. Hetero labs limited 19.3.21.1. Overview 19.3.21.2. Product Portfolio 19.3.21.3. Sales Footprint 19.3.21.4. Key Developments 19.3.21.5. SWOT Analysis 19.3.21.6. Strategy Overview 19.3.21.6.1. Marketing Strategies 19.3.21.6.2. Channel Strategies 19.3.22. Laurus Laboratories Ltd 19.3.22.1. Overview 19.3.22.2. Product Portfolio 19.3.22.3. Sales Footprint 19.3.22.4. Key Developments 19.3.22.5. SWOT Analysis 19.3.22.6. Strategy Overview 19.3.22.6.1. Marketing Strategies 19.3.22.6.2. Channel Strategies 20. Assumptions and Acronyms Used 21. Research Methodology
Let us know your requirement to get
100% FREE customization
List of Tables
Table 1: Global HIV Antivirals Market Value (US$ Mn) Forecast by Region, 2017 & 2032 Table 2: Global HIV Antivirals Market Value (US$ Mn) Forecast by Product, 2017 & 2032 Table 3: Global HIV Antivirals Market Value (US$ Mn) Forecast by Sales Channel, 2017 & 2032 Table 4: North America HIV Antivirals Market Value (US$ Mn) Forecast by Country, 2017 & 2032 Table 5: North America HIV Antivirals Market Value (US$ Mn) Forecast by Product, 2017 & 2032 Table 6: North America HIV Antivirals Market Value (US$ Mn) Forecast by Sales Channel, 2017 & 2032 Table 7: Latin America HIV Antivirals Market Value (US$ Mn) Forecast by Country, 2017 & 2032 Table 8: Latin America HIV Antivirals Market Value (US$ Mn) Forecast by Product, 2017 & 2032 Table 9: Latin America HIV Antivirals Market Value (US$ Mn) Forecast by Sales Channel, 2017 & 2032 Table 10: Europe HIV Antivirals Market Value (US$ Mn) Forecast by Country, 2017 & 2032 Table 11: Europe HIV Antivirals Market Value (US$ Mn) Forecast by Product, 2017 & 2032 Table 12: Europe HIV Antivirals Market Value (US$ Mn) Forecast by Sales Channel, 2017 & 2032 Table 13: East Asia HIV Antivirals Market Value (US$ Mn) Forecast by Country, 2017 & 2032 Table 14: East Asia HIV Antivirals Market Value (US$ Mn) Forecast by Product, 2017 & 2032 Table 15: East Asia HIV Antivirals Market Value (US$ Mn) Forecast by Sales Channel, 2017 & 2032 Table 16: South Asia HIV Antivirals Market Value (US$ Mn) Forecast by Country, 2017 & 2032 Table 17: South Asia HIV Antivirals Market Value (US$ Mn) Forecast by Product, 2017 & 2032 Table 18: South Asia HIV Antivirals Market Value (US$ Mn) Forecast by Sales Channel, 2017 & 2032 Table 19: Oceania HIV Antivirals Market Value (US$ Mn) Forecast by Country, 2017 & 2032 Table 20: Oceania HIV Antivirals Market Value (US$ Mn) Forecast by Product, 2017 & 2032 Table 21: Oceania HIV Antivirals Market Value (US$ Mn) Forecast by Sales Channel, 2017 & 2032 Table 22: Middle East and Africa HIV Antivirals Market Value (US$ Mn) Forecast by Country, 2017 & 2032 Table 23: Middle East and Africa HIV Antivirals Market Value (US$ Mn) Forecast by Product, 2017 & 2032 Table 24: Middle East and Africa HIV Antivirals Market Value (US$ Mn) Forecast by Sales Channel, 2017 & 2032
Find your sweet spots for generating winning opportunities in this market.
Talk to AnalystList of Charts
Figure 1: Global HIV Antivirals Market Value (US$ Mn) by Product, 2022 & 2032 Figure 2: Global HIV Antivirals Market Value (US$ Mn) by Sales Channel, 2022 & 2032 Figure 3: Global HIV Antivirals Market Value (US$ Mn) by Region, 2022 & 2032 Figure 4: Global HIV Antivirals Market Value (US$ Mn) Analysis by Region, 2017 & 2032 Figure 5: Global HIV Antivirals Market Value Share (%) and BPS Analysis by Region, 2022 & 2032 Figure 6: Global HIV Antivirals Market Y-o-Y Growth (%) Projections by Region, 2022-2032 Figure 7: Global HIV Antivirals Market Value (US$ Mn) Analysis by Product, 2017 & 2032 Figure 8: Global HIV Antivirals Market Value Share (%) and BPS Analysis by Product, 2022 & 2032 Figure 9: Global HIV Antivirals Market Y-o-Y Growth (%) Projections by Product, 2022-2032 Figure 10: Global HIV Antivirals Market Value (US$ Mn) Analysis by Sales Channel, 2017 & 2032 Figure 11: Global HIV Antivirals Market Value Share (%) and BPS Analysis by Sales Channel, 2022 & 2032 Figure 12: Global HIV Antivirals Market Y-o-Y Growth (%) Projections by Sales Channel, 2022-2032 Figure 13: Global HIV Antivirals Market Attractiveness by Product, 2022-2032 Figure 14: Global HIV Antivirals Market Attractiveness by Sales Channel, 2022-2032 Figure 15: Global HIV Antivirals Market Attractiveness by Region, 2022-2032 Figure 16: North America HIV Antivirals Market Value (US$ Mn) by Product, 2022 & 2032 Figure 17: North America HIV Antivirals Market Value (US$ Mn) by Sales Channel, 2022 & 2032 Figure 18: North America HIV Antivirals Market Value (US$ Mn) by Country, 2022 & 2032 Figure 19: North America HIV Antivirals Market Value (US$ Mn) Analysis by Country, 2017 & 2032 Figure 20: North America HIV Antivirals Market Value Share (%) and BPS Analysis by Country, 2022 & 2032 Figure 21: North America HIV Antivirals Market Y-o-Y Growth (%) Projections by Country, 2022-2032 Figure 22: North America HIV Antivirals Market Value (US$ Mn) Analysis by Product, 2017 & 2032 Figure 23: North America HIV Antivirals Market Value Share (%) and BPS Analysis by Product, 2022 & 2032 Figure 24: North America HIV Antivirals Market Y-o-Y Growth (%) Projections by Product, 2022-2032 Figure 25: North America HIV Antivirals Market Value (US$ Mn) Analysis by Sales Channel, 2017 & 2032 Figure 26: North America HIV Antivirals Market Value Share (%) and BPS Analysis by Sales Channel, 2022 & 2032 Figure 27: North America HIV Antivirals Market Y-o-Y Growth (%) Projections by Sales Channel, 2022-2032 Figure 28: North America HIV Antivirals Market Attractiveness by Product, 2022-2032 Figure 29: North America HIV Antivirals Market Attractiveness by Sales Channel, 2022-2032 Figure 30: North America HIV Antivirals Market Attractiveness by Country, 2022-2032 Figure 31: Latin America HIV Antivirals Market Value (US$ Mn) by Product, 2022 & 2032 Figure 32: Latin America HIV Antivirals Market Value (US$ Mn) by Sales Channel, 2022 & 2032 Figure 33: Latin America HIV Antivirals Market Value (US$ Mn) by Country, 2022 & 2032 Figure 34: Latin America HIV Antivirals Market Value (US$ Mn) Analysis by Country, 2017 & 2032 Figure 35: Latin America HIV Antivirals Market Value Share (%) and BPS Analysis by Country, 2022 & 2032 Figure 36: Latin America HIV Antivirals Market Y-o-Y Growth (%) Projections by Country, 2022-2032 Figure 37: Latin America HIV Antivirals Market Value (US$ Mn) Analysis by Product, 2017 & 2032 Figure 38: Latin America HIV Antivirals Market Value Share (%) and BPS Analysis by Product, 2022 & 2032 Figure 39: Latin America HIV Antivirals Market Y-o-Y Growth (%) Projections by Product, 2022-2032 Figure 40: Latin America HIV Antivirals Market Value (US$ Mn) Analysis by Sales Channel, 2017 & 2032 Figure 41: Latin America HIV Antivirals Market Value Share (%) and BPS Analysis by Sales Channel, 2022 & 2032 Figure 42: Latin America HIV Antivirals Market Y-o-Y Growth (%) Projections by Sales Channel, 2022-2032 Figure 43: Latin America HIV Antivirals Market Attractiveness by Product, 2022-2032 Figure 44: Latin America HIV Antivirals Market Attractiveness by Sales Channel, 2022-2032 Figure 45: Latin America HIV Antivirals Market Attractiveness by Country, 2022-2032 Figure 46: Europe HIV Antivirals Market Value (US$ Mn) by Product, 2022 & 2032 Figure 47: Europe HIV Antivirals Market Value (US$ Mn) by Sales Channel, 2022 & 2032 Figure 48: Europe HIV Antivirals Market Value (US$ Mn) by Country, 2022 & 2032 Figure 49: Europe HIV Antivirals Market Value (US$ Mn) Analysis by Country, 2017 & 2032 Figure 50: Europe HIV Antivirals Market Value Share (%) and BPS Analysis by Country, 2022 & 2032 Figure 51: Europe HIV Antivirals Market Y-o-Y Growth (%) Projections by Country, 2022-2032 Figure 52: Europe HIV Antivirals Market Value (US$ Mn) Analysis by Product, 2017 & 2032 Figure 53: Europe HIV Antivirals Market Value Share (%) and BPS Analysis by Product, 2022 & 2032 Figure 54: Europe HIV Antivirals Market Y-o-Y Growth (%) Projections by Product, 2022-2032 Figure 55: Europe HIV Antivirals Market Value (US$ Mn) Analysis by Sales Channel, 2017 & 2032 Figure 56: Europe HIV Antivirals Market Value Share (%) and BPS Analysis by Sales Channel, 2022 & 2032 Figure 57: Europe HIV Antivirals Market Y-o-Y Growth (%) Projections by Sales Channel, 2022-2032 Figure 58: Europe HIV Antivirals Market Attractiveness by Product, 2022-2032 Figure 59: Europe HIV Antivirals Market Attractiveness by Sales Channel, 2022-2032 Figure 60: Europe HIV Antivirals Market Attractiveness by Country, 2022-2032 Figure 61: East Asia HIV Antivirals Market Value (US$ Mn) by Product, 2022 & 2032 Figure 62: East Asia HIV Antivirals Market Value (US$ Mn) by Sales Channel, 2022 & 2032 Figure 63: East Asia HIV Antivirals Market Value (US$ Mn) by Country, 2022 & 2032 Figure 64: East Asia HIV Antivirals Market Value (US$ Mn) Analysis by Country, 2017 & 2032 Figure 65: East Asia HIV Antivirals Market Value Share (%) and BPS Analysis by Country, 2022 & 2032 Figure 66: East Asia HIV Antivirals Market Y-o-Y Growth (%) Projections by Country, 2022-2032 Figure 67: East Asia HIV Antivirals Market Value (US$ Mn) Analysis by Product, 2017 & 2032 Figure 68: East Asia HIV Antivirals Market Value Share (%) and BPS Analysis by Product, 2022 & 2032 Figure 69: East Asia HIV Antivirals Market Y-o-Y Growth (%) Projections by Product, 2022-2032 Figure 70: East Asia HIV Antivirals Market Value (US$ Mn) Analysis by Sales Channel, 2017 & 2032 Figure 71: East Asia HIV Antivirals Market Value Share (%) and BPS Analysis by Sales Channel, 2022 & 2032 Figure 72: East Asia HIV Antivirals Market Y-o-Y Growth (%) Projections by Sales Channel, 2022-2032 Figure 73: East Asia HIV Antivirals Market Attractiveness by Product, 2022-2032 Figure 74: East Asia HIV Antivirals Market Attractiveness by Sales Channel, 2022-2032 Figure 75: East Asia HIV Antivirals Market Attractiveness by Country, 2022-2032 Figure 76: South Asia HIV Antivirals Market Value (US$ Mn) by Product, 2022 & 2032 Figure 77: South Asia HIV Antivirals Market Value (US$ Mn) by Sales Channel, 2022 & 2032 Figure 78: South Asia HIV Antivirals Market Value (US$ Mn) by Country, 2022 & 2032 Figure 79: South Asia HIV Antivirals Market Value (US$ Mn) Analysis by Country, 2017 & 2032 Figure 80: South Asia HIV Antivirals Market Value Share (%) and BPS Analysis by Country, 2022 & 2032 Figure 81: South Asia HIV Antivirals Market Y-o-Y Growth (%) Projections by Country, 2022-2032 Figure 82: South Asia HIV Antivirals Market Value (US$ Mn) Analysis by Product, 2017 & 2032 Figure 83: South Asia HIV Antivirals Market Value Share (%) and BPS Analysis by Product, 2022 & 2032 Figure 84: South Asia HIV Antivirals Market Y-o-Y Growth (%) Projections by Product, 2022-2032 Figure 85: South Asia HIV Antivirals Market Value (US$ Mn) Analysis by Sales Channel, 2017 & 2032 Figure 86: South Asia HIV Antivirals Market Value Share (%) and BPS Analysis by Sales Channel, 2022 & 2032 Figure 87: South Asia HIV Antivirals Market Y-o-Y Growth (%) Projections by Sales Channel, 2022-2032 Figure 88: South Asia HIV Antivirals Market Attractiveness by Product, 2022-2032 Figure 89: South Asia HIV Antivirals Market Attractiveness by Sales Channel, 2022-2032 Figure 90: South Asia HIV Antivirals Market Attractiveness by Country, 2022-2032 Figure 91: Oceania HIV Antivirals Market Value (US$ Mn) by Product, 2022 & 2032 Figure 92: Oceania HIV Antivirals Market Value (US$ Mn) by Sales Channel, 2022 & 2032 Figure 93: Oceania HIV Antivirals Market Value (US$ Mn) by Country, 2022 & 2032 Figure 94: Oceania HIV Antivirals Market Value (US$ Mn) Analysis by Country, 2017 & 2032 Figure 95: Oceania HIV Antivirals Market Value Share (%) and BPS Analysis by Country, 2022 & 2032 Figure 96: Oceania HIV Antivirals Market Y-o-Y Growth (%) Projections by Country, 2022-2032 Figure 97: Oceania HIV Antivirals Market Value (US$ Mn) Analysis by Product, 2017 & 2032 Figure 98: Oceania HIV Antivirals Market Value Share (%) and BPS Analysis by Product, 2022 & 2032 Figure 99: Oceania HIV Antivirals Market Y-o-Y Growth (%) Projections by Product, 2022-2032 Figure 100: Oceania HIV Antivirals Market Value (US$ Mn) Analysis by Sales Channel, 2017 & 2032 Figure 101: Oceania HIV Antivirals Market Value Share (%) and BPS Analysis by Sales Channel, 2022 & 2032 Figure 102: Oceania HIV Antivirals Market Y-o-Y Growth (%) Projections by Sales Channel, 2022-2032 Figure 103: Oceania HIV Antivirals Market Attractiveness by Product, 2022-2032 Figure 104: Oceania HIV Antivirals Market Attractiveness by Sales Channel, 2022-2032 Figure 105: Oceania HIV Antivirals Market Attractiveness by Country, 2022-2032 Figure 106: Middle East and Africa HIV Antivirals Market Value (US$ Mn) by Product, 2022 & 2032 Figure 107: Middle East and Africa HIV Antivirals Market Value (US$ Mn) by Sales Channel, 2022 & 2032 Figure 108: Middle East and Africa HIV Antivirals Market Value (US$ Mn) by Country, 2022 & 2032 Figure 109: Middle East and Africa HIV Antivirals Market Value (US$ Mn) Analysis by Country, 2017 & 2032 Figure 110: Middle East and Africa HIV Antivirals Market Value Share (%) and BPS Analysis by Country, 2022 & 2032 Figure 111: Middle East and Africa HIV Antivirals Market Y-o-Y Growth (%) Projections by Country, 2022-2032 Figure 112: Middle East and Africa HIV Antivirals Market Value (US$ Mn) Analysis by Product, 2017 & 2032 Figure 113: Middle East and Africa HIV Antivirals Market Value Share (%) and BPS Analysis by Product, 2022 & 2032 Figure 114: Middle East and Africa HIV Antivirals Market Y-o-Y Growth (%) Projections by Product, 2022-2032 Figure 115: Middle East and Africa HIV Antivirals Market Value (US$ Mn) Analysis by Sales Channel, 2017 & 2032 Figure 116: Middle East and Africa HIV Antivirals Market Value Share (%) and BPS Analysis by Sales Channel, 2022 & 2032 Figure 117: Middle East and Africa HIV Antivirals Market Y-o-Y Growth (%) Projections by Sales Channel, 2022-2032 Figure 118: Middle East and Africa HIV Antivirals Market Attractiveness by Product, 2022-2032 Figure 119: Middle East and Africa HIV Antivirals Market Attractiveness by Sales Channel, 2022-2032 Figure 120: Middle East and Africa HIV Antivirals Market Attractiveness by Country, 2022-2032
Need specific information?
Request CustomizationExplore Healthcare Insights
View Reports