Reports

- Global Locations -

Headquarters

Future Market Insights, Inc.

Christiana Corporate, 200
Continental Drive, Suite 401,
Newark, Delaware - 19713,
United States

T: +1-845-579-5705

Americas

Future Market Insights, Inc.

616 Corporate Way, Suite 2-9018,
Valley Cottage, NY 10989, United States

T: +1-347-918-3531

MEA

Future Market Insights

1602-6 Jumeirah Bay X2 Tower, Plot No: JLT-PH2-X2A,
Jumeirah Lakes Towers, Dubai,
United Arab Emirates

Europe

Future Market Insights

3rd Floor, 207 Regent Street,
W1B 3HH London
United Kingdom

T: + 44 (0) 20 8123 9659
D: +44 (0) 20 3287 4268

Asia Pacific

Future Market Insights

IndiaLand Global Tech Park, Unit UG-1, Behind Grand HighStreet, Phase 1, Hinjawadi, MH, Pune – 411057, India

Europe Plant-Based Meal Kit Market Outlook (2023 to 2033)

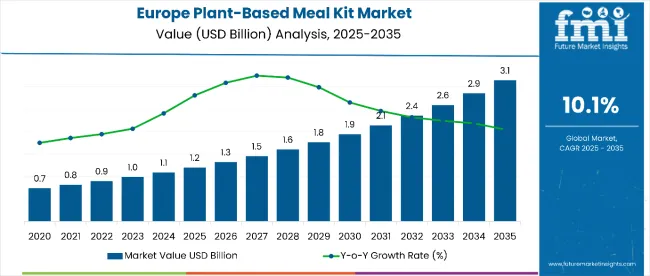
During the projected period, the Europe plant-based meal kit market is expected to record a CAGR of 10.1%. The market size is projected to increase from US$ 1,067.0 million in 2023 to US$ 2,789.0 million by 2033. In 2022, plant-based meat kit sales across Europe totaled revenue of US$ 923 million.

Growing trend of veganism and increasing demand for more convenient plant-based meals are key factors driving the Europe plant-based meal kit market. A shift towards vegan products among consumers has been observed in Europe during the upcoming decade. Driven by this, plant-based meal kit demand is set to rise rapidly in the region.

Plant-based meal kits are of two types which include prepared meals and meal kits. Prepared meals are frequently described as meals that have been precooked and only need a minimal amount of preparation before eating.

On the other hand, normal kit meals come with pre-measured ingredients and easy-to-follow instructions. They can be cooked with comfort in the kitchen.

Plant-based meal kits can be purchased through both online and offline sales channels. These delectable vegan meal kits offer a quick way to reduce meat consumption, save a lot of time, and get creative in the kitchen.

Plant-based meal kits are gaining immense popularity across European countries such as the United Kingdom and Germany as more and more people are turning to plant-based diets for their health and environmental benefits.

They allow consumers to prepare various meals without wasting their time in shopping and cooking from scratch. Hence, growing demand for more convenient vegan products that can help people to save time will boost plant-based meal kit sales across Europe during the projection period.

Leading plant-based meal kit companies are focusing on expanding their portfolios by launching new innovative products through both offline stores and delivery services. This is positively influencing the overall plant-based meal kit market across Europe.

Attributes Key Insights
Europe Plant-Based Meal Kits Market Estimated Value (2023) US$ 1,067.0 million
Projected Market Size (2033) US$ 2,789.0 million
Value-based CAGR (2023 to 2033) 10.1%

Don't pay for what you don't need

Customize your report by selecting specific countries or regions and save 30%!

2018 to 2022 Europe Plant-Based Meal Kit Sales Outlook Compared to Demand Forecast from 2023 to 2033

According to the latest report by Future Market Insights, plant-based meal kit sales increased at a CAGR of 10.2% from 2018 to 2022. Total market size in Europe was estimated to be US$ 923 million in 2022.

Between 2023 and 2033, Europe’s plant-based meal kit industry is forecast to accelerate at 10.1% CAGR, generating revenues worth US$ 2,789.0 million by the end of 2033.

Rising demand for plant-based meals due to increasing vegan population, surge in cardiovascular diseases, and focus on improving animal welfare is providing impetus to the plant-based meal kits market in Europe.

Similarly, the researcher’s analysis projects that venture investments in plant-based foods and constant innovation in food technology are expected to propel plant-based meal kit demand across the region.

Key plant-based meal kit manufacturers are enhancing their production capacities, equipping the latest machinery, and introducing novel products and services to expand their customer base in Europe and other regions.

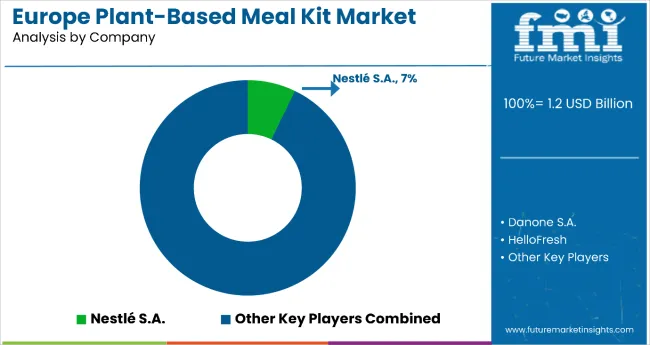
A few leading companies such as Danone S.A. (France), HUL, and Nestle are using novel manufacturing technologies such as blockchain and digital connectivity to improve output-efficient plant-based meal kit services. Even retailers are also expanding their shelf space to increase the visibility of plant-based meal kits.

Comparative View of Adjacent Markets

Plant-Based Beef Market:

Attributes Plant-Based Beef Market
CAGR (2023 to 2033) 20.6%
Market Value (2023) US$ 4.1 billion
Growth Factor Rise of veganism and growing awareness about the health hazards of consuming red meat is fueling growth in the global plant-based beef market.
Opportunity Government-funded research and development for plant-based substitutes is a key factor opening up several business opportunities.
Key Trends Introduction of enhanced versions that meet specific consumer expectations and rising sales through online platforms will boost plant-based beef sales through 2033.

Meat Substitutes Market:

Attributes Meat Substitutes Market
CAGR (2023 to 2033) 23%
Market Value (2023) US$ 8.5 billion
Growth Factor Growing awareness about the benefits of eating a vegan diet is driving the global meat substitutes market.
Opportunity Increasing government initiatives aimed at encouraging the adoption of meat alternatives are creating lucrative growth opportunities for meat substitute manufacturers.
Key Trends Development of authentic meat substitutes with similar taste and texture as that of meat products will boost sales over the next ten years.
Nandini Roy Choudhury

Principal Consultant

Talk to Analyst

Find your sweet spots for generating winning opportunities in this market.

Country-wise Insights

How will Growth Unfold in the United Kingdom Plant-Based Meal Kits Market?

Increasing Preference for Sustainable Dietary Options Boosting the United Kingdom Market

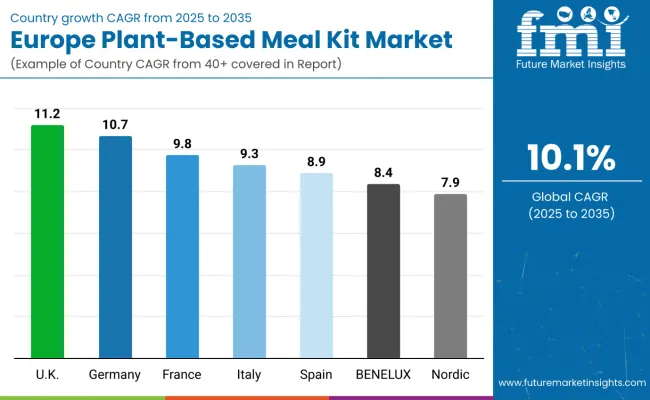
As per Future Market Insights, the United Kingdom holds a prominent share of Europe plant-based meal kit market and it is anticipated to accelerate at an impressive pace over the next ten years.

Increasing preference for sustainable food options along with increasing vegan population is a primary factor driving demand for plant-based meal kits in the United Kingdom. Similarly, rising preference for convenient meals that can be instantly prepared is boosting plant-based meal kit sales across the country.

Plant-based meal kits offer several environmental benefits as they can reduce emissions of harmful substances and help to tackle climate change. They significantly reduce consumption of water and require lesser resources for production purposes, thereby making them an ideal option for consumers looking for sustainable dietary options.

Leading plant-based meal kit manufacturers and providers are expanding their businesses by acquiring smaller companies. They are also aiming at launching new plant-based meal kits and services to strengthen their position in the region

For instance, in 2021, Planty, a vegan food delivery startup located in London raised funding from investors to expand its operations and presence across Europe. Along with expanding its current line of frozen meals, Planty also aims to launch plant-based breakfast options, desserts, and snacks.

What is Driving Demand for Plant-Based Meal Kits in Germany?

Rise in Vegan and Flexitarian Population Propelling Plant-Based Meal Kits in Germany

Germany’s plant-based meal kits market is forecast to expand at a healthy CAGR during the assessment period owing to the rising trend of veganism and flexitarianism and growing demand for more convenient food options that can be prepared instantly.

People across Germany are unable to cook for themselves due to their busy lifestyles. Due to this, they consider alternative options to cooking such as pre-cooked meals and frozen meals which require comparatively less time to cook. This is one of the key factors driving plant-based meal kits’ demand in the country.

Several plant-based food companies in Germany are innovating to meet expectations of customers. For example, Esencia Foods became the first startup to make vegan seafood from mycelium. An aim behind this innovation is to promote sustainable ocean stewardship with the help of mycelium alternatives.

Category-wise Insights

Why do Consumers in Europe Prefer Prepared Plant-Based Meal Kits Over Meal Kits?

Easy and Convenient Nature of Prepared Meal Kits Making Them Popular Across Europe

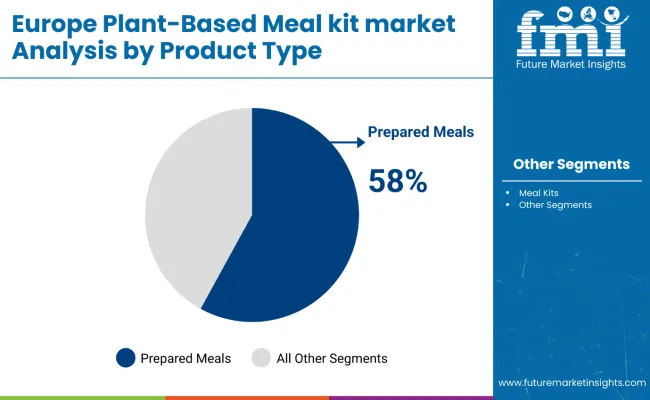
According to the latest analysis by Future Market Insights, prepared meal kit segment is forecast to showcase a significant growth rate during the projection period. This is due to rising popularity of prepared meat kits across European nations due to their easy-to-prepare and convenient nature.

Prepared meal kits are the epitome of convenience. Meal kits that have already been prepared can be fully cooked with little effort before consumption. These kits (prepared meal kits) allow consumers to save time and energy by eliminating the need for shopping, preparing, and cooking from scratch. Hence, people, especially workaholics, opt for prepared plant-based meal kits.

Which Form of Plant-Based Meal Kits is Mostly Preferred by Consumers?

Demand Remains High for Chilled Plant-Based Meat Kits

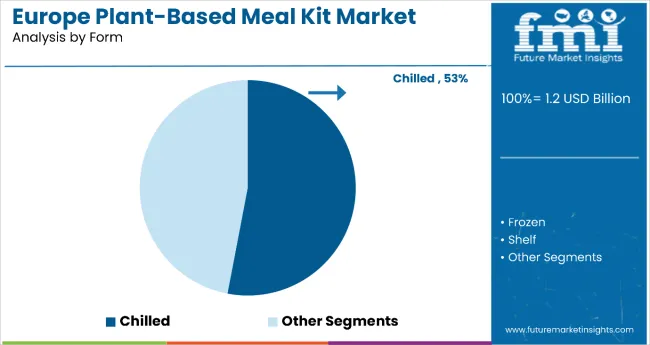
Based on form, the market has been segmented into chilled plant-based meal kits, frozen plant-based meal kits, and shelf stable plant-based meal kits. Among these, chilled plant-based meal kits segment holds a value share of 53% in Europe market.

Growth of the target segment is attributed to rising adoption of chilled plant-based meal kits across European countries such as Germany and the United Kingdom due to their various advantages, including high nutritional content.

Consumers nowadays are very well aware of the food that they consume. In order to extend the shelf life of frozen plant-based meal kits, they are deep frozen at a temperature of -18° for manufacturing, although this reduces their nutritional content.

While chilled plant-based meal kits have to be kept at a temperature of 8° or below. Consumers can store it normally in their refrigerators and consume it when it is required. Chilling plant-based meals results in no nutritional loss.

People across Europe are showing a keen inclination towards consuming chilled plant-based meals since they are easy to store and do not lose as much of their nutritional value.

Which Sales Channel Generates Maximum Revenues in the Market?

Store-based Retailing Segment Generating Lucrative Revenues

As per FMI, the store-based retailing segment currently holds a prominent share of Europe market and it is forecast to generate maximum revenues throughout the forecast period. This is due to rising consumer inclination towards purchasing plant-based meal kits from supermarkets and convenience stores.

Store-based retailing includes modern grocery retailers such as convenience stores, hypermarkets, and supermarkets, which consumers can visit anytime to purchase. These stores offer various discounts which attract the consumers to repurchase the product.

Even though store-based sales generate more revenue in the market, online sales have shown a more lucrative growth rate in the market across European countries. Hence, FMI also predicts online retailing segment to generate significant revenues during the assessment period.

Get the data you need at a Fraction of the cost

Personalize your report by choosing insights you need
and save 40%!

Competitive Landscape

The market for plant-based meal kits across Europe is becoming highly competitive as more and more businesses are entering this marketplace. Various companies are utilizing strategies such as customization of meals, introducing loyalty programs, and rewarding loyal customers to gain a competitive edge in the market.

They are also employing strategies such as launching new products and services, facility expansions, collaborations, partnerships, mergers, and acquisitions to expand their global footprint.

For instance,

  • In 2022, one of the key food manufacturers, Samworth introduced ‘The Flavorist’, a plant-based meal kit brand in the United Kingdom. The business hopes that its next plant-based meal kit will encourage customers to appreciate inventive cooking.
  • In April 2021, the acquisition of the vegan brands’ Dream and WestSoy from The Hain Celestial Group, Inc. was announced by SunOpta in April 2021. The acquisition of these businesses will help SunOpta's plant-based food and beverage business sector expand.

Report Scope

Attribute Details
Estimated Market Size (2023) US$ 1,067.0 million
Projected Market Size (2033) US$ 2,789.0 million
Anticipated Growth Rate (2023 to 2033) 10.1% CAGR
Period of Forecast 2023 to 2033
Considered Historical Data 2018 to 2022
Market Analysis US$ million for Value and MT for Volume
Regions Covered Europe
Key Countries Covered
  • Germany
  • France
  • Italy
  • Spain
  • United Kingdom
  • BENELUX
  • Nordic
  • Russia
  • Poland
Key Segments Covered
  • Product
  • Form
  • Sales Channel
  • Region
Key Companies Profiled
  • Beyond Meat Inc.
  • Danone S.A.
  • Amy’s Kitchen, Inc.
  • The Hain Celestial Group, Inc.
  • Daiya Foods Inc.
  • Nestlé S.A.
  • Unilever PLC
  • Plamil Foods Ltd.
  • The Meatless Farm (United Kingdom) (a subsidiary of Morten Toft Bech)
  • HelloFresh
  • Purple Carrot
  • Plantable
  • Factor
  • Sakara Life
  • Freshly
  • Daily Harvest
  • Gousto
  • Planty
  • Simply Cook
Report Coverage Market Forecast, Company Share Analysis, Competitive Landscape, DROT Analysis, Market Dynamics and Challenges, and Strategic Growth Initiatives

Europe Plant-Based Meal Kit Market by Category

By Product:

  • Meal Kit
  • Prepared Meal Kit

By Form:

  • Chilled
  • Frozen
  • Shelf Stable

By Sales Channel:

  • Store-based retailing
    • Convenience Store
    • Discounters
    • Forecourt Retailers
    • Hypermarkets/ Supermarkets
    • Food Specialist
    • Independent Small Grocers
    • Other Grocery Retailers
  • Online retail

By Country:

  • Germany
  • France
  • Italy
  • Spain
  • United Kingdom
  • BENELUX
  • Nordic
  • Russia
  • Poland

Frequently Asked Questions

What is the Net Worth of the Plant-based Meal Kit Market in Europe in Current Years?

The net worth of pant-based meal kits sold in Europe could sum up to US$ 1,067 million in 2023.

What is the Projected Rate of Advancement for the Europe Plant-based Meal Kit Market?

The market is projected to record a 10.1% CAGR through 2033.

How Plant-based Meal Kit Market is Performing in Europe?

The overall market valuation in Europe is predicted to reach US$ 2,789 million by 2033.

What is the Share of Germany in the Europe Plant-based Meal Kit Market?

The sales of pant-based meal kits was figured out to be higher than other European countries.

Who are the Renowned Suppliers for the Plant-based Meal Kit in Europe Region?

Beyond Meat, Danone, and Amy’s Kitchen are the leading suppliers in the present European market.

Table of Content

1. Executive Summary | Europe Plant-Based Meal Kit Market 

    1.1. Europe Plant Based Meal Kits Market Outlook

    1.2. Demand Side Trends

    1.3. Supply Side Trends

    1.4. Technology Roadmap

    1.5. Analysis and Recommendations

2. Market Overview

    2.1. Market Coverage / Taxonomy

    2.2. Market Definition

    2.3. Installed Base Capacity (2022E)

    2.4. Replacement Rate (2022E)

3. Market Outlook

    3.1. Historical Market Size (in Value (US$ Million) and Volume (MT) Analysis, 2018 to 2022

    3.2. Current and Future Market Size (in Value (US$ Million) and Volume (MT) Analysis, 2023 to 2033

        3.2.1. Y-o-Y Growth Trend Analysis

        3.2.2. Absolute $ Opportunity Analysis

4. Market Dynamics

    4.1. Drivers

        4.1.1. Supply Side Drivers

        4.1.2. Demand Side drivers

        4.1.3. Economic Side Drivers

    4.2. Restraints

    4.3. Opportunity

    4.4. Market trends By Region

    4.5. Forecast Factors - Relevance & Impact

    4.6. Regulations and Policies

    4.7. Impact of the Crisis (COVID)

5. Market - Pricing Analysis

    5.1. Price Point Assessment by Region

        5.1.1. Manufacturer-Level Pricing

        5.1.2. Distributor Level Pricing

    5.2. Price Point Assessment By Product Type

    5.3. Price Forecast till 2033

6. Value Chain Analysis

    6.1. Operating margins at each node of the supply chain

    6.2. List of Active Market Participants

7. Market Size (in Value (US$ Million) and Volume (MT) Analysis 2018 to 2022 and Forecast, 2023 to 2033

    7.1. Historical Market Size (in Value (US$ Million) and Volume (MT) Analysis, 2018 to 2022

    7.2. Current and Future Market Size (in Value (US$ Million) and Volume (MT) Analysis, 2023 to 2033

        7.2.1. Y-o-Y Growth Trend Analysis

        7.2.2. Absolute $ Opportunity Analysis

8. Market Analysis 2018 to 2022 and Forecast 2023 to 2033, By Product Type

    8.1. Introduction / Key Findings

    8.2. Historical Market Size (in Value (US$ Million) and Volume (MT) Analysis by Product Type, 2018 to 2022

    8.3. Current and Future Market Size (in Value (US$ Million) and Volume (MT) Analysis and Forecast by Product Type, 2023 to 2033

        8.3.1. Meal kits

        8.3.2. Prepared Meal

    8.4. Market Attractiveness Analysis By Product Type

9. Market Analysis 2018 to 2022 and Forecast 2023 to 2033, By Form

    9.1. Introduction / Key Findings

    9.2. Historical Market Size (in Value (US$ Million) and Volume (MT) Analysis by Form, 2018 to 2022

    9.3. Current and Future Market Size (in Value (US$ Million) and Volume (MT) Analysis and Forecast by Source, 2023 to 2033

        9.3.1. Chilled

        9.3.2. Frozen

        9.3.3. Shelf Stable

    9.4. Market Attractiveness Analysis By Form

10. Market Analysis 2018 to 2022 and Forecast 2023 to 2033, By Sales Channel

    10.1. Introduction / Key Findings

    10.2. Historical Market Size (in Value (US$ Million) and Volume (MT) Analysis by Distribution Channel, 2018 to 2022

    10.3. Current and Future Market Size (in Value (US$ Million) and Volume (MT) Analysis and Forecast by Distribution Channel, 2023 to 2033

            10.3.1.1. Store-Based Retailing

                10.3.1.1.1. Convenience Store

                10.3.1.1.2. Discounters

                10.3.1.1.3. Forecourt Retailers

                10.3.1.1.4. Hypermarkets/ Supermarkets

                10.3.1.1.5. Food Specialist

                10.3.1.1.6. Independent Small Grocers

                10.3.1.1.7. Other Grocery Retailers

            10.3.1.2. Online Retailing

    10.4. Market Attractiveness Analysis By Sales Channel

11. Market Analysis 2018 to 2022 and Forecast 2023 to 2033, by Country

    11.1. Introduction

    11.2. Historical Market Size (in Value (US$ Million) and Volume (MT) Analysis by Region, 2018 to 2022

    11.3. Current Market Size (in Value (US$ Million) and Volume (MT) Analysis and Forecast by Country, 2023 to 2033

        11.3.1. Germany

        11.3.2. France

        11.3.3. Italy

        11.3.4. Spain

        11.3.5. United Kingdom

        11.3.6. BENELUX

        11.3.7. Nordic

        11.3.8. Russia

        11.3.9. Poland

    11.4. Market Attractiveness Analysis By Country

12. Germany Market Analysis 2018 to 2022 and Forecast 2023 to 2033

    12.1. Introduction

    12.2. Pricing Analysis

    12.3. Historical Market Size (US$ Million) and Volume Trend Analysis by Market Taxonomy, 2018 to 2022

    12.4. Market Size (US$ Million) and Volume Forecast by Market Taxonomy, 2023 to 2033

        12.4.1. By Product Type

        12.4.2. By Form

        12.4.3. By Sales Channel

    12.5. Market Attractiveness Analysis

        12.5.1. By Product Type

        12.5.2. By Form

        12.5.3. By Sales Channel

    12.6. Market Trends

    12.7. Key Market Participants - Intensity Mapping

    12.8. Drivers and Restraints - Impact Analysis

13. France Market Analysis 2018 to 2022 and Forecast 2023 to 2033

    13.1. Introduction

    13.2. Pricing Analysis

    13.3. Historical Market Size (US$ Million) and Volume Trend Analysis by Market Taxonomy, 2018 to 2022

    13.4. Market Size (US$ Million) and Volume Forecast by Market Taxonomy, 2023 to 2033

        13.4.1. By Product Type

        13.4.2. By Form

        13.4.3. By Sales Channel

    13.5. Market Attractiveness Analysis

        13.5.1. By Product Type

        13.5.2. By Form

        13.5.3. By Sales Channel

    13.6. Market Trends

    13.7. Key Market Participants - Intensity Mapping

    13.8. Drivers and Restraints - Impact Analysis

14. Italy Market Analysis 2018 to 2022 and Forecast 2023 to 2033

    14.1. Introduction

    14.2. Pricing Analysis

    14.3. Historical Market Size (US$ Million) and Volume Trend Analysis by Market Taxonomy, 2018 to 2022

    14.4. Market Size (US$ Million) and Volume Forecast by Market Taxonomy, 2023 to 2033

        14.4.1. By Product Type

        14.4.2. By Form

        14.4.3. By Sales Channel

    14.5. Market Attractiveness Analysis

        14.5.1. By Product Type

        14.5.2. By Form

        14.5.3. By Sales Channel

    14.6. Market Trends

    14.7. Key Market Participants - Intensity Mapping

    14.8. Drivers and Restraints - Impact Analysis

15. Spain Market Analysis 2018 to 2022 and Forecast 2023 to 2033

    15.1. Introduction

    15.2. Pricing Analysis

    15.3. Historical Market Size (US$ Million) and Volume Trend Analysis by Market Taxonomy, 2018 to 2022

    15.4. Market Size (US$ Million) and Volume Forecast by Market Taxonomy, 2023 to 2033

        15.4.1. By Product Type

        15.4.2. By Form

        15.4.3. By Sales Channel

    15.5. Market Attractiveness Analysis

        15.5.1. By Product Type

        15.5.2. By Form

        15.5.3. By Sales Channel

    15.6. Market Trends

    15.7. Key Market Participants - Intensity Mapping

    15.8. Drivers and Restraints - Impact Analysis

16. United Kingdom Market Analysis 2018 to 2022 and Forecast 2023 to 2033

    16.1. Introduction

    16.2. Pricing Analysis

    16.3. Historical Market Size (US$ Million) and Volume Trend Analysis by Market Taxonomy, 2018 to 2022

    16.4. Market Size (US$ Million) and Volume Forecast by Market Taxonomy, 2023 to 2033

        16.4.1. By Product Type

        16.4.2. By Form

        16.4.3. By Sales Channel

    16.5. Market Attractiveness Analysis

        16.5.1. By Product Type

        16.5.2. By Form

        16.5.3. By Sales Channel

    16.6. Market Trends

    16.7. Key Market Participants - Intensity Mapping

    16.8. Drivers and Restraints - Impact Analysis

17. BENELUX Market Analysis 2018 to 2022 and Forecast 2023 to 2033

    17.1. Introduction

    17.2. Pricing Analysis

    17.3. Historical Market Size (US$ Million) and Volume Trend Analysis by Market Taxonomy, 2018 to 2022

    17.4. Market Size (US$ Million) and Volume Forecast by Market Taxonomy, 2023 to 2033

        17.4.1. By Product Type

        17.4.2. By Form

        17.4.3. By Sales Channel

    17.5. Market Attractiveness Analysis

        17.5.1. By Product Type

        17.5.2. By Form

        17.5.3. By Sales Channel

    17.6. Market Trends

    17.7. Key Market Participants - Intensity Mapping

    17.8. Drivers and Restraints - Impact Analysis

18. Nordic Market Analysis 2018 to 2022 and Forecast 2023 to 2033

    18.1. Introduction

    18.2. Pricing Analysis

    18.3. Historical Market Size (US$ Million) and Volume Trend Analysis by Market Taxonomy, 2018 to 2022

    18.4. Market Size (US$ Million) and Volume Forecast by Market Taxonomy, 2023 to 2033

        18.4.1. By Product Type

        18.4.2. By Form

        18.4.3. By Sales Channel

    18.5. Market Attractiveness Analysis

        18.5.1. By Product Type

        18.5.2. By Form

        18.5.3. By Sales Channel

    18.6. Market Trends

    18.7. Key Market Participants - Intensity Mapping

    18.8. Drivers and Restraints - Impact Analysis

19. Russia Market Analysis 2018 to 2022 and Forecast 2023 to 2033

    19.1. Introduction

    19.2. Pricing Analysis

    19.3. Historical Market Size (US$ Million) and Volume Trend Analysis by Market Taxonomy, 2018 to 2022

    19.4. Market Size (US$ Million) and Volume Forecast by Market Taxonomy, 2023 to 2033

        19.4.1. By Product Type

        19.4.2. By Form

        19.4.3. By Sales Channel

    19.5. Market Attractiveness Analysis

        19.5.1. By Product Type

        19.5.2. By Form

        19.5.3. By Sales Channel

    19.6. Market Trends

    19.7. Key Market Participants - Intensity Mapping

    19.8. Drivers and Restraints - Impact Analysis

20. Poland Market Analysis 2018 to 2022 and Forecast 2023 to 2033

    20.1. Introduction

    20.2. Pricing Analysis

    20.3. Historical Market Size (US$ Million) and Volume Trend Analysis by Market Taxonomy, 2018 to 2022

    20.4. Market Size (US$ Million) and Volume Forecast by Market Taxonomy, 2023 to 2033

        20.4.1. By Product Type

        20.4.2. By Form

        20.4.3. By Sales Channel

    20.5. Market Attractiveness Analysis

        20.5.1. By Product Type

        20.5.2. By Form

        20.5.3. By Sales Channel

    20.6. Market Trends

    20.7. Key Market Participants - Intensity Mapping

    20.8. Drivers and Restraints - Impact Analysis

21. Market Structure Analysis

    21.1. Market Competition - a Dashboard View

    21.2. Industry Structure Analysis

        21.2.1. % tier 1 market players

        21.2.2. % tier 2 market players

        21.2.3. % tier 3 market players

    21.3. Market Company Share Analysis

        21.3.1. For Tier 1 Market Players, 2022

        21.3.2. Company Market Share Analysis of Top 5 Players, By Country

    21.4. Key Participants Market Presence (Intensity Mapping) by Country

22. Competition Analysis

    22.1. Competition Dashboard

    22.2. Competition Benchmarking

    22.3. Competition Deep Dive

        22.3.1. Plamil Foods Ltd

            22.3.1.1. Product Portfolio

            22.3.1.2. Product Claim

            22.3.1.3. Revenue by Market Segments (Product/ Form/Channel/Country)

            22.3.1.4. Sales Footprint

            22.3.1.5. Strategy Overview

                22.3.1.5.1. Marketing Strategy

                22.3.1.5.2. Product Strategy

                22.3.1.5.3. Channel Strategy

        22.3.2. Beyond Meat Inc.

            22.3.2.1. Product Portfolio

            22.3.2.2. Product Claim

            22.3.2.3. Revenue by Market Segments (Product/ Form/Channel/Country)

            22.3.2.4. Sales Footprint

            22.3.2.5. Strategy Overview

                22.3.2.5.1. Marketing Strategy

                22.3.2.5.2. Product Strategy

                22.3.2.5.3. Channel Strategy

        22.3.3. Danone S.A.

            22.3.3.1. Product Portfolio

            22.3.3.2. Product Claim

            22.3.3.3. Revenue by Market Segments (Product/ Form/Channel/Country)

            22.3.3.4. Sales Footprint

            22.3.3.5. Strategy Overview

                22.3.3.5.1. Marketing Strategy

                22.3.3.5.2. Product Strategy

                22.3.3.5.3. Channel Strategy

        22.3.4. Amy’s Kitchen, Inc.

            22.3.4.1. Product Portfolio

            22.3.4.2. Product Claim

            22.3.4.3. Revenue by Market Segments (Product/ Form/Channel/Country)

            22.3.4.4. Sales Footprint

            22.3.4.5. Strategy Overview

                22.3.4.5.1. Marketing Strategy

                22.3.4.5.2. Product Strategy

                22.3.4.5.3. Channel Strategy

        22.3.5. The Hain Celestial Group, Inc.

            22.3.5.1. Product Portfolio

            22.3.5.2. Product Claim

            22.3.5.3. Revenue by Market Segments (Product/ Form/Channel/Country)

            22.3.5.4. Sales Footprint

            22.3.5.5. Strategy Overview

                22.3.5.5.1. Marketing Strategy

                22.3.5.5.2. Product Strategy

                22.3.5.5.3. Channel Strategy

        22.3.6. Daiya Foods Inc.

            22.3.6.1. Product Portfolio

            22.3.6.2. Product Claim

            22.3.6.3. Revenue by Market Segments (Product/ Form/Channel/Country)

            22.3.6.4. Sales Footprint

            22.3.6.5. Strategy Overview

                22.3.6.5.1. Marketing Strategy

                22.3.6.5.2. Product Strategy

                22.3.6.5.3. Channel Strategy

        22.3.7. Nestlé S.A.

            22.3.7.1. Product Portfolio

            22.3.7.2. Product Claim

            22.3.7.3. Revenue by Market Segments (Product/ Form/Channel/Country)

            22.3.7.4. Sales Footprint

            22.3.7.5. Strategy Overview

                22.3.7.5.1. Marketing Strategy

                22.3.7.5.2. Product Strategy

                22.3.7.5.3. Channel Strategy

        22.3.8. Unilever PLC

            22.3.8.1. Product Portfolio

            22.3.8.2. Product Claim

            22.3.8.3. Revenue by Market Segments (Product/ Form/Channel/Country)

            22.3.8.4. Sales Footprint

            22.3.8.5. Strategy Overview

                22.3.8.5.1. Marketing Strategy

                22.3.8.5.2. Product Strategy

                22.3.8.5.3. Channel Strategy

        22.3.9. The Meatless Farm

            22.3.9.1. Product Portfolio

            22.3.9.2. Product Claim

            22.3.9.3. Revenue by Market Segments (Product/ Form/Channel/Country)

            22.3.9.4. Sales Footprint

            22.3.9.5. Strategy Overview

                22.3.9.5.1. Marketing Strategy

                22.3.9.5.2. Product Strategy

                22.3.9.5.3. Channel Strategy

        22.3.10. HelloFresh

            22.3.10.1. Product Portfolio

            22.3.10.2. Product Claim

            22.3.10.3. Revenue by Market Segments (Product/ Form/Channel/Country)

            22.3.10.4. Sales Footprint

            22.3.10.5. Strategy Overview

                22.3.10.5.1. Marketing Strategy

                22.3.10.5.2. Product Strategy

                22.3.10.5.3. Channel Strategy

        22.3.11. Purple Carrot

            22.3.11.1. Product Portfolio

            22.3.11.2. Product Claim

            22.3.11.3. Revenue by Market Segments (Product/ Form/Channel/Country)

            22.3.11.4. Sales Footprint

            22.3.11.5. Strategy Overview

                22.3.11.5.1. Marketing Strategy

                22.3.11.5.2. Product Strategy

                22.3.11.5.3. Channel Strategy

        22.3.12. Plantable

            22.3.12.1. Product Portfolio

            22.3.12.2. Product Claim

            22.3.12.3. Revenue by Market Segments (Product/ Form/Channel/Country)

            22.3.12.4. Sales Footprint

            22.3.12.5. Strategy Overview

                22.3.12.5.1. Marketing Strategy

                22.3.12.5.2. Product Strategy

                22.3.12.5.3. Channel Strategy

        22.3.13. Factor

            22.3.13.1. Product Portfolio

            22.3.13.2. Product Claim

            22.3.13.3. Revenue by Market Segments (Product/ Form/Channel/Country)

            22.3.13.4. Sales Footprint

            22.3.13.5. Strategy Overview

                22.3.13.5.1. Marketing Strategy

                22.3.13.5.2. Product Strategy

                22.3.13.5.3. Channel Strategy

        22.3.14. Sakara Life

            22.3.14.1. Product Portfolio

            22.3.14.2. Product Claim

            22.3.14.3. Revenue by Market Segments (Product/ Form/Channel/Country)

            22.3.14.4. Sales Footprint

            22.3.14.5. Strategy Overview

                22.3.14.5.1. Marketing Strategy

                22.3.14.5.2. Product Strategy

                22.3.14.5.3. Channel Strategy

        22.3.15. Freshly

            22.3.15.1. Product Portfolio

            22.3.15.2. Product Claim

            22.3.15.3. Revenue by Market Segments (Product/ Form/Channel/Country)

            22.3.15.4. Sales Footprint

            22.3.15.5. Strategy Overview

                22.3.15.5.1. Marketing Strategy

                22.3.15.5.2. Product Strategy

                22.3.15.5.3. Channel Strategy

        22.3.16. Daily Harvest

            22.3.16.1. Product Portfolio

            22.3.16.2. Product Claim

            22.3.16.3. Revenue by Market Segments (Product/ Form/Channel/Country)

            22.3.16.4. Sales Footprint

            22.3.16.5. Strategy Overview

                22.3.16.5.1. Marketing Strategy

                22.3.16.5.2. Product Strategy

                22.3.16.5.3. Channel Strategy

        22.3.17. Gousto

            22.3.17.1. Product Portfolio

            22.3.17.2. Product Claim

            22.3.17.3. Revenue by Market Segments (Product/ Form/Channel/Country)

            22.3.17.4. Sales Footprint

            22.3.17.5. Strategy Overview

                22.3.17.5.1. Marketing Strategy

                22.3.17.5.2. Product Strategy

                22.3.17.5.3. Channel Strategy

        22.3.18. Planty

            22.3.18.1. Product Portfolio

            22.3.18.2. Product Claim

            22.3.18.3. Revenue by Market Segments (Product/ Form/Channel/Country)

            22.3.18.4. Sales Footprint

            22.3.18.5. Strategy Overview

                22.3.18.5.1. Marketing Strategy

                22.3.18.5.2. Product Strategy

                22.3.18.5.3. Channel Strategy

        22.3.19. Simply Cook

            22.3.19.1. Product Portfolio

            22.3.19.2. Product Claim

            22.3.19.3. Revenue by Market Segments (Product/ Form/Channel/Country)

            22.3.19.4. Sales Footprint

            22.3.19.5. Strategy Overview

                22.3.19.5.1. Marketing Strategy

                22.3.19.5.2. Product Strategy

                22.3.19.5.3. Channel Strategy

Note: Market Assessment shall be Provided for Likely Scenario

23. Assumptions and Acronyms Used

24. Research Methodology

List of Tables

Table 1: Market Value (US$ Million) Forecast by Region, 2018 to 2033

Table 2: Market Volume (MT) Forecast by Region, 2018 to 2033

Table 3: Market Value (US$ Million) Forecast by Product Type, 2018 to 2033

Table 4: Market Volume (MT) Forecast by Product Type, 2018 to 2033

Table 5: Market Value (US$ Million) Forecast by Form, 2018 to 2033

Table 6: Market Volume (MT) Forecast by Form, 2018 to 2033

Table 7: Market Value (US$ Million) Forecast by Sales Channel, 2018 to 2033

Table 8: Market Volume (MT) Forecast by Sales Channel, 2018 to 2033

Table 10: Germany Market Value (US$ Million) Forecast by Product Type, 2018 to 2033

Table 11: Germany Market Volume (MT) Forecast by Product Type, 2018 to 2033

Table 12: Germany Market Value (US$ Million) Forecast by Form, 2018 to 2033

Table 13: Germany Market Volume (MT) Forecast by Form, 2018 to 2033

Table 14: Germany Market Value (US$ Million) Forecast by Sales Channel, 2018 to 2033

Table 15: Germany Market Volume (MT) Forecast by Sales Channel, 2018 to 2033

Table 16: France Market Value (US$ Million) Forecast by Product Type, 2018 to 2033

Table 17: France Market Volume (MT) Forecast by Product Type, 2018 to 2033

Table 18: France Market Value (US$ Million) Forecast by Form, 2018 to 2033

Table 19: France Market Volume (MT) Forecast by Form, 2018 to 2033

Table 20: France Market Value (US$ Million) Forecast by Sales Channel, 2018 to 2033

Table 21: France Market Volume (MT) Forecast by Sales Channel, 2018 to 2033

Table 22: Italy Market Value (US$ Million) Forecast by Product Type, 2018 to 2033

Table 23: Italy Market Volume (MT) Forecast by Product Type, 2018 to 2033

Table 24: Italy Market Value (US$ Million) Forecast by Form, 2018 to 2033

Table 25: Italy Market Volume (MT) Forecast by Form, 2018 to 2033

Table 26: Italy Market Value (US$ Million) Forecast by Sales Channel, 2018 to 2033

Table 27: Italy Market Volume (MT) Forecast by Sales Channel, 2018 to 2033

Table 28: Spain Market Value (US$ Million) Forecast by Product Type, 2018 to 2033

Table 29: Spain Market Volume (MT) Forecast by Product Type, 2018 to 2033

Table 30: Spain Market Value (US$ Million) Forecast by Form, 2018 to 2033

Table 31: Spain Market Volume (MT) Forecast by Form, 2018 to 2033

Table 32: Spain Market Value (US$ Million) Forecast by Sales Channel, 2018 to 2033

Table 33: Spain Market Volume (MT) Forecast by Sales Channel, 2018 to 2033

Table 34: United Kingdom Market Value (US$ Million) Forecast by Product Type, 2018 to 2033

Table 35: United Kingdom Market Volume (MT) Forecast by Product Type, 2018 to 2033

Table 36: United Kingdom Market Value (US$ Million) Forecast by Form, 2018 to 2033

Table 37: United Kingdom Market Volume (MT) Forecast by Form, 2018 to 2033

Table 38: United Kingdom Market Value (US$ Million) Forecast by Sales Channel, 2018 to 2033

Table 39: United Kingdom Market Volume (MT) Forecast by Sales Channel, 2018 to 2033

Table 40: Russia Market Value (US$ Million) Forecast by Product Type, 2018 to 2033

Table 41: Russia Market Volume (MT) Forecast by Product Type, 2018 to 2033

Table 42: Russia Market Value (US$ Million) Forecast by Form, 2018 to 2033

Table 43: Russia Market Volume (MT) Forecast by Form, 2018 to 2033

Table 44: Russia Market Value (US$ Million) Forecast by Sales Channel, 2018 to 2033

Table 45: Russia Market Volume (MT) Forecast by Sales Channel, 2018 to 2033

Table 46: Nordic Market Value (US$ Million) Forecast by Product Type, 2018 to 2033

Table 47: Nordic Market Volume (MT) Forecast by Product Type, 2018 to 2033

Table 48: Nordic Market Value (US$ Million) Forecast by Form, 2018 to 2033

Table 49: Nordic Market Volume (MT) Forecast by Form, 2018 to 2033

Table 50: Nordic Market Value (US$ Million) Forecast by Sales Channel, 2018 to 2033

Table 51: BENELUX Market Volume (MT) Forecast by Sales Channel, 2018 to 2033

Table 52: BENELUX Market Value (US$ Million) Forecast by Product Type, 2018 to 2033

Table 53: BENELUX Market Volume (MT) Forecast by Product Type, 2018 to 2033

Table 54: BENELUX Market Value (US$ Million) Forecast by Form, 2018 to 2033

Table 55: BENELUX Market Volume (MT) Forecast by Form, 2018 to 2033

Table 56: BENELUX Market Value (US$ Million) Forecast by Sales Channel, 2018 to 2033

Table 57: BENELUX Market Volume (MT) Forecast by Sales Channel, 2018 to 2033

Table 58: Poland Market Value (US$ Million) Forecast by Product Type, 2018 to 2033

Table 59: Poland Market Volume (MT) Forecast by Product Type, 2018 to 2033

Table 60: Poland Market Value (US$ Million) Forecast by Form, 2018 to 2033

Table 61: Poland Market Volume (MT) Forecast by Form, 2018 to 2033

Table 62: Poland Market Value (US$ Million) Forecast by Sales Channel, 2018 to 2033

Table 63: Poland Market Volume (MT) Forecast by Sales Channel, 2018 to 2033

List of Charts

Figure 1: Market Value (US$ Million) by Product Type, 2023 to 2033

Figure 2: Market Value (US$ Million) by Form, 2023 to 2033

Figure 3: Market Value (US$ Million) by Sales Channel, 2023 to 2033

Figure 4: Market Value (US$ Million) by Region, 2023 to 2033

Figure 5: Market Value (US$ Million) Analysis by Region, 2018 to 2033

Figure 6: Market Volume (MT) Analysis by Region, 2018 to 2033

Figure 7: Market Value Share (%) and BPS Analysis by Region, 2023 to 2033

Figure 8: Market Y-o-Y Growth (%) Projections by Region, 2023 to 2033

Figure 9: Market Value (US$ Million) Analysis by Product Type, 2018 to 2033

Figure 10: Market Volume (MT) Analysis by Product Type, 2018 to 2033

Figure 11: Market Value Share (%) and BPS Analysis by Product Type, 2023 to 2033

Figure 12: Market Y-o-Y Growth (%) Projections by Product Type, 2023 to 2033

Figure 13: Market Value (US$ Million) Analysis by Form, 2018 to 2033

Figure 14: Market Volume (MT) Analysis by Form, 2018 to 2033

Figure 15: Market Value Share (%) and BPS Analysis by Form, 2023 to 2033

Figure 16: Market Y-o-Y Growth (%) Projections by Form, 2023 to 2033

Figure 17: Market Value (US$ Million) Analysis by Sales Channel, 2018 to 2033

Figure 18: Market Volume (MT) Analysis by Sales Channel, 2018 to 2033

Figure 19: Market Value Share (%) and BPS Analysis by Sales Channel, 2023 to 2033

Figure 20: Market Y-o-Y Growth (%) Projections by Sales Channel, 2023 to 2033

Figure 21: Market Attractiveness by Product Type, 2023 to 2033

Figure 22: Market Attractiveness by Form, 2023 to 2033

Figure 23: Market Attractiveness by Sales Channel, 2023 to 2033

Figure 24: Market Attractiveness by Region, 2023 to 2033

Figure 25: Germany Market Value (US$ Million) by Product Type, 2023 to 2033

Figure 26: Germany Market Value (US$ Million) by Form, 2023 to 2033

Figure 27: Germany Market Value (US$ Million) by Sales Channel, 2023 to 2033

Figure 28: Germany Market Value (US$ Million) Analysis by Product Type, 2018 to 2033

Figure 29: Germany Market Volume (MT) Analysis by Product Type, 2018 to 2033

Figure 30: Germany Market Value Share (%) and BPS Analysis by Product Type, 2023 to 2033

Figure 31: Germany Market Y-o-Y Growth (%) Projections by Product Type, 2023 to 2033

Figure 32: Germany Market Value (US$ Million) Analysis by Form, 2018 to 2033

Figure 33: Germany Market Volume (MT) Analysis by Form, 2018 to 2033

Figure 34: Germany Market Value Share (%) and BPS Analysis by Form, 2023 to 2033

Figure 35: Germany Market Y-o-Y Growth (%) Projections by Form, 2023 to 2033

Figure 36: Germany Market Value (US$ Million) Analysis by Sales Channel, 2018 to 2033

Figure 37: Germany Market Volume (MT) Analysis by Sales Channel, 2018 to 2033

Figure 38: Germany Market Value Share (%) and BPS Analysis by Sales Channel, 2023 to 2033

Figure 39: Germany Market Y-o-Y Growth (%) Projections by Sales Channel, 2023 to 2033

Figure 40: Germany Market Attractiveness by Product Type, 2023 to 2033

Figure 41: Germany Market Attractiveness by Form, 2023 to 2033

Figure 42: Germany Market Attractiveness by Sales Channel, 2023 to 2033

Figure 43: France Market Value (US$ Million) by Product Type, 2023 to 2033

Figure 44: France Market Value (US$ Million) by Form, 2023 to 2033

Figure 45: France Market Value (US$ Million) by Sales Channel, 2023 to 2033

Figure 46: France Market Value (US$ Million) Analysis by Product Type, 2018 to 2033

Figure 47: France Market Volume (MT) Analysis by Product Type, 2018 to 2033

Figure 48: France Market Value Share (%) and BPS Analysis by Product Type, 2023 to 2033

Figure 49: France Market Y-o-Y Growth (%) Projections by Product Type, 2023 to 2033

Figure 50: France Market Value (US$ Million) Analysis by Form, 2018 to 2033

Figure 51: France Market Volume (MT) Analysis by Form, 2018 to 2033

Figure 52: France Market Value Share (%) and BPS Analysis by Form, 2023 to 2033

Figure 53: France Market Y-o-Y Growth (%) Projections by Form, 2023 to 2033

Figure 54: France Market Value (US$ Million) Analysis by Sales Channel, 2018 to 2033

Figure 55: France Market Volume (MT) Analysis by Sales Channel, 2018 to 2033

Figure 56: France Market Value Share (%) and BPS Analysis by Sales Channel, 2023 to 2033

Figure 57: France Market Y-o-Y Growth (%) Projections by Sales Channel, 2023 to 2033

Figure 58: France Market Attractiveness by Product Type, 2023 to 2033

Figure 59: France Market Attractiveness by Form, 2023 to 2033

Figure 60: France Market Attractiveness by Sales Channel, 2023 to 2033

Figure 61: Italy Market Value (US$ Million) by Product Type, 2023 to 2033

Figure 62: Italy Market Value (US$ Million) by Form, 2023 to 2033

Figure 63: Italy Market Value (US$ Million) by Sales Channel, 2023 to 2033

Figure 64: Italy Market Value (US$ Million) by Country, 2023 to 2033

Figure 65: Italy Market Value (US$ Million) Analysis by Product Type, 2018 to 2033

Figure 66: Italy Market Volume (MT) Analysis by Product Type, 2018 to 2033

Figure 67: Italy Market Value Share (%) and BPS Analysis by Product Type, 2023 to 2033

Figure 68: Italy Market Y-o-Y Growth (%) Projections by Product Type, 2023 to 2033

Figure 69: Italy Market Value (US$ Million) Analysis by Form, 2018 to 2033

Figure 70: Italy Market Volume (MT) Analysis by Form, 2018 to 2033

Figure 71: Italy Market Value Share (%) and BPS Analysis by Form, 2023 to 2033

Figure 72: Italy Market Y-o-Y Growth (%) Projections by Form, 2023 to 2033

Figure 73: Italy Market Value (US$ Million) Analysis by Sales Channel, 2018 to 2033

Figure 74: Italy Market Volume (MT) Analysis by Sales Channel, 2018 to 2033

Figure 75: Italy Market Value Share (%) and BPS Analysis by Sales Channel, 2023 to 2033

Figure 76: Italy Market Y-o-Y Growth (%) Projections by Sales Channel, 2023 to 2033

Figure 77: Italy Market Attractiveness by Product Type, 2023 to 2033

Figure 78: Italy Market Attractiveness by Form, 2023 to 2033

Figure 79: Italy Market Attractiveness by Sales Channel, 2023 to 2033

Figure 80: Spain Market Value (US$ Million) by Product Type, 2023 to 2033

Figure 81: Spain Market Value (US$ Million) by Form, 2023 to 2033

Figure 82: Spain Market Value (US$ Million) Analysis by Product Type, 2018 to 2033

Figure 83: Spain Market Volume (MT) Analysis by Product Type, 2018 to 2033

Figure 84: Spain Market Value Share (%) and BPS Analysis by Product Type, 2023 to 2033

Figure 85: Spain Market Y-o-Y Growth (%) Projections by Product Type, 2023 to 2033

Figure 86: Spain Market Value (US$ Million) Analysis by Form, 2018 to 2033

Figure 87: Spain Market Volume (MT) Analysis by Form, 2018 to 2033

Figure 88: Spain Market Value Share (%) and BPS Analysis by Form, 2023 to 2033

Figure 89: Spain Market Y-o-Y Growth (%) Projections by Form, 2023 to 2033

Figure 90: Spain Market Value (US$ Million) Analysis by Sales Channel, 2018 to 2033

Figure 91: Spain Market Volume (MT) Analysis by Sales Channel, 2018 to 2033

Figure 92: Spain Market Value Share (%) and BPS Analysis by Sales Channel, 2023 to 2033

Figure 93: Spain Market Y-o-Y Growth (%) Projections by Sales Channel, 2023 to 2033

Figure 94: Spain Market Attractiveness by Product Type, 2023 to 2033

Figure 95: Spain Market Attractiveness by Form, 2023 to 2033

Figure 96: Spain Market Attractiveness by Sales Channel, 2023 to 2033

Figure 97: United Kingdom Market Value (US$ Million) by Product Type, 2023 to 2033

Figure 98: United Kingdom Market Value (US$ Million) by Form, 2023 to 2033

Figure 99: United Kingdom Market Value (US$ Million) by Sales Channel, 2023 to 2033

Figure 100: United Kingdom Market Value (US$ Million) Analysis by Product Type, 2018 to 2033

Figure 101: United Kingdom Market Volume (MT) Analysis by Product Type, 2018 to 2033

Figure 102: United Kingdom Market Value Share (%) and BPS Analysis by Product Type, 2023 to 2033

Figure 103: United Kingdom Market Y-o-Y Growth (%) Projections by Product Type, 2023 to 2033

Figure 104: United Kingdom Market Value (US$ Million) Analysis by Form, 2018 to 2033

Figure 105: United Kingdom Market Volume (MT) Analysis by Form, 2018 to 2033

Figure 106: United Kingdom Market Value Share (%) and BPS Analysis by Form, 2023 to 2033

Figure 107: United Kingdom Market Y-o-Y Growth (%) Projections by Form, 2023 to 2033

Figure 108: United Kingdom Market Value (US$ Million) Analysis by Sales Channel, 2018 to 2033

Figure 109: United Kingdom Market Volume (MT) Analysis by Sales Channel, 2018 to 2033

Figure 110: United Kingdom Market Value Share (%) and BPS Analysis by Sales Channel, 2023 to 2033

Figure 111: United Kingdom Market Y-o-Y Growth (%) Projections by Sales Channel, 2023 to 2033

Figure 112: United Kingdom Market Attractiveness by Product Type, 2023 to 2033

Figure 113: United Kingdom Market Attractiveness by Form, 2023 to 2033

Figure 114: United Kingdom Market Attractiveness by Sales Channel, 2023 to 2033

Figure 115: Russia Market Value (US$ Million) by Product Type, 2023 to 2033

Figure 116: Russia Market Value (US$ Million) by Form, 2023 to 2033

Figure 117: Russia Market Value (US$ Million) by Sales Channel, 2023 to 2033

Figure 118: Russia Market Value (US$ Million) Analysis by Product Type, 2018 to 2033

Figure 119: Russia Market Volume (MT) Analysis by Product Type, 2018 to 2033

Figure 120: Russia Market Value Share (%) and BPS Analysis by Product Type, 2023 to 2033

Figure 121: Russia Market Y-o-Y Growth (%) Projections by Product Type, 2023 to 2033

Figure 122: Russia Market Value (US$ Million) Analysis by Form, 2018 to 2033

Figure 123: Russia Market Volume (MT) Analysis by Form, 2018 to 2033

Figure 124: Russia Market Value Share (%) and BPS Analysis by Form, 2023 to 2033

Figure 125: Russia Market Y-o-Y Growth (%) Projections by Form, 2023 to 2033

Figure 126: Russia Market Value (US$ Million) Analysis by Sales Channel, 2018 to 2033

Figure 127: Russia Market Volume (MT) Analysis by Sales Channel, 2018 to 2033

Figure 128: Russia Market Value Share (%) and BPS Analysis by Sales Channel, 2023 to 2033

Figure 129: Russia Market Y-o-Y Growth (%) Projections by Sales Channel, 2023 to 2033

Figure 130: Russia Market Attractiveness by Product Type, 2023 to 2033

Figure 131: Russia Market Attractiveness by Form, 2023 to 2033

Figure 132: Russia Market Attractiveness by Sales Channel, 2023 to 2033

Figure 133: Nordic Market Value (US$ Million) by Product Type, 2023 to 2033

Figure 134: Nordic Market Value (US$ Million) by Form, 2023 to 2033

Figure 135: Nordic Market Value (US$ Million) by Sales Channel, 2023 to 2033

Figure 136: Nordic Market Value (US$ Million) Analysis by Product Type, 2018 to 2033

Figure 137: Nordic Market Volume (MT) Analysis by Product Type, 2018 to 2033

Figure 138: Nordic Market Value Share (%) and BPS Analysis by Product Type, 2023 to 2033

Figure 139: Nordic Market Y-o-Y Growth (%) Projections by Product Type, 2023 to 2033

Figure 140: Nordic Market Value (US$ Million) Analysis by Form, 2018 to 2033

Figure 141: Nordic Market Volume (MT) Analysis by Form, 2018 to 2033

Figure 142: Nordic Market Value Share (%) and BPS Analysis by Form, 2023 to 2033

Figure 143: Nordic Market Y-o-Y Growth (%) Projections by Form, 2023 to 2033

Figure 144: Nordic Market Value (US$ Million) Analysis by Sales Channel, 2018 to 2033

Figure 145: Nordic Market Volume (MT) Analysis by Sales Channel, 2018 to 2033

Figure 146: Nordic Market Value Share (%) and BPS Analysis by Sales Channel, 2023 to 2033

Figure 147: Nordic Market Y-o-Y Growth (%) Projections by Sales Channel, 2023 to 2033

Figure 148: Nordic Market Attractiveness by Product Type, 2023 to 2033

Figure 149: Nordic Market Attractiveness by Form, 2023 to 2033

Figure 150: Nordic Market Attractiveness by Sales Channel, 2023 to 2033

Figure 151: BENELUX Plant-Based Value (US$ Million) by Product Type, 2023 to 2033

Figure 152: BENELUX Market Value (US$ Million) by Form, 2023 to 2033

Figure 153: BENELUX Market Value (US$ Million) by Sales Channel, 2023 to 2033

Figure 154: BENELUX Market Value (US$ Million) by Region, 2023 to 2033

Figure 155: BENELUX Market Value (US$ Million) Analysis by Region, 2018 to 2033

Figure 156: BENELUX Market Volume (MT) Analysis by Region, 2018 to 2033

Figure 157: BENELUX Market Value Share (%) and BPS Analysis by Region, 2023 to 2033

Figure 158: BENELUX Market Y-o-Y Growth (%) Projections by Region, 2023 to 2033

Figure 159: BENELUX Market Value (US$ Million) Analysis by Product Type, 2018 to 2033

Figure 160: BENELUX Market Volume (MT) Analysis by Product Type, 2018 to 2033

Figure 161: BENELUX Market Value Share (%) and BPS Analysis by Product Type, 2023 to 2033

Figure 162: BENELUX Market Y-o-Y Growth (%) Projections by Product Type, 2023 to 2033

Figure 163: BENELUX Market Value (US$ Million) Analysis by Form, 2018 to 2033

Figure 164: BENELUX Market Volume (MT) Analysis by Form, 2018 to 2033

Figure 165: BENELUX Market Value Share (%) and BPS Analysis by Form, 2023 to 2033

Figure 166: BENELUX Market Y-o-Y Growth (%) Projections by Form, 2023 to 2033

Figure 167: BENELUX Market Value (US$ Million) Analysis by Sales Channel, 2018 to 2033

Figure 168: BENELUX Market Volume (MT) Analysis by Sales Channel, 2018 to 2033

Figure 169: BENELUX Market Value Share (%) and BPS Analysis by Sales Channel, 2023 to 2033

Figure 170: BENELUX Market Y-o-Y Growth (%) Projections by Sales Channel, 2023 to 2033

Figure 171: BENELUX Market Attractiveness by Product Type, 2023 to 2033

Figure 172: BENELUX Market Attractiveness by Form, 2023 to 2033

Figure 173: BENELUX Market Attractiveness by Sales Channel, 2023 to 2033

Figure 174: Poland Market Value (US$ Million) by Product Type, 2023 to 2033

Figure 175: Poland Market Value (US$ Million) by Form, 2023 to 2033

Figure 176: Poland Market Value (US$ Million) by Sales Channel, 2023 to 2033

Figure 177: Poland Market Value (US$ Million) by Region, 2023 to 2033

Figure 178: Poland Market Value (US$ Million) Analysis by Region, 2018 to 2033

Figure 179: Poland Market Volume (MT) Analysis by Region, 2018 to 2033

Figure 180: Poland Market Value Share (%) and BPS Analysis by Region, 2023 to 2033

Figure 181: Poland Market Y-o-Y Growth (%) Projections by Region, 2023 to 2033

Figure 182: Poland Market Value (US$ Million) Analysis by Product Type, 2018 to 2033

Figure 183: Poland Market Volume (MT) Analysis by Product Type, 2018 to 2033

Figure 184: Poland Market Value Share (%) and BPS Analysis by Product Type, 2023 to 2033

Figure 185: Poland Market Y-o-Y Growth (%) Projections by Product Type, 2023 to 2033

Figure 186: Poland Market Value (US$ Million) Analysis by Form, 2018 to 2033

Figure 187: Poland Market Volume (MT) Analysis by Form, 2018 to 2033

Figure 188: Poland Market Value Share (%) and BPS Analysis by Form, 2023 to 2033

Figure 189: Poland Market Y-o-Y Growth (%) Projections by Form, 2023 to 2033

Figure 190: Poland Market Value (US$ Million) Analysis by Sales Channel, 2018 to 2033

Figure 191: Poland Market Volume (MT) Analysis by Sales Channel, 2018 to 2033

Figure 192: Poland Market Value Share (%) and BPS Analysis by Sales Channel, 2023 to 2033

Figure 193: Poland Market Y-o-Y Growth (%) Projections by Sales Channel, 2023 to 2033

Figure 194: Poland Market Attractiveness by Product Type, 2023 to 2033

Figure 195: Poland Market Attractiveness by Form, 2023 to 2033

Figure 196: Poland Market Attractiveness by Sales Channel, 2023 to 2033

Figure 197: Poland Market Attractiveness by Region, 2023 to 2033

Recommendations

Food and Beverage

Plant Based Beverage Market

Published : March 2024

Food and Beverage

Plant-based Milk Market

Published : February 2023

Food and Beverage

Meat Substitutes Market

Published : January 2023

Food and Beverage

Plant-Based Beef Market

Published : December 2022

Explore Food and Beverage Insights

View Reports

Europe Plant-Based Meal Kit Market