Reports

- Global Locations -

Headquarters

Future Market Insights, Inc.

Christiana Corporate, 200
Continental Drive, Suite 401,
Newark, Delaware - 19713,
United States

T: +1-845-579-5705

Americas

Future Market Insights, Inc.

616 Corporate Way, Suite 2-9018,
Valley Cottage, NY 10989, United States

T: +1-347-918-3531

MEA

Future Market Insights

1602-6 Jumeirah Bay X2 Tower, Plot No: JLT-PH2-X2A,
Jumeirah Lakes Towers, Dubai,
United Arab Emirates

Europe

Future Market Insights

3rd Floor, 207 Regent Street,
W1B 3HH London
United Kingdom

T: + 44 (0) 20 8123 9659
D: +44 (0) 20 3287 4268

Asia Pacific

Future Market Insights

IndiaLand Global Tech Park, Unit UG-1, Behind Grand HighStreet, Phase 1, Hinjawadi, MH, Pune – 411057, India

Europe Industrial Lubricants Market Outlook (2023 to 2033)

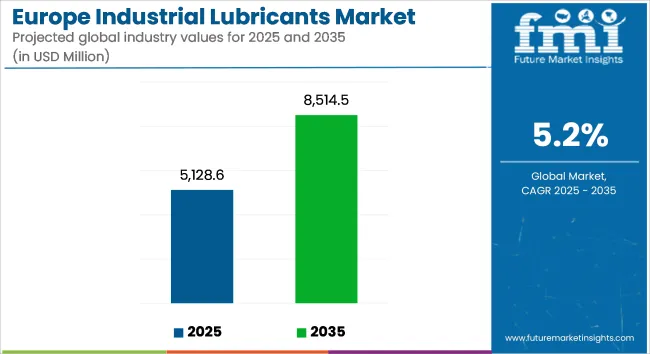
Europe industrial lubricants market size was estimated to be valued at US$ 4,414.9 million in 2022. The market is expected to reach US$ 4,634.2 million by 2023, which is further set to expand at a CAGR of 5.2% from 2023 to 2033.

It is predicted to reach US$ 7,710.3 million by the end of 2033. Growing demand for automobiles across Europe has led to a surging demand for lubricants. Manufacturers are targeting the automotive sector by offering lubricants that meet specific requirements of different vehicle types, including passenger cars, commercial vehicles, and off-road vehicles.

There is a growing trend toward the use of bio-based lubricants, which are made from renewable resources such as vegetable oils and animal fats. These lubricants are eco-friendly and biodegradable. These are hence mainly preferred in environmentally sensitive sectors such as food processing and pharmaceutical manufacturing.

Demand for industrial lubricants in Europe is on the rise due to increasing industrial activities across various sectors. As the economy grows and manufacturing sectors expand, there is a greater need for lubricants to ensure the smooth functioning of machinery and equipment.

Sectors such as automotive, aerospace, construction, and manufacturing heavily rely on lubricants to reduce friction. These would also help to prevent wear and tear, as well as enhance the performance and efficiency of their operations.

Europe has been placing a strong emphasis on sustainability and energy efficiency in recent years. Industrial lubricants play a crucial role in achieving these goals by reducing energy consumption and minimizing waste.

Manufacturers are increasingly adopting advanced lubricants that offer improved performance, longer equipment life, and reduced environmental impact. With stricter regulations and a growing focus on sustainable practices, demand for environmentally friendly lubricants has surged in Europe.

Sectors in Europe recognize the importance of proper maintenance and equipment optimization to maximize productivity & minimize downtime. Lubricants are vital in ensuring the smooth operation and longevity of machinery.

Regular lubrication helps prevent equipment failures, reduces maintenance costs, and extends the lifespan of industrial assets. As a result, businesses in Europe are investing in high-quality lubricants to optimize their equipment performance and minimize disruptions to their operations.

Development of new technologies and innovative lubricant formulations has also contributed to rising demand for industrial lubricants in Europe. Manufacturers are constantly seeking lubricants that can withstand higher temperatures, offer better corrosion resistance, and provide enhanced performance under challenging operating conditions.

Introduction of synthetic lubricants, bio-based lubricants, and specialty lubricants has opened up new possibilities for industrial applications. It is hence set to lead to an increased demand for these advanced lubricant solutions in Europe.

Attribute Key Insights
Europe Industrial Lubricants Market Estimated Size (2023E) US$ 4,634.2 million
Projected Market Valuation (2033F) US$ 7,710.3 million
Value-based CAGR (2023 to 2033) 5.2%
Collective Value Share: Top 3 Countries (2023E) 45.7%

Don't pay for what you don't need

Customize your report by selecting specific countries or regions and save 30%!

A few trends augmenting industrial lubricant sales in Europe are

  • Growing demand for electric and hybrid vehicles, which require specialized lubricants, is set to drive sales.
  • Implementation of industry 4.0 and automation is likely to propel the need for lubricants in advanced machinery and robotics.
  • Surging demand from food processing and packaging sectors, which heavily rely on lubricants for conveyor systems and machinery would support sales.
  • Expansion of the renewable energy sector, particularly wind and solar power, requiring lubricants for maintenance and operation of equipment is anticipated to accelerate demand.
  • Increasing investments in infrastructure and construction projects across Europe is estimated to augur well for the market.

2018 to 2022 Industrial Lubricant Sales Outlook in Europe Compared to Demand Forecast from 2023 to 2033

The Europe industrial lubricants industry witnessed a CAGR of 1.9% over the historical period from 2018 to 2022. In the forecast period from 2023 to 2033, the market is expected to elevate with a significant CAGR of 5.2%.

Europe has witnessed significant industrial expansion in the past, with various sectors experiencing growth and increased production. This expansion resulted in a higher demand for industrial lubricants to maintain and lubricate the growing number of machines and equipment used in sectors such as manufacturing, automotive, and aerospace.

Advancements in technology have led to the development of more sophisticated machinery and equipment in Europe. These advanced systems often require specialized lubricants to operate efficiently and maintain optimal performance. Demand for industrial lubricants increased as numerous companies adopted newer technologies and equipment.

Over time, sectors in Europe recognized the importance of effective maintenance practices in optimizing equipment performance and reducing downtime. Regular lubrication is a fundamental aspect of maintenance to prevent wear & tear, reduce friction, and prolong equipment life. Hence, increased emphasis on maintenance has driven demand for industrial lubricants.

Nikhil Kaitwade
Nikhil Kaitwade

Principal Consultant

Talk to Analyst

Find your sweet spots for generating winning opportunities in this market.

Is the Automotive Sector in Europe Flourishing Industrial Lubricant Sales?

Growing demand for automobiles has a direct impact on the need for lubricants, which play a vital role in manufacturing and maintenance of vehicles. These are essential for reducing friction & wear between moving parts, preventing corrosion, and enhancing efficiency & performance.

Throughout the automotive manufacturing process, industrial lubricants are required at various stages, ranging from the production of engine components to assembly of final vehicles. A few are crucial for vehicle maintenance and repairs, ensuring smooth and efficient operation. The automotive sector imposes rigorous requirements in terms of performance and durability.

With development of advanced engines, transmissions, and mechanical systems in modern vehicles, lubricants must withstand high temperatures, pressures, and loads. Specialized industrial lubricants have been formulated to cater to specific needs of the automotive sector.

Increasing demand for automobiles serves as a primary driver for the market. This demand is expected to continue its upward trajectory as the automotive sector grows and undergoes further advancements.

How is the Europe Food Processing Sector Accelerating Demand for Industrial Lubricants?

Industrial lubricants are critical in the food processing business. These are needed for maintaining optimal equipment efficiency, lowering energy consumption, and increasing the lifespan of gear.

Lubricants that are safe for human consumption, non-toxic, and meet severe criteria are required in the food processing sector. These lubricants must remain effective to prevent wear & tear and reduce the danger of failures & production downtime.

The Europe food processing sector contributes significantly to the economy and accounts for a sizable portion of the industrial lubricant market. As the food sector evolves, there is an increasing demand for high-performance lubricants that can resist harsh operating conditions of food processing equipment.

High-quality lubricants might contribute to improved efficiency of machinery and equipment, resulting in reduced energy consumption and lower emissions. Sectors such as transportation and manufacturing rely heavily on machinery and equipment. These might stand to benefit from this efficiency enhancement.

Another crucial aspect is enhancement of worker health and safety through the use of high-quality lubricants. Certain lubricants contain toxic chemicals that pose risks to human health.

By transitioning to eco-friendlier lubricants, companies can mitigate these risks and prioritize the well-being of their workers. Environmental regulations are propelling adoption of high-quality lubricants that are eco-friendly.

Stringent regulations would soon encourage companies to minimize emissions, enhance efficiency, and protect worker health & safety. These would also help to bolster their reputation as environmentally responsible entities.

Get the data you need at a Fraction of the cost

Personalize your report by choosing insights you need
and save 40%!

Which Factors Might Hinder Industrial Lubricant Sales Worldwide?

Lubricants are typically derived from crude oil and its by-products. When the price of crude oil rises, it can increase the cost of producing lubricants. It can further lead to higher prices. This, in turn, might lead to reduced demand for lubricants and a slowdown in the market.

Volatility of oil prices can affect the overall economic conditions in the region, which can impact demands in the market. For instance, during periods of high oil prices, businesses might face higher operating costs.

It can lead to decreased spending on maintenance and equipment. This can result in lower demand for industrial lubricants, as businesses might defer maintenance or reduce usage to conserve costs.

High oil prices can lead to inflationary pressures, which can affect the purchasing power of consumers and businesses alike. This can further reduce demand for industrial lubricants, as businesses might prioritize other expenses over lubricants.

Volatility of oil prices can create uncertainty in the Europe industrial lubricants market, making it difficult for businesses to plan and invest in the sector. Owing to this, companies operating in this market must carefully monitor oil prices and adjust their strategies accordingly to maintain profitability & competitiveness.

Country-wise Insights

Would Russia be a Significant Hub for Industrial Lubricant Manufacturers?

Demand for Industrial Lubricant Sprays to Expand in Russia with Presence of Various Firms

Russia industrial lubricants market is an important sector within the country's manufacturing space, i.e. oil & gas. In terms of market size, Russia is set to be the second-largest country in Europe.

The country has a well-developed manufacturing sector. It also houses a well-established oil & gas sector. It has a strong focus on research and development, which has helped to drive innovation in the industrial lubricants sector.

Few of the renowned companies operating in Russia include Gazprom Neft, LUKOIL, Rosneft, Fuchs Petrolub SE, and TotalEnergies. In the country, production of engine oils, hydraulic oils, industrial greases, and gear oils is expected to skyrocket by 2033. The market is likely to represent a total incremental $ opportunity of US$ 519.5 million between 2023 and 2033.

Why is Industrial Lubricant Demand Surging Astonishingly in Germany?

Increasing Environmental Norms in Germany to Spur Sales of Industrial Silicone Grease

Demand for industrial lubricants in Germany is influenced by numerous factors such as growth of end use sector, as well as stringent government policies. Germany is one of the largest industrial lubricants markets in Europe. The country is expected to expand at a CAGR of 5.8% during the forecast period.

Germany is known for its export-oriented economy, with a significant portion of its industrial output being exported worldwide. To maintain competitiveness in the global market, Germany-based sectors might prioritize high-quality lubricants to ensure the reliability and performance of their products. Export-oriented nature of the economy has contributed to surging demand for industrial lubricants in Germany.

Germany also has a strong commitment to sustainability and environmental protection. The country has implemented stringent regulations and standards for reducing emissions and promoting eco-friendly practices.

Industrial lubricants play a crucial role in meeting these requirements by minimizing friction, improving energy efficiency, and reducing environmental impact. Rising emphasis on sustainability would contribute to surging demand for environmentally friendly lubricants in Germany.

Category-wise Insights

Which is the Highly Preferred Type of Industrial Fluid in Europe?

Demand for Hydraulic Oils to Expand amid Rising Use in Automotive Brakes

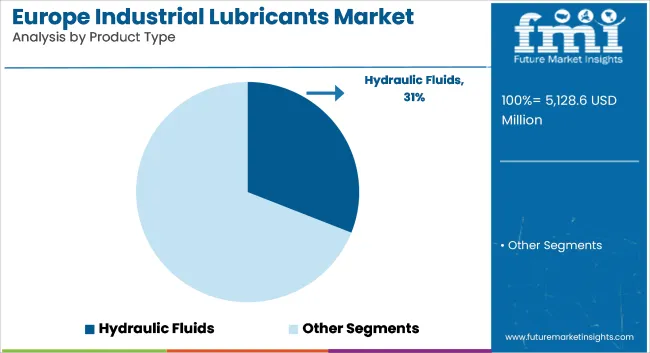
In terms of product type, the hydraulic fluids segment is estimated to remain at the forefront through 2033. Ability of these fluids to transmit power in hydraulic systems is set to push their demand. These are expected to be demanded from heavy machinery, automotive brakes, and aircraft systems manufacturers in Europe.

Hydraulic fluids are used as they have unique properties that make them ideal for these applications. Their ability to transfer energy, lubricate moving parts, and protect against corrosion would help support sales.

It is set to be a key fluid used in manufacturing technologies across Europe. Its usage might lead to the production of high-performance lubricants that are capable of operating in extreme conditions such as high temperatures and pressures.

Increasing demand for hydraulic systems in various sectors is predicted to accelerate the segment. Demand for advanced hydraulic fluids such as synthetic and high-performance fluids is also expected to surge.

Companies in Europe would require significant investments in construction and transportation infrastructure, which will drive demand for hydraulic fluids. Growing industrial and infrastructure sectors in the region is set to offer lucrative growth opportunities for hydraulic fluid manufacturers.

Which Base Oil is Set to be Extensively Consumed in Europe?

Sales of Mineral Oil-based Waterproof Marine Grease to Elevate in Europe

Mineral oil-based lubricants are versatile and can be formulated to meet a wide range of industrial lubrication needs. They are likely to be used in several applications across sectors such as manufacturing, automotive, mining, construction, and transportation. Versatility of mineral oil-based lubricants makes them suitable for different types of machinery and equipment, leading to a consistent demand.

Mineral oil is readily available as a natural resource in Europe, which ensures a stable supply for lubricant manufacturers. Wide availability of mineral oil enables the production of large volumes of lubricants to meet the demand from various sectors. Easy availability contributes to rising popularity and widespread use of mineral oil-based lubricants.

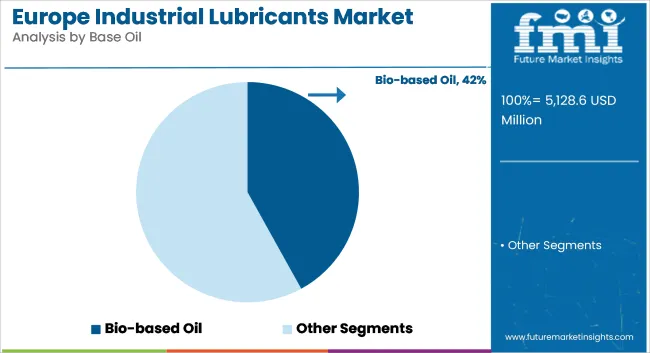
While mineral oil-based lubricants have a few advantages, there is an increasing trend toward the use of synthetic lubricants and bio-based lubricants. It is mainly due to their enhanced performance characteristics and environmental benefits.

Market dynamics and demand for mineral oil-based lubricants might evolve as companies and regulations prioritize sustainability and seek alternative lubricant solutions. Hence, mineral oil is anticipated to register a CAGR of 4.8% in Europe industrial lubricants market during the forecast period.

Competitive Landscape

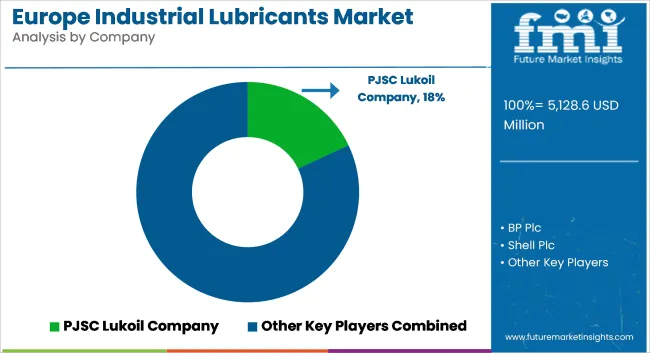
Europe industrial lubricants market is a fairly fragmented sector with a certain number of companies heavily active in the region. Key market participants currently contribute to more than 50% of the Europe industrial lubricants market share. The market has presence of various small- and medium-sized businesses that are providing competition to tier-1 organizations.

Advancements in technology are expected to drive growth in the Europe market. New and more efficient methods for manufacturing are being developed, which are expected to increase productivity and reduce costs. This is further estimated to make manufacturing more competitive and attractive to investors.

For instance:

  • In January 2022, the TEKMA series of heavy-duty lubricants for diesel engines was introduced by Motul, a France-based oil firm with roots dating back to 1853. These engine oils were created specifically to perform under the most difficult circumstances. The manufacturer claims that TEKMA engine oils can provide increased drain intervals, optimal engine protection, and greater fuel economy & power.

Scope of the Report

Attribute Details
Estimated Market Size (2023) US$ 4,634.2 million
Projected Market Valuation (2033) US$ 7,710.3 million
Value-based CAGR (2023 to 2033) 5.2%
Forecast Period 2023 to 2033
Historical Data Available for 2018 to 2022
Industry Analysis Value (US$ million) and Volume (kilo tons)
Key Countries Covered Germany, Italy, France, United Kingdom, Spain, BENELUX, Rest of Europe
Key Segments Covered By Product Type, By Base Oil, By End Use, and By Region
Key Companies Profiled
  • PJSC Lukoil
  • PJSC Rosneft Oil
  • Eni SpA
  • Motul S.A.
  • Carl Bechem Lubricants
  • PJSC Gazprom
  • Fuchs Petrolub SE
  • TotalEnergies SE
  • Repsol SA
  • Valvoline, Inc.
  • Shell plc.
  • Nynas AB
  • BP plc
  • ExxonMobil Corporation
  • Klüber Lubrication
  • LIQUI MOLY
Report Coverage Market Forecast, Company Share Analysis, Competition Intelligence, Drivers, Restraints, Opportunities and Trends Analysis, Market Dynamics and Challenges, and Strategic Growth Initiatives

Europe Industrial Lubricants Market Outlook by Category

By Product Type:

  • Hydraulic Fluids
  • Metal Working Fluids
  • Gear Oil
  • Compressor Oil
  • Grease
  • Turbine Oil
  • Transformer Oil
  • Refrigeration Oil
  • Textile Machinery Lubricants
  • Others

By Base Oil:

  • Mineral Oil
  • Synthetic Oil
  • Bio-based Oil

By End Use:

  • Construction
  • Metal and Mining
  • Cement Production
  • Power Generation
  • Automotive
  • Chemical Production
  • Oil and Gas
  • Textile Manufacturing
  • Food Processing
  • Agriculture
  • Pulp and Paper
  • Marine Applications
  • Other

By Country:

  • Germany
  • Italy
  • France
  • United Kingdom
  • Spain
  • BENELUX
  • Rest of Europe

Frequently Asked Questions

What is the Europe Industrial Lubricants market CAGR for 2033?

The Europe Industrial Lubricants market CAGR for 2033 is 5.2%.

How Big Will the Europe Industrial Lubricants Market by 2033?

The market is estimated to reach US$ 7,710.3 million by 2033.

Which are the Top Three Countries Leading the Market?

North America, Europe, and Asia-Pacific are the top 3 countries leading the market.

What is Current Market Valuation?

The market is estimated to secure a valuation of US$ 4,634.2 million in 2023.

Which are the Key Asian Countries in the Europe Industrial Lubricants Market?

India, Japan, and China dominate the Asian market.

Table of Content

1. Executive Summary

    1.1. Market Outlook

    1.2. Demand Side Trends

    1.3. Supply Side Trends

    1.4. Technology Roadmap

    1.5. Analysis and Recommendations

2. Market Overview

    2.1. Market Coverage / Taxonomy

    2.2. Market Definition / Scope / Limitations

3. Key Market Trends

    3.1. Key Trends Impacting the Market

    3.2. Product Innovation / Development Trends

4. Key Success Factors

    4.1. Product Adoption / Usage Analysis

    4.2. Product USPs / Features

    4.3. Strategic Promotional Strategies

5. Europe Market Demand Analysis 2018 to 2022 and Forecast, 2023 to 2033

    5.1. Historical Market Volume (kilo tons) Analysis, 2018 to 2022

    5.2. Current and Future Market Volume (kilo tons) Projections, 2023 to 2033

    5.3. Y-o-Y Growth Trend Analysis

6. Europe Market - Pricing Analysis

    6.1. Country-Level Pricing Analysis

    6.2. Cost Teardown Analysis

    6.3. Pricing Impact Factors

    6.4. Europe Average Pricing Analysis Benchmark

7. Europe Market Demand (in Value or Size in US$ million) Analysis 2018 to 2022 and Forecast, 2023 to 2033

    7.1. Historical Market Value (US$ million) Analysis, 2018 to 2022

    7.2. Current and Future Market Value (US$ million) Projections, 2023 to 2033

        7.2.1. Y-o-Y Growth Trend Analysis

        7.2.2. Absolute $ Opportunity Analysis

8. Market Background

    8.1. Macro-Economic Factors

        8.1.1. GDP Growth Outlook

        8.1.2. Pharmaceutical Industry Outlook

        8.1.3. Construction Industry Overview

        8.1.4. Chemical Production Outlook

        8.1.5. Agriculture Industry Overview

        8.1.6. Paper and Pulp Industry Overview

        8.1.7. Parent Market Overview

        8.1.8. Other Macro-Economic Factors

    8.2. Forecast Factors - Relevance & Impact

        8.2.1. Historic Growth Rate of Companies

        8.2.2. GDP Growth Forecast

        8.2.3. Chemical Industry Growth Outlook

        8.2.4. Government Policies and Spending

        8.2.5. Manufacturing Industry Forecast

        8.2.6. Impact of Regulations

        8.2.7. Other Forecast Factors

    8.3. Value Chain Analysis

        8.3.1. List of Raw Material Suppliers

        8.3.2. List of Product Manufacturers

        8.3.3. List of End Users

        8.3.4. Trade Margins/Profit Margins

    8.4. COVID-19 Crisis - Impact Assessment

        8.4.1. Current Statistics

        8.4.2. Short-Mid-Long Term Outlook

        8.4.3. Likely Rebound

    8.5. Market Dynamics

        8.5.1. Drivers

        8.5.2. Restraints

        8.5.3. Opportunity Analysis

    8.6. Supply Demand Analysis

    8.7. Porter’s Five Forces Analysis

    8.8. PEST Analysis

    8.9. Key Regulations and Certifications

9. Europe Market Analysis 2018 to 2022 and Forecast 2023 to 2033, By Base Oil

    9.1. Introduction / Key Findings

    9.2. Historical Market Size (US$ million) and Volume Analysis By Base Oil, 2018 to 2022

    9.3. Current and Future Market Size (US$ million) and Volume Analysis and Forecast By Base Oil, 2023 to 2033

        9.3.1. Mineral Oil

        9.3.2. Synthetic Oil

        9.3.3. Bio-based Oil

    9.4. Market Attractiveness Analysis By Base Oil

10. Europe Market Analysis 2018 to 2022 and Forecast 2023 to 2033, By Product Type

    10.1. Introduction / Key Findings

    10.2. Historical Market Size (US$ million) and Volume Analysis By Product Type, 2018 to 2022

    10.3. Current and Future Market Size (US$ million) and Volume Analysis and Forecast By Product Type, 2023 to 2033

        10.3.1. Hydraulic Fluids

        10.3.2. Metalworking Fluids

        10.3.3. Gear Oil

        10.3.4. Compressor Oil

        10.3.5. Grease

        10.3.6. Turbine Oil

        10.3.7. Transformer Oil

        10.3.8. Refrigeration Oil

        10.3.9. Textile Machinery Lubricants

        10.3.10. Others

    10.4. Market Attractiveness Analysis By Product Type

11. Europe Market Analysis 2018 to 2022 and Forecast 2023 to 2033, By End Use

    11.1. Introduction / Key Findings

    11.2. Historical Market Size (US$ million) and Volume Analysis By End Use, 2018 to 2022

    11.3. Current and Future Market Size (US$ million) and Volume Analysis and Forecast By End Use, 2023 to 2033

        11.3.1. Construction

        11.3.2. Metal & Mining

        11.3.3. Cement Production

        11.3.4. Power Generation

        11.3.5. Automotive

        11.3.6. Chemical Production

        11.3.7. Oil & Gas

        11.3.8. Textile Manufacturing

        11.3.9. Food Processing

        11.3.10. Agriculture

        11.3.11. Pulp & Paper

        11.3.12. Marine Applications

        11.3.13. Others

    11.4. Market Attractiveness Analysis By End Use

12. Europe Market Analysis 2018 to 2022 and Forecast 2023 to 2033, by Country

    12.1. Introduction

    12.2. Historical Market Size (US$ million) and Volume Analysis By Country, 2018 to 2022

    12.3. Current Market Size (US$ million) and Volume Analysis and Forecast By Country, 2023 to 2033

        12.3.1. Germany

        12.3.2. Italy

        12.3.3. France

        12.3.4. United Kingdom

        12.3.5. Spain

        12.3.6. Russia

        12.3.7. BENELUX

        12.3.8. Rest of Europe

    12.4. Market Attractiveness Analysis By Country

13. Germany Market Analysis 2018 to 2022 and Forecast 2023 to 2033

    13.1. Introduction

    13.2. Pricing Analysis

    13.3. Historical Market Size (US$ million) and Volume Trend Analysis By Market Taxonomy, 2018 to 2022

    13.4. Market Size (US$ million) and Volume Forecast By Market Taxonomy, 2023 to 2033

        13.4.1. By Base Oil

        13.4.2. By Product Type

        13.4.3. By End Use

    13.5. Market Attractiveness Analysis

        13.5.1. By Base Oil

        13.5.2. By Product Type

        13.5.3. By End Use

    13.6. Market Trends

    13.7. Key Market Participants - Intensity Mapping

    13.8. Drivers and Restraints - Impact Analysis

14. Italy Market Analysis 2018 to 2022 and Forecast 2023 to 2033

    14.1. Introduction

    14.2. Pricing Analysis

    14.3. Historical Market Size (US$ million) and Volume Trend Analysis By Market Taxonomy, 2018 to 2022

    14.4. Market Size (US$ million) and Volume Forecast By Market Taxonomy, 2023 to 2033

        14.4.1. By Base Oil

        14.4.2. By Product Type

        14.4.3. By End Use

    14.5. Market Attractiveness Analysis

        14.5.1. By Base Oil

        14.5.2. By Product Type

        14.5.3. By End Use

    14.6. Market Trends

    14.7. Key Market Participants - Intensity Mapping

    14.8. Drivers and Restraints - Impact Analysis

15. France Market Analysis 2018 to 2022 and Forecast 2023 to 2033

    15.1. Introduction

    15.2. Pricing Analysis

    15.3. Historical Market Size (US$ million) and Volume Trend Analysis By Market Taxonomy, 2018 to 2022

    15.4. Market Size (US$ million) and Volume Forecast By Market Taxonomy, 2023 to 2033

        15.4.1. By Base Oil

        15.4.2. By Product Type

        15.4.3. By End Use

        15.4.4. By End Use Industry

    15.5. Market Attractiveness Analysis

        15.5.1. By Base Oil

        15.5.2. By Product Type

        15.5.3. By End Use

    15.6. Market Trends

    15.7. Key Market Participants - Intensity Mapping

    15.8. Drivers and Restraints - Impact Analysis

16. United Kingdom Market Analysis 2018 to 2022 and Forecast 2023 to 2033

    16.1. Introduction

    16.2. Pricing Analysis

    16.3. Historical Market Size (US$ million) and Volume Trend Analysis By Market Taxonomy, 2018 to 2022

    16.4. Market Size (US$ million) and Volume Forecast By Market Taxonomy, 2023 to 2033

        16.4.1. By Base Oil

        16.4.2. By Product Type

        16.4.3. By End Use

    16.5. Market Attractiveness Analysis

        16.5.1. By Base Oil

        16.5.2. By Product Type

        16.5.3. By End Use

    16.6. Market Trends

    16.7. Key Market Participants - Intensity Mapping

    16.8. Drivers and Restraints - Impact Analysis

17. Spain Market Analysis 2018 to 2022 and Forecast 2023 to 2033

    17.1. Introduction

    17.2. Pricing Analysis

    17.3. Historical Market Size (US$ million) and Volume Trend Analysis By Market Taxonomy, 2018 to 2022

    17.4. Market Size (US$ million) and Volume Forecast By Market Taxonomy, 2023 to 2033

        17.4.1. By Base Oil

        17.4.2. By Product Type

        17.4.3. By End Use

    17.5. Market Attractiveness Analysis

        17.5.1. By Base Oil

        17.5.2. By Product Type

        17.5.3. By End Use

    17.6. Market Trends

    17.7. Key Market Participants - Intensity Mapping

    17.8. Drivers and Restraints - Impact Analysis

18. Russia Market Analysis 2018 to 2022 and Forecast 2023 to 2033

    18.1. Introduction

    18.2. Pricing Analysis

    18.3. Historical Market Size (US$ million) and Volume Trend Analysis By Market Taxonomy, 2018 to 2022

    18.4. Market Size (US$ million) and Volume Forecast By Market Taxonomy, 2023 to 2033

        18.4.1. By Base Oil

        18.4.2. By Product Type

        18.4.3. By End Use

        18.4.4. By End Use Industry

    18.5. Market Attractiveness Analysis

        18.5.1. By Base Oil

        18.5.2. By Product Type

        18.5.3. By End Use

    18.6. Market Trends

    18.7. Key Market Participants - Intensity Mapping

    18.8. Drivers and Restraints - Impact Analysis

19. BENELUX Market Analysis 2018 to 2022 and Forecast 2023 to 2033

    19.1. Introduction

    19.2. Pricing Analysis

    19.3. Historical Market Size (US$ million) and Volume Trend Analysis By Market Taxonomy, 2018 to 2022

    19.4. Market Size (US$ million) and Volume Forecast By Market Taxonomy, 2023 to 2033

        19.4.1. By Base Oil

        19.4.2. By Product Type

        19.4.3. By End Use

    19.5. Market Attractiveness Analysis

        19.5.1. By Base Oil

        19.5.2. By Product Type

        19.5.3. By End Use

    19.6. Market Trends

    19.7. Key Market Participants - Intensity Mapping

    19.8. Drivers and Restraints - Impact Analysis

20. Rest of Europe Market Analysis 2018 to 2022 and Forecast 2023 to 2033

    20.1. Introduction

    20.2. Pricing Analysis

    20.3. Historical Market Size (US$ million) and Volume Trend Analysis By Market Taxonomy, 2018 to 2022

    20.4. Market Size (US$ million) and Volume Forecast By Market Taxonomy, 2023 to 2033

        20.4.1. By Base Oil

        20.4.2. By Product Type

        20.4.3. By End Use

    20.5. Market Attractiveness Analysis

        20.5.1. By Base Oil

        20.5.2. By Product Type

        20.5.3. By End Use

        20.5.4. By End Use Industry

    20.6. Market Trends

    20.7. Key Market Participants - Intensity Mapping

    20.8. Drivers and Restraints - Impact Analysis

21. Market Structure Analysis

    21.1. Market Analysis by Tier of Companies Market Concentration

    21.2. Market Share Analysis of Top Players

    21.3. Production Capacity Analysis

    21.4. Market Presence Analysis

22. Competition Analysis

    22.1. Competition Dashboard

    22.2. Competition Benchmarking

    22.3. Competition Deep Dive

        22.3.1. PJSC Lukoil Company

            22.3.1.1. Overview

            22.3.1.2. Product Portfolio

            22.3.1.3. Sales Footprint

            22.3.1.4. Strategy Overview

                22.3.1.4.1. Marketing Strategy

                22.3.1.4.2. Product Strategy

                22.3.1.4.3. Channel Strategy

        22.3.2. BP Plc

            22.3.2.1. Overview

            22.3.2.2. Product Portfolio

            22.3.2.3. Sales Footprint

            22.3.2.4. Strategy Overview

                22.3.2.4.1. Marketing Strategy

                22.3.2.4.2. Product Strategy

                22.3.2.4.3. Channel Strategy

        22.3.3. Shell Plc.

            22.3.3.1. Overview

            22.3.3.2. Product Portfolio

            22.3.3.3. Sales Footprint

            22.3.3.4. Strategy Overview

                22.3.3.4.1. Marketing Strategy

                22.3.3.4.2. Product Strategy

                22.3.3.4.3. Channel Strategy

        22.3.4. Total SA

            22.3.4.1. Overview

            22.3.4.2. Product Portfolio

            22.3.4.3. Sales Footprint

            22.3.4.4. Strategy Overview

                22.3.4.4.1. Marketing Strategy

                22.3.4.4.2. Product Strategy

                22.3.4.4.3. Channel Strategy

        22.3.5. Fuchs Petrolub SE

            22.3.5.1. Overview

            22.3.5.2. Product Portfolio

            22.3.5.3. Sales Footprint

            22.3.5.4. Strategy Overview

                22.3.5.4.1. Marketing Strategy

                22.3.5.4.2. Product Strategy

                22.3.5.4.3. Channel Strategy

        22.3.6. PJSC Lukoil Company

            22.3.6.1. Overview

            22.3.6.2. Product Portfolio

            22.3.6.3. Sales Footprint

            22.3.6.4. Strategy Overview

                22.3.6.4.1. Marketing Strategy

                22.3.6.4.2. Product Strategy

                22.3.6.4.3. Channel Strategy

        22.3.7. Repsol SA

            22.3.7.1. Overview

            22.3.7.2. Product Portfolio

            22.3.7.3. Sales Footprint

            22.3.7.4. Strategy Overview

                22.3.7.4.1. Marketing Strategy

                22.3.7.4.2. Product Strategy

                22.3.7.4.3. Channel Strategy

        22.3.8. PJSC Gazprom

            22.3.8.1. Overview

            22.3.8.2. Product Portfolio

            22.3.8.3. Sales Footprint

            22.3.8.4. Strategy Overview

                22.3.8.4.1. Marketing Strategy

                22.3.8.4.2. Product Strategy

                22.3.8.4.3. Channel Strategy

        22.3.9. Eni SpA

            22.3.9.1. Overview

            22.3.9.2. Product Portfolio

            22.3.9.3. Sales Footprint

            22.3.9.4. Strategy Overview

                22.3.9.4.1. Marketing Strategy

                22.3.9.4.2. Product Strategy

                22.3.9.4.3. Channel Strategy

        22.3.10. ExxonMobil Corporation

            22.3.10.1. Overview

            22.3.10.2. Product Portfolio

            22.3.10.3. Sales Footprint

            22.3.10.4. Strategy Overview

                22.3.10.4.1. Marketing Strategy

                22.3.10.4.2. Product Strategy

                22.3.10.4.3. Channel Strategy

        22.3.11. Nynas AB

            22.3.11.1. Overview

            22.3.11.2. Product Portfolio

            22.3.11.3. Sales Footprint

            22.3.11.4. Strategy Overview

                22.3.11.4.1. Marketing Strategy

                22.3.11.4.2. Product Strategy

                22.3.11.4.3. Channel Strategy

        22.3.12. Motul S.A.

            22.3.12.1. Overview

            22.3.12.2. Product Portfolio

            22.3.12.3. Sales Footprint

            22.3.12.4. Strategy Overview

                22.3.12.4.1. Marketing Strategy

                22.3.12.4.2. Product Strategy

                22.3.12.4.3. Channel Strategy

        22.3.13. LIQUI MOLY

            22.3.13.1. Overview

            22.3.13.2. Product Portfolio

            22.3.13.3. Sales Footprint

            22.3.13.4. Strategy Overview

                22.3.13.4.1. Marketing Strategy

                22.3.13.4.2. Product Strategy

                22.3.13.4.3. Channel Strategy

        22.3.14. PJSC Rosneft Oil Company

            22.3.14.1. Overview

            22.3.14.2. Product Portfolio

            22.3.14.3. Sales Footprint

            22.3.14.4. Strategy Overview

                22.3.14.4.1. Marketing Strategy

                22.3.14.4.2. Product Strategy

                22.3.14.4.3. Channel Strategy

        22.3.15. Klüber Lubrication

            22.3.15.1. Overview

            22.3.15.2. Product Portfolio

            22.3.15.3. Sales Footprint

            22.3.15.4. Strategy Overview

                22.3.15.4.1. Marketing Strategy

                22.3.15.4.2. Product Strategy

                22.3.15.4.3. Channel Strategy

        22.3.16. PKN ORLEN S.A.

            22.3.16.1. Overview

            22.3.16.2. Product Portfolio

            22.3.16.3. Sales Footprint

            22.3.16.4. Strategy Overview

                22.3.16.4.1. Marketing Strategy

                22.3.16.4.2. Product Strategy

                22.3.16.4.3. Channel Strategy

        22.3.17. Carl Bechem Lubricants

            22.3.17.1. Overview

            22.3.17.2. Product Portfolio

            22.3.17.3. Sales Footprint

            22.3.17.4. Strategy Overview

                22.3.17.4.1. Marketing Strategy

                22.3.17.4.2. Product Strategy

                22.3.17.4.3. Channel Strategy

        22.3.18. Valvoline Global Operations

            22.3.18.1. Overview

            22.3.18.2. Product Portfolio

            22.3.18.3. Sales Footprint

            22.3.18.4. Strategy Overview

                22.3.18.4.1. Marketing Strategy

                22.3.18.4.2. Product Strategy

                22.3.18.4.3. Channel Strategy

23. Assumptions and Acronyms Used

24. Research Methodology

List of Tables

Table 01: Market Volume (Kilo Ton) Analysis and Forecast By Product Type, 2018 to 2033

Table 02: Market Volume (Kilo Ton) Analysis and Forecast By Product Type, 2018 to 2033

Table 03: Market Size (US$ million) Analysis and Forecast By Product Type, 2018 to 2033

Table 04: Market Volume Size (US$ million) Analysis and Forecast By Product Type, 2018 to 2033

Table 05: Market Size (US$ million) and Volume (Kilo Ton) Analysis and Forecast By Base Oil, 2018 to 2033

Table 06: Market Size Volume (Kilo Ton) Analysis and Forecast By End Use, 2018 to 2033

Table 07: Market Size Volume (Kilo Ton) Analysis and Forecast By End Use, 2018 to 2033

Table 08: Market Size (US$ million) Analysis and Forecast By End Use, 2018 to 2033

Table 09: Market Size (US$ million) Analysis and Forecast By End Use, 2018 to 2033

Table 10: Market Value (US$ million) and Volume (KT) Historical Data 2018-2022 and Forecast 2023 to 2033 By Country

Table 11: Germany Market Volume (Kilo Ton) Analysis and Forecast By Product Type, 2018 to 2033

Table 12: Germany Market Volume (Kilo Ton) Analysis and Forecast By Product Type, 2018 to 2033

Table 13: Germany Market Size (US$ million) Analysis and Forecast By Product Type, 2018 to 2033

Table 14: Germany Market Volume Size (US$ million) Analysis and Forecast By Product Type, 2018 to 2033

Table 15: Germany Market Size (US$ million) and Volume (Kilo Ton) Analysis and Forecast By Base Oil, 2018 to 2033

Table 16: Germany Market Size Volume (Kilo Ton) Analysis and Forecast By End Use, 2018 to 2033

Table 17: Germany Market Size Volume (Kilo Ton) Analysis and Forecast By End Use, 2018 to 2033

Table 18: Germany Market Size (US$ million) Analysis and Forecast By End Use, 2018 to 2033

Table 19: Germany Market Size (US$ million) Analysis and Forecast By End Use, 2018 to 2033

Table 20: Italy Market Volume (Kilo Ton) Analysis and Forecast By Product Type, 2018 to 2033

Table 21: Italy Market Volume (Kilo Ton) Analysis and Forecast By Product Type, 2018 to 2033

Table 22: Italy Market Size (US$ million) Analysis and Forecast By Product Type, 2018 to 2033

Table 23: Italy Market Volume Size (US$ million) Analysis and Forecast By Product Type, 2018 to 2033

Table 24: Italy Market Size (US$ million) and Volume (Kilo Ton) Analysis and Forecast By Base Oil, 2018 to 2033

Table 25: Italy Market Size Volume (Kilo Ton) Analysis and Forecast By End Use, 2018 to 2033

Table 26: Italy Market Size Volume (Kilo Ton) Analysis and Forecast By End Use, 2018 to 2033

Table 27: Italy Market Size (US$ million) Analysis and Forecast By End Use, 2018 to 2033

Table 28: Italy Market Size (US$ million) Analysis and Forecast By End Use, 2018 to 2033

Table 29: France Market Volume (Kilo Ton) Analysis and Forecast By Product Type, 2018 to 2033

Table 30: France Market Volume (Kilo Ton) Analysis and Forecast By Product Type, 2018 to 2033

Table 31: France Market Size (US$ million) Analysis and Forecast By Product Type, 2018 to 2033

Table 32: France Market Volume Size (US$ million) Analysis and Forecast By Product Type, 2018 to 2033

Table 33: France Market Size (US$ million) and Volume (Kilo Ton) Analysis and Forecast By Base Oil, 2018 to 2033

Table 34: France Market Size Volume (Kilo Ton) Analysis and Forecast By End Use, 2018 to 2033

Table 35: France Market Size Volume (Kilo Ton) Analysis and Forecast By End Use, 2018 to 2033

Table 36: France Market Size (US$ million) Analysis and Forecast By End Use, 2018 to 2033

Table 37: France Market Size (US$ million) Analysis and Forecast By End Use, 2018 to 2033

Table 38: United Kingdom Market Volume (Kilo Ton) Analysis and Forecast By Product Type, 2018 to 2033

Table 39: United Kingdom Market Volume (Kilo Ton) Analysis and Forecast By Product Type, 2018 to 2033

Table 40: United Kingdom Market Size (US$ million) Analysis and Forecast By Product Type, 2018 to 2033

Table 41: United Kingdom Market Volume Size (US$ million) Analysis and Forecast By Product Type, 2018 to 2033

Table 42: United Kingdom Market Size (US$ million) and Volume (Kilo Ton) Analysis and Forecast By Base Oil, 2018 to 2033

Table 43: United Kingdom Market Size Volume (Kilo Ton) Analysis and Forecast By End Use, 2018 to 2033

Table 44: United Kingdom Market Size Volume (Kilo Ton) Analysis and Forecast By End Use, 2018 to 2033

Table 45: United Kingdom Market Size (US$ million) Analysis and Forecast By End Use, 2018 to 2033

Table 46: United Kingdom Market Size (US$ million) Analysis and Forecast By End Use, 2018 to 2033

Table 47: Spain Market Volume (Kilo Ton) Analysis and Forecast By Product Type, 2018 to 2033

Table 48: Spain Market Volume (Kilo Ton) Analysis and Forecast By Product Type, 2018 to 2033

Table 49: Spain Market Size (US$ million) Analysis and Forecast By Product Type, 2018 to 2033

Table 50: Spain Market Volume Size (US$ million) Analysis and Forecast By Product Type, 2018 to 2033

Table 51: Spain Market Size (US$ million) and Volume (Kilo Ton) Analysis and Forecast By Base Oil, 2018 to 2033

Table 52: Spain Market Size Volume (Kilo Ton) Analysis and Forecast By End Use, 2018 to 2033

Table 53: Spain Market Size Volume (Kilo Ton) Analysis and Forecast By End Use, 2018 to 2033

Table 54: Spain Market Size (US$ million) Analysis and Forecast By End Use, 2018 to 2033

Table 55: Spain Market Size (US$ million) Analysis and Forecast By End Use, 2018 to 2033

Table 56: Russia Market Volume (Kilo Ton) Analysis and Forecast By Product Type, 2018 to 2033

Table 57: Russia Market Volume (Kilo Ton) Analysis and Forecast By Product Type, 2018 to 2033

Table 58: Russia Market Size (US$ million) Analysis and Forecast By Product Type, 2018 to 2033

Table 59: Russia Market Volume Size (US$ million) Analysis and Forecast By Product Type, 2018 to 2033

Table 60: Russia Market Size (US$ million) and Volume (Kilo Ton) Analysis and Forecast By Base Oil, 2018 to 2033

Table 61: Russia Market Size Volume (Kilo Ton) Analysis and Forecast By End Use, 2018 to 2033

Table 62: Russia Market Size Volume (Kilo Ton) Analysis and Forecast By End Use, 2018 to 2033

Table 63: Russia Market Size (US$ million) Analysis and Forecast By End Use, 2018 to 2033

Table 64: Russia Market Size (US$ million) Analysis and Forecast By End Use, 2018 to 2033

Table 65: BENELUX Market Volume (Kilo Ton) Analysis and Forecast By Product Type, 2018 to 2033

Table 66: BENELUX Market Volume (Kilo Ton) Analysis and Forecast By Product Type, 2018 to 2033

Table 67: BENELUX Market Size (US$ million) Analysis and Forecast By Product Type, 2018 to 2033

Table 68: BENELUX Market Volume Size (US$ million) Analysis and Forecast By Product Type, 2018 to 2033

Table 69: BENELUX Market Size (US$ million) and Volume (Kilo Ton) Analysis and Forecast By Base Oil, 2018 to 2033

Table 70: BENELUX Market Size Volume (Kilo Ton) Analysis and Forecast By End Use, 2018 to 2033

Table 71: BENELUX Market Size Volume (Kilo Ton) Analysis and Forecast By End Use, 2018 to 2033

Table 72: BENELUX Market Size (US$ million) Analysis and Forecast By End Use, 2018 to 2033

Table 73: BENELUX Market Size (US$ million) Analysis and Forecast By End Use, 2018 to 2033

Table 74: Rest of Market Volume (Kilo Ton) Analysis and Forecast By Product Type, 2018 to 2033

Table 75: Rest of Market Volume (Kilo Ton) Analysis and Forecast By Product Type, 2018 to 2033

Table 76: Rest of Market Size (US$ million) Analysis and Forecast By Product Type, 2018 to 2033

Table 77: Rest of Market Volume Size (US$ million) Analysis and Forecast By Product Type, 2018 to 2033

Table 78: Rest of Market Size (US$ million) and Volume (Kilo Ton) Analysis and Forecast By Base Oil, 2018 to 2033

Table 79: Rest of Market Size Volume (Kilo Ton) Analysis and Forecast By End Use, 2018 to 2033

Table 80: Rest of Market Size Volume (Kilo Ton) Analysis and Forecast By End Use, 2018 to 2033

Table 81: Rest of Market Size (US$ million) Analysis and Forecast By End Use, 2018 to 2033

Table 82: Rest of Market Size (US$ million) Analysis and Forecast By End Use, 2018 to 2033

List of Charts

Figure 01: Market Historical Volume (kilo tons), 2018 to 2022

Figure 02: Market Current and Forecast Volume (kilo tons), 2023 to 2033

Figure 03: Market Historical Value (US$ million), 2018 to 2022

Figure 04: Market Current and Forecast Value (US$ million), 2023 to 2033

Figure 05: Market Incremental $ Opportunity (US$ million), 2023 to 2033

Figure 06: Market Share and BPS Analysis By Product Type, 2023 & 2033

Figure 07: Market Y-o-Y Growth Projections By Product Type, 2023 to 2033

Figure 08: Market Attractiveness Analysis By Product Type, 2023 to 2033

Figure 09: Market Absolute $ Opportunity by Hydraulic Fluids Segment, 2018 to 2033

Figure 10: Market Absolute $ Opportunity by Metal Working Fluids Segment, 2018 to 2033

Figure 11: Market Absolute $ Opportunity by Gear Oil Segment, 2018 to 2033

Figure 12: Market Absolute $ Opportunity by Compressor Oil Segment, 2018 to 2033

Figure 13: Market Absolute $ Opportunity by Grease Segment, 2018 to 2033

Figure 14: Market Absolute $ Opportunity by Turbine Oil Segment, 2018 to 2033

Figure 15: Market Absolute $ Opportunity by Transformer Oil Segment, 2018 to 2033

Figure 16: Market Absolute $ Opportunity by Refrigeration Oil Segment, 2018 to 2033

Figure 17: Market Absolute $ Opportunity by Textile Machinery Lubricants Segment, 2018 to 2033

Figure 18: Market Absolute $ Opportunity by Others Segment, 2018 to 2033

Figure 19: Market Share and BPS Analysis By Base Oil, 2023 & 2033

Figure 20: Market Y-o-Y Growth Projections By Base Oil, 2023 to 2033

Figure 21: Market Attractiveness Analysis By Base Oil, 2023 to 2033

Figure 22: Market Absolute $ Opportunity by Mineral Oil Segment, 2018 to 2033

Figure 23: Market Absolute $ Opportunity by Synthetic Oil Segment, 2018 to 2033

Figure 24: Market Absolute $ Opportunity by Bio-based Oil Segment, 2018 to 2033

Figure 25: Market Share and BPS Analysis By End Use, 2023 & 2033

Figure 26: Market Y-o-Y Growth Projections By End Use, 2023 to 2033

Figure 27: Market Attractiveness Analysis By End Use, 2023 to 2033

Figure 28: Market Absolute $ Opportunity by Construction Segment, 2018 to 2033

Figure 29: Market Absolute $ Opportunity by Metal & Mining Segment, 2018 to 2033

Figure 30: Market Absolute $ Opportunity by Cement Production Segment, 2018 to 2033

Figure 31: Market Absolute $ Opportunity by Power Generation Segment, 2018 to 2033

Figure 32: Market Absolute $ Opportunity by Automotive Segment, 2018 to 2033

Figure 33: Market Absolute $ Opportunity by Chemical Production Segment, 2018 to 2033

Figure 34: Market Absolute $ Opportunity by Textile Manufacturing Segment, 2018 to 2033

Figure 35: Market Absolute $ Opportunity by Oil & Gas Segment, 2018 to 2033

Figure 36: Market Absolute $ Opportunity by Textile Manufacturing Segment, 2018 to 2033

Figure 37: Market Absolute $ Opportunity by Food Processing Segment, 2018 to 2033

Figure 38: Market Absolute $ Opportunity by Pulp & Paper Segment, 2018 to 2033

Figure 39: Market Absolute $ Opportunity by Marine Applications Segment, 2018 to 2033

Figure 40: Market Absolute $ Opportunity by Others Segment, 2018 to 2033

Figure 41: Market Share and BPS Analysis By Country– 2023 & 2023

Figure 42: Market Y-o-Y Growth Projection By Country, 2023 to 2033

Figure 43: Market Attractiveness Index By Country, 2023 to 2033

Figure 44: Market Absolute $ Opportunity by Germany Segment, 2018 to 2033

Figure 45: Market Absolute $ Opportunity by Italy Segment, 2018 to 2033

Figure 46: Market Absolute $ Opportunity by France Segment, 2018 to 2033

Figure 47: Market Absolute $ Opportunity by United Kingdom Segment, 2018 to 2033

Figure 48: Market Absolute $ Opportunity by Spain Segment, 2018 to 2033

Figure 49: Market Absolute $ Opportunity by Russia Segment, 2018 to 2033

Figure 50: Market Absolute $ Opportunity by BENELUX Segment, 2018 to 2033

Figure 51: Market Absolute $ Opportunity by Rest of Europe Segment, 2018 to 2033

Figure 52: Germany Market Share and BPS Analysis By Product Type, 2023 & 2033

Figure 53: Germany Market Y-o-Y Growth Projections By Product Type, 2023 to 2033

Figure 54: Germany Market Attractiveness Analysis By Product Type, 2023 to 2033

Figure 55: Germany Market Share and BPS Analysis By Base Oil, 2023 & 2033

Figure 56: Germany Market Y-o-Y Growth Projections By Base Oil, 2023 to 2033

Figure 57: Germany Market Attractiveness Analysis By Base Oil, 2023 to 2033

Figure 58: Germany Market Share and BPS Analysis By End Use, 2023 & 2033

Figure 59: Germany Market Y-o-Y Growth Projections By End Use, 2023 to 2033

Figure 60: Germany Market Attractiveness Analysis By End Use, 2023 to 2033

Figure 61: Italy Market Share and BPS Analysis By Product Type, 2023 & 2033

Figure 62: Italy Market Y-o-Y Growth Projections By Product Type, 2023 to 2033

Figure 63: Italy Market Attractiveness Analysis By Product Type, 2023 to 2033

Figure 64: Italy Market Share and BPS Analysis By Base Oil, 2023 & 2033

Figure 65: Italy Market Y-o-Y Growth Projections By Base Oil, 2023 to 2033

Figure 66: Italy Market Attractiveness Analysis By Base Oil, 2023 to 2033

Figure 67: Italy Market Share and BPS Analysis By End Use, 2023 & 2033

Figure 68: Italy Market Y-o-Y Growth Projections By End Use, 2023 to 2033

Figure 69: Italy Market Attractiveness Analysis By End Use, 2023 to 2033

Figure 70: France Market Share and BPS Analysis By Product Type, 2023 & 2033

Figure 71: France Market Y-o-Y Growth Projections By Product Type, 2023 to 2033

Figure 72: France Market Attractiveness Analysis By Product Type, 2023 to 2033

Figure 73: France Market Share and BPS Analysis By Base Oil, 2023 & 2033

Figure 74: France Market Y-o-Y Growth Projections By Base Oil, 2023 to 2033

Figure 75: France Market Attractiveness Analysis By Base Oil, 2023 to 2033

Figure 76: France Market Share and BPS Analysis By End Use, 2023 & 2033

Figure 77: France Market Y-o-Y Growth Projections By End Use, 2023 to 2033

Figure 78: France Market Attractiveness Analysis By End Use, 2023 to 2033

Figure 79: United Kingdom Market Share and BPS Analysis By Product Type, 2023 & 2033

Figure 80: United Kingdom Market Y-o-Y Growth Projections By Product Type, 2023 to 2033

Figure 81: United Kingdom Market Attractiveness Analysis By Product Type, 2023 to 2033

Figure 82: United Kingdom Market Share and BPS Analysis By Base Oil, 2023 & 2033

Figure 83: United Kingdom Market Y-o-Y Growth Projections By Base Oil, 2023 to 2033

Figure 84: United Kingdom Market Attractiveness Analysis By Base Oil, 2023 to 2033

Figure 85: United Kingdom Market Share and BPS Analysis By End Use, 2023 & 2033

Figure 86: United Kingdom Market Y-o-Y Growth Projections By End Use, 2023 to 2033

Figure 87: United Kingdom Market Attractiveness Analysis By End Use, 2023 to 2033

Figure 88: Spain Market Share and BPS Analysis By Product Type, 2023 & 2033

Figure 89: Spain Market Y-o-Y Growth Projections By Product Type, 2023 to 2033

Figure 90: Spain Market Attractiveness Analysis By Product Type, 2023 to 2033

Figure 91: Spain Market Share and BPS Analysis By Base Oil, 2023 & 2033

Figure 92: Spain Market Y-o-Y Growth Projections By Base Oil, 2023 to 2033

Figure 93: Spain Market Attractiveness Analysis By Base Oil, 2023 to 2033

Figure 94: Spain Market Share and BPS Analysis By End Use, 2023 & 2033

Figure 95: Spain Market Y-o-Y Growth Projections By End Use, 2023 to 2033

Figure 96: Spain Market Attractiveness Analysis By End Use, 2023 to 2033

Figure 97: Russia Market Share and BPS Analysis By Product Type, 2023 & 2033

Figure 98: Russia Market Y-o-Y Growth Projections By Product Type, 2023 to 2033

Figure 99: Russia Market Attractiveness Analysis By Product Type, 2023 to 2033

Figure 100: Russia Market Share and BPS Analysis By Base Oil, 2023 & 2033

Figure 101: Russia Market Y-o-Y Growth Projections By Base Oil, 2023 to 2033

Figure 102: Russia Market Attractiveness Analysis By Base Oil, 2023 to 2033

Figure 103: Russia Market Share and BPS Analysis By End Use, 2023 & 2033

Figure 104: Russia Market Y-o-Y Growth Projections By End Use, 2023 to 2033

Figure 105: Russia Market Attractiveness Analysis By End Use, 2023 to 2033

Figure 106: BENELUX Market Share and BPS Analysis By Product Type, 2023 & 2033

Figure 107: BENELUX Market Y-o-Y Growth Projections By Product Type, 2023 to 2033

Figure 108: BENELUX Market Attractiveness Analysis By Product Type, 2023 to 2033

Figure 109: BENELUX Market Share and BPS Analysis By Base Oil, 2023 & 2033

Figure 110: BENELUX Market Y-o-Y Growth Projections By Base Oil, 2023 to 2033

Figure 111: BENELUX Market Attractiveness Analysis By Base Oil, 2023 to 2033

Figure 112: BENELUX Market Share and BPS Analysis By End Use, 2023 & 2033

Figure 113: BENELUX Market Y-o-Y Growth Projections By End Use, 2023 to 2033

Figure 114: BENELUX Market Attractiveness Analysis By End Use, 2023 to 2033

Figure 115: Rest of Market Share and BPS Analysis By Product Type, 2023 & 2033

Figure 116: Rest of Market Y-o-Y Growth Projections By Product Type, 2023 to 2033

Figure 117: Rest of Market Attractiveness Analysis By Product Type, 2023 to 2033

Figure 118: Rest of Market Share and BPS Analysis By Base Oil, 2023 & 2033

Figure 119: Rest of Market Y-o-Y Growth Projections By Base Oil, 2023 to 2033

Figure 120: Rest of Market Attractiveness Analysis By Base Oil, 2023 to 2033

Figure 121: Rest of Market Share and BPS Analysis By End Use, 2023 & 2033

Figure 122: Rest of Market Y-o-Y Growth Projections By End Use, 2023 to 2033

Figure 123: Rest of Market Attractiveness Analysis By End Use, 2023 to 2033

Recommendations

Chemicals & Materials

Lubricant Market

Published : February 2024

Chemicals & Materials

India Industrial Lubricants Market

Published : June 2023

Explore Chemicals & Materials Insights

View Reports

Europe Industrial Lubricants Market